The population’s aging underscores the need to understand the process and define the physiologic markers predictive of healthy longevity. The findings that aging is associated with a progressive decrease in heart rate variability (HRV), an index of autonomic function, suggests that longevity might depend on preservation of autonomic function. However, little is known about late life changes. We assessed the relation between autonomic function and longevity by a cross-sectional study of HRV of 344 healthy subjects, 10 to 99 years old. The HRV was determined from 24-hour Holter records, using 4 time domain measures of HRV (the root mean square of the successive normal sinus RR interval difference [rMSSD], percentage of successive normal sinus RR intervals >50 ms [pNN50], standard deviation of all normal sinus RR intervals during a 24-hour period [SDNN], and standard deviation of the averaged normal sinus RR intervals for all 5-minute segments [SDANN]). Autonomic modulation of the 4 measures differs, permitting distinctions between changes in HRV–parasympathetic function, using rMSSD and pNN50, and HRV–sympathetic function using SDNN and SDANN. Decade values were compared using analysis of variance and t-multiple comparison testing. The HRV of all measures decreases rapidly from the second to fifth decades. It then slows. The HRV–sympathetic function continues to decrease throughout life. In contrast, the decrease in HRV–parasympathetic function reaches its nadir in the eighth decade, followed by reversal and a progressive increase to higher levels (p <0.05), more characteristic of a younger population. In conclusion, healthy longevity depends on preservation of autonomic function, in particular, HRV–parasympathetic function, despite the early age-related decrease. The eighth decade reversal of the decrease in HRV–parasympathetic function and its subsequent increase are key determinants of longevity. Persistently high HRV in the elderly represents a marker predictive of longevity.
Little is known about the late age-related changes in autonomic function, in part, because very few studies have included the “oldest” older subjects (>85 years). Moreover, few studies have fully used the 4 time domain measures of heart rate variability (HRV): the root mean square of the successive normal sinus RR interval difference (rMSSD), percentage of successive normal sinus RR intervals >50 ms (pNN50), standard deviation of all normal sinus RR intervals during a 24-hour period (SDNN), and standard deviation of the averaged normal sinus RR intervals for all 5-minute segments (SDANN). Restrictions to using SDNN and/or SDANN, both of which are predominantly markers of HRV–sympathetic function (HRV–SF), might detract from the analysis of HRV–parasympathetic function (HRV–PF). The present study sought to determine the relation between longevity and autonomic function (parasympathetic and sympathetic), through analyses of the HRV, determined from 24-hour Holter monitoring, using 4 standard time domain measures (rMSSD, pNN50, SDNN, and SDANN).
Methods
A total of 344 healthy subjects, aged 10 to 99 years (159 males and 185 females), were recruited to the present study. Of the 344 subjects, 221 were outpatients who had gone to the physician’s office for a routine medical evaluation; 12 were healthy elderly subjects from assisted living communities; and 111 were healthy volunteers (30 from the Chicago and Elk Grove area and 81 from northern California).
Healthy subjects were defined as those without clinical evidence of organic disease. Oral contraceptives and low-dose aspirin were the only allowed medications. Their health status was established by a complete medical history, physical examination, and laboratory tests, including electrocardiography at rest, fasting blood chemistry panels, a complete blood cell count, and urinalysis. All subjects gave informed consent, with informed consent for minors (<18 years old) obtained from their parents or legal guardians.
All subjects underwent 24-hour ambulatory Holter monitoring. Of the 344 subjects, 263 were monitored using a Cardionostics Dura-Lite recorder (Cardionostics, Roche Biomedical, Tucker, Georgia). Of these, the records of 107 subjects were analyzed using the Premier IV Holter program, version 1.10, Holter system (Cardiac Research, Tampa, Florida) and 156 using the Epicardia 4000 53A-01 Program (Medicomp, Melbourne, Florida). The remaining 81 subjects from California were monitored using Del Mar 459 recorders, and the records were analyzed using the model 463 Accu-plus Holter Analyzer (Del Mar Avionics, Irvine, California).
The recordings were manually analyzed and interpreted by an experienced cardiologist and a research fellow (DHS, UZ). Each beat was classified and labeled with respect to origin, using template matching techniques. The analysis programs eliminated 1 RR interval before, and 2 after, each nonsinus beat. The recordings that were <20 hours in duration and those with ectopic activity >10% of the total heart beats and/or with paced rhythms were excluded. To ascertain intersystem variability, randomly selected Holter tapes were cross-analyzed using all 3 programs. Records exhibiting >10% HRV differences among the 3 programs were excluded.
The HRV was computed for each subject using the 4 standard 24-hour time domain measures: rMSSD, pNN50, SDNN, and SDANN.
These measures exhibit different autonomic modulation; rMSSD and pNN50 exhibit parasympathetic modulation and SDNN and SDANN mostly sympathetic modulation. The HRV determinations were averaged on a single-decade (ages 10 to 79 years) and 2-decade (ages 80 to 99 years) basis. To define the age-related changes in HRV–PF relative to HRV–SF, the PF/SF ratio was determined for each decade.
The results are expressed as the mean ± SD. Analysis of variance and Tukey’s multiple comparison tests were used to determine the interdecade differences in HRV. A linear regression model was applied to test the relations between HRV and aging. The linear and quadratic equations were compared for all 4 HRV measures, and the best fit approximation was chosen. Fitted regression lines and upper and lower 95% confidence intervals for the predicted mean response were drawn. Differences were considered significant at p <0.05. The analyses were performed using Statistical Analysis Systems (PROC ANOVA and PROC REG, version 9.1, SAS Institute, Cary, North Carolina). The PF/SF ratios were compared using Tukey’s honest significant difference post hoc test.
Results
Table 1 lists the mean values for the HRV ± SD of healthy subjects across 9 decades determined using the 4 time domain measures. The patterns of age-related changes in HRV were measure dependant.
| Age (years)/Total Subjects | rMSSD (ms) | pNN50 (%) | SDNN (ms) | SDANN (ms) |
|---|---|---|---|---|
| 10–19/n = 22 | 53 ± 16 | 26 ± 13 | 173 ± 33 | 151 ± 33 |
| 20–29/n = 47 | 41 ± 16 ⁎ | 17 ± 12 ⁎ | 151 ± 37 | 134 ± 36 |
| 30–39/n = 54 | 36 ± 15 ⁎ | 14 ± 11 ⁎ | 145 ± 41 ⁎ | 129 ± 40 |
| 40–49/n = 96 | 27 ± 10 ⁎ † ‡ | 8 ± 7 ⁎ † ‡ | 125 ± 33 ⁎ † ‡ | 112 ± 35 ⁎ † |
| 50–59/n = 43 | 24 ± 11 ⁎ † ‡ | 6 ± 7 ⁎ † ‡ | 120 ± 37 ⁎ † ‡ | 108 ± 38 ⁎ † |
| 60–69/n = 38 | 20 ± 10 ⁎ † ‡ | 4 ± 6 ⁎ † ‡ | 114 ± 33 ⁎ † ‡ | 106 ± 34 ⁎ † ‡ |
| 70–79/n = 24 | 19 ± 7 ⁎ † ‡ | 3 ± 3 ⁎ † ‡ | 116 ± 29 ⁎ † ‡ | 107 ± 30 ⁎ |
| 80–99/n = 20 | 30 ± 21 ⁎ † § | 10 ± 14 ⁎ † § | 109 ± 30 ⁎ † ‡ | 99 ± 29 ⁎ † ‡ |
⁎ Other age ranges versus 10–19 years (p <0.05);
† other age ranges versus 20–29 years (p <0.05);
‡ other age ranges versus 30–39 years (p <0.05);
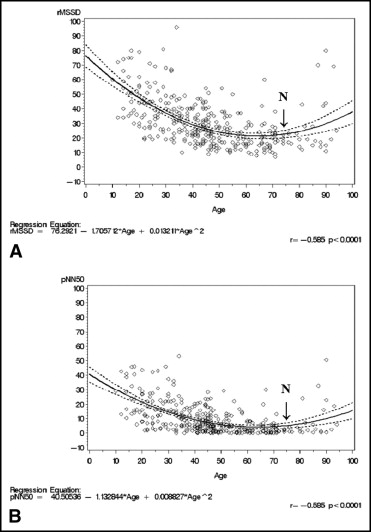
The HRV–PF, determined using rMSSD and pNN50, exhibited a rapid and precipitous decrease, in a quadratic regression pattern with aging, particularly from the second to fifth decades (correlation coefficient, r = −0.58 for rMSSD and pNN50; Figure 1 and Table 1 ). However, the decrease in HRV–PF slowed, beginning in the sixth decade, and continued at increasingly slow rates until the mid- to late eighth decade, at which point it reached its nadir. At the nadir, rMSSD had decreased 64% and pNN50 88% from the second-decade baseline values. The nadir then continued until the early ninth decade, at which point the pattern of decrease abruptly reversed itself and HRV–PF began a progressive increase. By the tenth decade, rMSSD and pNN50 had increased 58% and 233%, respectively, from their nadir levels (p <0.05) to the levels characteristic of the fifth decade.
HRV determined using the sympathetically modulated SDNN and SDANN measures decreased uninterruptedly with aging (correlation coefficient r = −0.41 and r = −0.33, respectively; Figure 2 and Table 1 ). The rate and magnitude of the decrease were most pronounced from the second to fifth decades (28% and 26%, respectively, from the second-decade baseline values). The rate of the HRV decrease using SDNN and SDANN measures then slowed and continued at lower rates through the tenth decade, at which point it had reached its lowest levels, with a decrease of 37% and 34%, respectively, from the second-decade baseline values (p <0.05). This sharply contrasted with the decrease in rMSSD and pNN50, which had essentially stopped by the end of eighth decade.
HRV determined using SDNN and SDANN demonstrated a less steep, linear regression pattern of decrease than the steeper, quadratic regression pattern using rMSSD and pNN50.
Given the divergent patterns of age-related changes in HRV–PF and HRV–SF, the ratios of the 2 were also calculated to compare the changes in PF and SF. Table 2 lists the effects of aging on the ratios of HRV–PF/SF using rMSSD/SDNN, rMSSD/SDANN, pNN50/SDNN, pNN50/SDANN, and rMSSD plus pNN50/SDNN plus SDANN. Figure 3 shows a whisker plot of the age-related changes in the ratio of pNN50 plus rMSSD/SDNN plus SDANN. Figure 3 also shows the data distribution and indicates the degrees of dispersion and skewing.
| Age (years) | rMSSD/SDNN | rMSSD/SDANN | pNN50/SDNN | pNN50/SDANN | rMSSD + pNN50/SDNN + SDANN |
|---|---|---|---|---|---|
| 10–19 | 0.31 ± 0.08 | 0.37 ± 0.14 | 0.15 ± 0.07 | 0.18 ± 0.10 | 0.25 ± 0.09 |
| 20–29 | 0.27 ± 0.06 | 0.31 ± 0.09 | 0.10 ± 0.06 | 0.12 ± 0.07 † | 0.20 ± 0.07 |
| 30–39 | 0.25 ± 0.08 | 0.29 ± 0.12 | 0.09 ± 0.06 † | 0.10 ± 0.08 † | 0.18 ± 0.08 † |
| 40–49 | 0.22 ± 0.07 † ‡ § | 0.25 ± 0.10 † | 0.06 ± 0.05 † ‡ ¶ | 0.07 ± 0.06 † ‡ | 0.15 ± 0.07 † ‡ § |
| 50–59 | 0.21 ± 0.08 † ‡ § | 0.24 ± 0.10 † § | 0.04 ± 0.04 † ‡ § ¶ | 0.05 ± 0.05 † ‡ § ¶ | 0.13 ± 0.07 † ‡ § |
| 60–69 | 0.18 ± 0.08 † ‡ § ¶ | 0.20 ± 0.10 † ‡ § ¶ | 0.03 ± 0.05 † ‡ § ¶ | 0.04 ± 0.06 † ‡ § ¶ | 0.11 ± 0.07 † ‡ § ¶ |
| 70–79 | 0.17 ± 0.06 † ‡ § ¶ | 0.19 ± 0.07 † ‡ § ¶ | 0.02 ± 0.02 † ‡ § ¶ | 0.03 ± 0.03 † ‡ § ¶ | 0.10 ± 0.04 † ‡ § ¶ |
| 80–99 | 0.29 ± 0.21 | 0.34 ± 0.28 | 0.10 ± 0.14 | 0.12 ± 0.18 | 0.21 ± 0.20 |
Stay updated, free articles. Join our Telegram channel

Full access? Get Clinical Tree


