Fish oil supplementation (FOS) is known to have cardiovascular benefits. However, the effects of FOS on thrombosis are incompletely understood. We sought to determine if the use of FOS is associated with lower indices of atherothrombotic risk in patients with suspected coronary artery disease (sCAD). This is a subgroup analysis of consecutive patients with sCAD (n = 600) enrolled in the Multi-Analyte, Thrombogenic, and Genetic Markers of Atherosclerosis study. Patients on FOS were compared with patients not on FOS. Lipid profile was determined by vertical density gradient ultracentrifugation (n = 520), eicosapentaenoic acid + docosahexaenoic acid was measured by gas chromatography (n = 437), and AtherOx testing was performed by immunoassay (n = 343). Thromboelastography (n = 419), ADP- and collagen-induced platelet aggregation (n = 137), and urinary 11-dehydrothromboxane B 2 levels (n = 259) were performed immediately before elective coronary angiography. In the total population, FOS was associated with higher eicosapentaenoic acid + docosahexaenoic acid content (p <0.001), lower triglycerides (p = 0.04), total very low–density lipoprotein cholesterol (p = 0.002), intermediate-density lipoprotein cholesterol (p = 0.02), and AtherOx levels (p = 0.02) but not in patients on lipid-lowering therapy. Patients not on lipid-lowering therapy taking FOS had lower very low–density lipoprotein cholesterol, intermediate-density lipoprotein cholesterol, remnant lipoproteins, triglycerides, low-density lipoprotein cholesterol, AtherOx levels, collagen-induced platelet aggregation, thrombin-induced platelet-fibrin clot strength, and shear elasticity (p <0.03 for all). In clopidogrel-treated patients, there was no difference in ADP-induced aggregation between FOS groups. Patients on FOS had lower urinary 11-dehydrothromboxane B 2 levels regardless of lipid-lowering therapy (p <0.04). In conclusion, the findings of this study support the potential benefit of FOS for atherothrombotic risk reduction in sCAD with the greatest benefit in patients not receiving lipid-lowering therapy. Future prospective studies to compare FOS with lipid-lowering therapy and to assess the independent effects of FOS on thrombogenicity are needed.
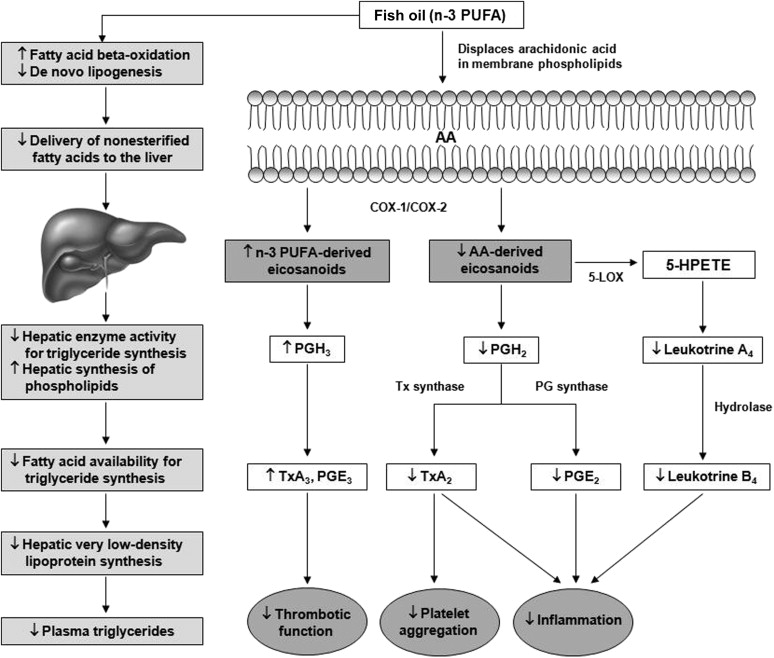
The effects of fish oil supplementation (FOS) on thrombosis are inconsistent and not well understood. Polyunsaturated fatty acids (PUFAs) compete with arachidonic acid (AA) for esterification into platelet membrane phospholipids and act as substrates for cyclo-oxygenase and lipoxygenase. The net effect of these reactions is reduced synthesis of AA-derived eicosanoids and increased synthesis of n-3 (Omega-3) PUFA eicosanoids ( Figure 1 ). The production of less biologically active n-3 PUFA derivatives (i.e., prostaglandin-E 3 and thromboxane-A 3 ) compared with proinflammatory and/or prothrombotic AA derivatives (i.e., prostaglandin-E 2 and thromboxane-A 2 ) may contribute to reduced platelet activation and reduced tendency for thrombosis with FOS. However, the inhibition of pro-aggregatory thromboxane biosynthesis by n-3 PUFA is thought to be of marginal significance, and well below that which is produced by low-dose aspirin therapy, suggesting that any reduction in platelet function is most likely the product of a different mechanism. In this study, we sought to ascertain if use of FOS was associated with a reduced overall atherothrombotic risk profile in patients with suspected coronary artery disease (sCAD) by measuring lipid levels and markers of thrombogenicity simultaneously.


Methods
This is an observational case series study that compares use of FOS in various subgroups. After approval and written informed consent from the institutional review board, 600 consecutive patients with sCAD on daily 325 mg aspirin therapy were enrolled before elective cardiac catheterization in the Multi-Analyte, Thrombogenic, and Genetic Markers of Atherosclerosis study (NCT01276678) from July 2010 to December 2013. Patients were referred for cardiac catheterization for the following reasons: (1) a positive stress test with no angina, (2) a positive stress test with classic angina, and/or (3) a positive computed tomographic scan. Patients were excluded from the study for any of the following reasons: pregnancy, acute infection, experimental drug therapy, blood donation within 8 weeks; any coagulation, bleeding, or blood disorders; ongoing treatment for neoplastic, autoimmune, or connective tissue disease, HIV, or hepatitis C infection; or patients with any abnormal laboratory value or physical finding that according to the investigator may interfere with interpretation of the study results. Patients included in the FOS group were on therapy for at least 1 month before enrollment and taking ≥1,000 mg of fish oil per day, whereas patients in the no fish oil supplementation (NFOS) group were free from all FOS. FOS status was determined through official medical records and confirmed by patient at the time of enrollment. Lipid-lowering therapy status was defined as ongoing treatment with statins, fibrates, niacin, ezetimibe, cholestyramine, colesevelam, or a combination of these therapies.
Blood and urine samples were collected before cardiac catheterization. Patients fasted for >12 hours before cardiac catheterization and took concomitant medications including aspirin and lipid-lowering therapy before arrival. Blood was collected from the antecubital vein or indwelling catheter into one 3.2% trisodium citrate tube and 2 serum separator Vacutainer tubes (Becton-Dickinson, Franklin Lakes, New Jersey), after discarding the initial 3 ml of blood. Thromboelastography was performed within 1 hour of the blood draw as previously described. Serum was separated by centrifugation at 2,000g for 15 minutes and stored at −70°C. Serum samples were batched and shipped on dry ice for analysis by Atherotech Diagnostics Lab (Birmingham, Alabama) for vertical auto profile (VAP) cholesterol testing and OmegaQuant Analytics (Sioux Falls, South Dakota) for eicosapentaenoic acid (EPA) + docosahexaenoic acid (DHA) testing. Urine samples were collected in tubes containing Cholstat tablets (Bio-Medical Products Corp., Mendham, NJ) as a urinary preservative and stored at −70°C until shipment on dry ice. Urine and serum samples were analyzed by Corgenix Medical Corp. (Broomfield, Colorado) for measurements of urinary 11-dehydrothromboxane B 2 (urinary 11-dh TxB 2 ) and oxidized low-density lipoprotein (LDL)-β2 glycoprotein1 complex (Atherox), respectively.
EPA + DHA content in plasma is expressed as a percent of total identified fatty acids and is determined as previously reported. Briefly, samples were thawed, and an aliquot was combined (1:40 parts) with the methylating mixture (boron trifluoride in methanol [14%], toluene, and methanol [35/30/35 v/v]), shaken at 100°C for 45 minutes. After cooling, 40 parts of both hexane and distilled water were added. After briefly vortexing, the samples were spun to separate layers, and an aliquot of the hexane layer that contained the fatty acid methyl esters was analyzed by gas chromatography.
The AspirinWorks ELISA assay (Corgenix Medical Corp.) has been described previously. Briefly, 100 μl of urine in assay buffer was incubated with mouse monoclonal antibody and 11-dh TxB 2 -alkaline phosphatase tracer in a competitive fashion. Urinary 11-dh TxB 2 concentrations were determined by measuring color development at 405 nm with Microplate reader and expressed as picogram per milliliter. Final results were reported as picogram 11dh TxB 2 per milligram creatinine to normalize results for urine concentration.
The VAP is a comprehensive lipoprotein cholesterol profile that is based on a well-established method of ultracentrifugation incorporating a vertical rotor and single density gradient centrifugation. Cholesterol concentrations of high-density lipoprotein (HDL), LDL, very low–density lipoprotein (VLDL), lipoprotein(a) (Lp(a)), intermediate-density lipoprotein (IDL), HDL subclasses (HDL 2 -C and HDL 3 -C), LDL subclasses (LDL 1 -C, LDL 2 -C, LDL 3 -C, and LDL 4 -C), and VLDL subclasses (VLDL 1 -C, VLDL 2 -C, and VLDL 3 -C) were determined. The VAP cholesterol test also characterizes each patient into 1 of 3 patterns, depending on which type of LDL predominates. The larger more buoyant LDL pattern A comprises LDL 1,2 and the smaller denser LDL pattern B comprises LDL 3,4 . Patients can also present with a mixed pattern A/B, where neither pattern predominates. Oxidized LDL (OxLDL)-β 2 -glycoprotein I (β2GPI), a serologic risk factor for the development of atherosclerosis and thrombosis, was measured using the AtherOx ELISA Test Kit by Corgenix Medical Corp.
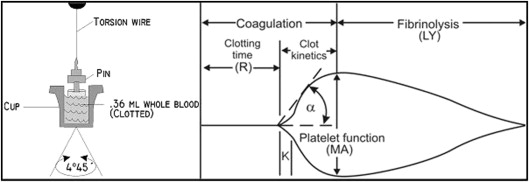
The Thrombelastograph (TEG) Hemostasis Analyzer (Haemonetics, Braintree, Massachusetts) provides quantitative and qualitative measurements of the physical properties of a clot. The TEG is a viscoelastic monitor that measures platelet-fibrin clot strength (Maximum Amplitude [MA], recorded in mm). The sample was assayed in the TEG analyzer according to the manufacturer’s instructions to generate the thrombin-induced platelet-fibrin clot as previously described. Clot strength is determined by measuring the amplitude of rotation of a pin immersed in a rotating cup that increases proportionally with clot strength ( Figure 2 ). Thrombin-induced platelet-fibrin clot strength (TIP-FCS, mm) reflects maximum platelet-fibrin clot strength. Reaction time (R, min), a quantitative representation of the initiation phase of enzymatic clotting factors, is the time from the start of the sample run to the point of clot formation corresponding to an amplitude of 2 mm on the TEG tracing. Coagulation index (CI) is derived from the R, K, and TIP-FCS, and angle (α) of native or kaolin-activated whole-blood tracings, where K is a measure of the speed to reach 20 mm of clot strength from R; angle (α) is reflective of fibrinogen activity and is the size in degrees of the angle formed by the tangent line to TEG tracing measure at the reaction time. The G parameter (shear elastic modulus strength) is the actual measure of clot firmness measured in dyne/cm 2 , which is more indicative of small changes in the clot strength than is the maximum amplitude in millimeter ( Figure 2 ).
Maximum 5 and 20 μM ADP-induced and 4 μg/ml collagen-induced platelet aggregation in platelet-rich plasma was assessed using a Model 490-4D Chronolog Optical Aggregometer (Chronolog Corporation, Havertown, Pennsylvania) as previously described. Light transmittance aggregometry was only performed in patients receiving dual antiplatelet therapy with aspirin and a thienopyridine.
Categorical variables are expressed as number (percentage) and continuous variables as mean ± SD or median (twenty-fifth to seventy-fifth percentile) as appropriate, with p ≤0.05 considered statistically significant. Fisher’s exact test was used for comparison of categorical variables. Student’s t test was used for normally distributed continuous data sets, whereas Welch’s t test was used for continuous data sets that did not follow a normal distribution (Medcalc Statistical Software, Ostend, Belgium).
Results
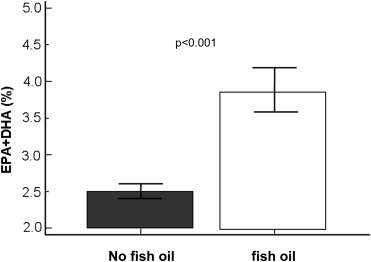
The total patient population primarily consisted of Caucasian men with multiple CV factors and similar use patterns of medications. There was a higher prevalence of diabetes and history of coronary artery bypass grafting and lower platelet count in the total FOS group (n = 128) compared with the NFOS group (n = 472; Table 1 ). The median daily dose of fish oil in the total FOS group was 1,200 mg (1,000 to 2000 mg). Patients reporting FOS use had significantly higher plasma EPA + DHA levels than NFOS users ( Figure 3 ). Patients on lipid-lowering therapy had a higher median daily dose of fish oil compared with patients not on lipid-lowering therapy (2,000 mg [1,000 to 2,000 mg] vs 1,000 mg [1,000 to 2,000 mg], p = 0.02). No statistically significant difference was observed for prevalence of any lipid-lowering medication or CAD severity between FOS and NFOS groups.
| NFOS (n=472) | FOS (n=128) | p-value | |
|---|---|---|---|
| Age (mean ± SD) | 64.4 ± 10.7 | 64.4 ± 10.1 | 0.97 |
| Men | 61.7% | 67.2% | 0.26 |
| Body Mass Index (mean ± SD) (kg/m 2 ) | 30.9 ± 6.9 | 30.7 ± 5.8 | 0.72 |
| Hypercholesterolemia | 79.3% | 79.5% | 0.96 |
| Hypertension | 80.4% | 77.2% | 0.42 |
| Diabetes Mellitus | 37.6% | 27.6% | 0.04 |
| Myocardial Infarction | 22.6% | 19.8% | 0.50 |
| Percutaneous Coronary Intervention | 30.2% | 25.4% | 0.30 |
| Coronary Artery Bypass Grafting | 11.2% | 19.2% | 0.04 |
| Stroke | 7.5% | 8.0% | 0.84 |
| Smoking (Current or Past) | 57.9% | 52.6% | 0.31 |
| Congestive Heart Failure | 7.7% | 6.4% | 0.63 |
| Disease Severity | |||
| Minimal Disease (<25%) | 18.9% | 21.4% | 0.28 |
| Intermediate Disease (25-75%) | 20.0% | 25.4% | 0.33 |
| Severe Disease (>75%) | 61.1% | 53.2% | 0.58 |
| Concomitant Medication | |||
| P2Y 12 Inhibitor | 31.4% | 26.6% | 0.30 |
| Lipid-Lowering Therapy | 71.2% | 70.3% | 0.93 |
| Statins Only | 56.6% | 50.8% | 0.28 |
| Non-statins Only | 4.0% | 3.9% | 0.84 |
| Both Statins and Non-statins | 10.6% | 15.6% | 0.16 |
| Angiotensin Converting EnzymeInhibitor or Blocker | 57.8% | 57.0% | 0.88 |
| Beta Blocker | 56.1% | 48.4% | 0.13 |
| Calcium Channel Blocker | 21.7% | 25.0% | 0.92 |
| Proton Pump Inhibitor | 24.6% | 25.0% | 0.92 |
| Diuretic | 36.2% | 28.1% | 0.12 |
| Laboratory Values (mean ± SD) | |||
| Eicosapentaenoic acid + docosahexaenoic acid (%) | 2.5±0.95 | 3.8±1.5 | <0.0001 |
| White Blood Cell Count (x 1000/mm 3 ) | 7.37 ± 2.09 | 7.16 ± 2.79 | 0.46 |
| Platelet Count (x 1000/mm 3 ) | 229 ± 62 | 215 ± 48 | 0.01 |
| Blood Urea Nitrogen (g/dL) | 18.1 ± 6.9 | 18.8 ± 7.3 | 0.30 |
| Creatinine (mg/dL) | 1.02 ± 0.38 | 1.01 ± 0.27 | 0.85 |

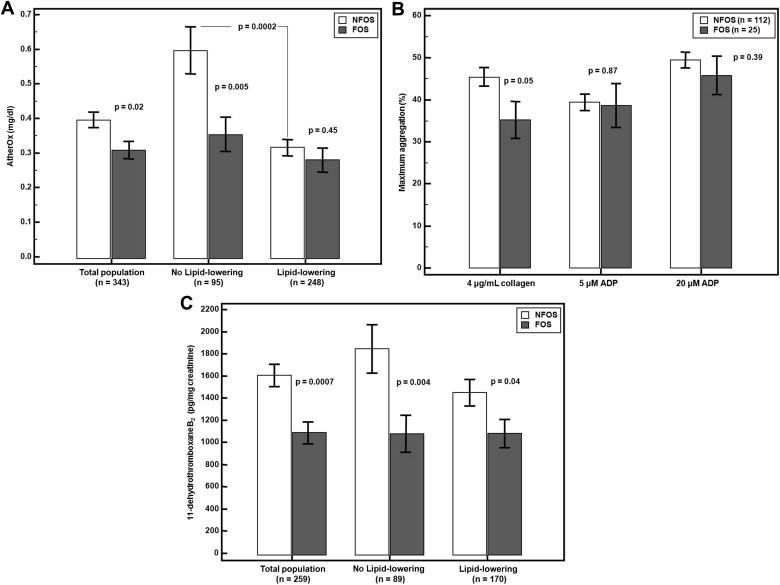
Among the patients who underwent lipid profiling (VAP: n = 520, AtherOx: n = 343), FOS was associated with significantly lower VLDL-C, IDL-C, triglycerides, and AtherOx levels (p <0.05 for all, Table 2 , Figure 4 ). In patients not on lipid-lowering therapy (VAP: n = 155, AtherOx: n = 95), FOS was associated with significantly lower VLDL-C, IDL-C, remnant lipoproteins (defined as the sum of small VLDL [VLDL 3 -C and IDL-C]), triglycerides, AtherOx, and a trend toward a less atherogenic LDL density pattern (pattern A), whereas in patients on lipid-lowering therapy (VAP: n = 365, AtherOx: n = 248), only Lp(a)-cholesterol was significantly lower in the FOS group ( Table 3 , Figure 4 ). In the NFOS population (VAP: n = 406, AtherOx: n = 265), lipid-lowering therapy was associated with a reduction in multiple measures of atherogenic lipoprotein with the exception of LDL 4 (smallest and densest and possibly most atherogenic), triglycerides, Lp(a)-cholesterol, and LDL density pattern. In the FOS population (VAP: n = 114, AtherOx: n = 78), total cholesterol, total LDL-C, LDL 1-3 -C, LDL density pattern A/B, Apo B100, and Apo B100/A1 ratio were significantly lower with lipid-lowering therapy ( Table 3 ).
| NFOS (n=406) | FOS (n=114) | p-value | |
|---|---|---|---|
| Total Cholesterol | 162 ± 40 | 160 ± 47 | 0.71 |
| Total Very Low Density Lipoprotein | 22.6 ± 12.2 | 20.0 ± 6.2 | 0.002 |
| Total Very Low Density Lipoprotein 1+2 | 9.8 ± 7.7 | 8.5 ± 3.6 | 0.008 |
| Total Very Low Density Lipoprotein 3 | 12.8 ± 5.1 | 11.6 ± 2.9 | 0.001 |
| Total Low Density Lipoprotein | 94.4 ± 32.7 | 93.9 ± 38.5 | 0.90 |
| Low Density Lipoprotein 1 | 11.9 ± 6.9 | 12.8 ± 11.2 | 0.44 |
| Low Density Lipoprotein 2 | 14.2 ± 12.9 | 17.1 ± 17.7 | 0.11 |
| Low Density Lipoprotein 3 | 32.8 ± 15.1 | 33.2 ± 15.3 | 0.77 |
| Low Density Lipoprotein 4 | 15.0 ± 9.8 | 13.9 ± 10.3 | 0.31 |
| Intermediate Density Lipoprotein | 12.0 ± 6.8 | 10.7 ± 5.0 | 0.02 |
| Total High Density Lipoprotein | 44.6 ± 12.5 | 45.9 ± 15.2 | 0.38 |
| High Density Lipoprotein 2 | 10.9 ± 5.2 | 11.4 ± 6.5 | 0.45 |
| High Density Lipoprotein 3 | 33.7 ± 8.1 | 34.5 ± 9.3 | 0.39 |
| Remnant Lipoproteins | 22.8 ± 12.9 | 21.5 ± 8.4 | 0.20 |
| Triglycerides | 129 ± 103 | 113 ± 61 | 0.04 |
| Lipoprotein (a) | 8.5 ± 6.3 | 7.6 ± 5.4 | 0.14 |
| Oxidized LDL | 39.9 ± 14.5 | 40.5 ± 14.1 | 0.75 |
| Apolipoprotein B100 | 83.3 ± 21.4 | 81.6 ± 24.3 | 0.46 |
| Apolipoprotein A1 | 136 ± 21 | 136 ± 25 | 0.84 |
| Apolipoprotein B100/A1 ratio | 0.63 ± 0.17 | 0.61 ± 0.21 | 0.45 |
| LDL Density Pattern A | 42.7% | 46.5% | 0.45 |
| LDL Density Pattern A/B | 12.7% | 14.0% | 0.15 |
| LDL Density Pattern B | 44.6% | 39.5% | 0.46 |

| No Lipid-Lowering Therapy | Lipid-Lowering Therapy | |||||
|---|---|---|---|---|---|---|
| NFOS (n=120) | FOS (n=35) | p-value | NFOS (n=286) | FOS (n=79) | p-value | |
| Total cholesterol | 187 ± 42 | 185 ± 36 | 0.77 | 151 ± 35** | 149 ± 47 + | 0.72 |
| Total very low density lipoprotein | 25.6 ± 14.4 | 19.9 ± 5.6 | 0.0005 | 21.4 ± 11.0* | 20.0 ± 6.5 | 0.17 |
| Total Very Low Density Lipoprotein 1+2 | 11.3 ± 8.5 | 8.4 ± 3.0 | 0.002 | 9.2 ± 7.3* | 8.5 ± 3.8 | 0.22 |
| Total Very Low Density Lipoprotein 3 | 14.3 ± 2.3 | 11.5 ± 3.0 | 0.0005 | 12.2 ± 4.4* | 11.6 ± 2.9 | 0.17 |
| Total low density lipoprotein | 115 ± 35 | 115 ± 32 | 0.92 | 86 ± 27** | 85 ± 38 ++ | 0.83 |
| Low Density Lipoprotein 1 | 16.2 ± 8.0 | 15.3 ± 7.3 | 0.55 | 10.1 ± 5.6** | 11.6 ± 12.4 + | 0.30 |
| Low Density Lipoprotein 2 | 21.2 ± 17.3 | 24.3 ± 14.6 | 0.35 | 11.4 ± 9.1** | 13.9 ± 18.1 + | 0.23 |
| Low Density Lipoprotein 3 | 39.7 ± 16.9 | 41.6 ± 13.9 | 0.54 | 29.9 ± 13.2** | 29.5 ± 14.5 ++ | 0.83 |
| Low Density Lipoprotein 4 | 15.3 ± 10.4 | 13.9 ± 12.0 | 0.50 | 14.8 ± 9.6 | 13.9 ± 9.5 | 0.43 |
| Intermediate density lipoprotein | 15.1 ± 8.2 | 11.7 ± 4.9 | 0.003 | 10.7 ± 5.7** | 10.3 ± 5.0 | 0.52 |
| Total High Density Lipoprotein | 45.9 ± 12.9 | 49.9 ± 16.2 | 0.14 | 44.0 ± 12.3 | 44.2 ± 14.6 | 0.92 |
| High Density Lipoprotein 2 | 11.1 ± 5.5 | 13.1 ± 6.9 | 0.08 | 10.9 ± 5.1 | 10.7 ± 6.3 | 0.81 |
| High Density Lipoprotein 3 | 34.9 ± 8.0 | 36.7 ± 6.9 | 0.08 | 33.3 ± 8.1 | 33.5 ± 8.8 | 0.81 |
| Remnant lipoproteins | 27.0 ± 15.5 | 22.6 ± 8.4 | 0.03 | 21.1 ± 11.2** | 21.1 ± 8.4 | 0.99 |
| Triglycerides | 136 ± 105 | 102 ± 48 | 0.009 | 126 ± 103 | 118 ± 66 | 0.40 |
| Lipoprotein (a) | 7.8 ± 5.8 | 8.1 ± 5.0 | 0.73 | 8.9 ± 6.5 | 7.3 ± 5.6 | 0.05 |
| LDL Density Pattern A | 48.3 | 57.1 | 0.20 | 40.5 | 41.8 | 0.33 |
| LDL Density Pattern A/B | 10.2 | 17.1 | 0.007 | 13.4 | 12.7 + | 0.08 |
| LDL Density Pattern B | 41.5 | 25.7 | 0.15 | 46.1 | 45.6 | 0.35 |
| Oxidized LDL | 43.9 ± 15.7 | 44.3 ± 14.5 | 0.90 | 38.6 ± 13.9* | 38.7 ± 13.7 | 0.97 |
| Apolipoprotein B100 | 95.9 ± 23.8 | 92.4 ± 20.8 | 0.43 | 78.1 ± 18.4** | 76.7 ± 24.3 + | 0.66 |
| Apolipoprotein A1 | 140 ± 21 | 141 ± 27 | 0.88 | 134 ± 21* | 134 ± 24 | 0.94 |
| Apolipoprotein B100/A1 ratio | 0.70 ± 0.19 | 0.68 ± 0.23 | 0.61 | 0.60 ± 0.16** | 0.58 ± 0.19 + | 0.62 |
Stay updated, free articles. Join our Telegram channel

Full access? Get Clinical Tree


