Previous studies have shown that oxidative stress and endothelial dysfunction are related to impaired myocardial microcirculation after reperfusion. Moreover, elevated myeloperoxidase (MPO) levels are associated with endothelial dysfunction. Plasma MPO levels were measured in patients with ST-segment elevation acute myocardial infarction (n = 160) who had undergone percutaneous coronary stenting within 12 hours of symptom onset. We investigated whether the plasma MPO level at admission was associated with impaired myocardial microcirculation, as indicated by ST-segment resolution and myocardial blush grade after reperfusion, and left ventricular ejection fraction and remodeling at 6 months. The patients were divided into 2 groups according to the median MPO value for the entire cohort (low-MPO group ≤50 ng/ml, n = 80; high-MPO group >50 ng/ml, n = 80). ST-segment resolution and the myocardial blush grade were significantly lower in the high-MPO than in the low-MPO group (48 ± 27% vs 61 ± 24%, p <0.005; and 2.1 ± 0.8 vs 2.4 ± 0.7, p <0.01; respectively). Moreover, the percentage of increase in the left ventricular end-diastolic volume index was significantly greater and the left ventricular ejection fraction at 6 months was significantly lower in the high-MPO group than in the low-MPO group (8.2 ± 24.7% vs −1.9 ± 23.5%, p <0.05; and 46 ± 9% vs 54 ± 9%, p <0.0001, respectively). Multiple regression analysis showed that the plasma MPO level was an independent predictor of incomplete ST-segment resolution (odds ratio 6.94, 95% confidence interval 2.10 to 22.9, p = 0.0015). In conclusion, elevated plasma MPO levels at admission were associated with impaired myocardial microcirculation after reperfusion in patients with acute myocardial infarction.
Myeloperoxidase (MPO) has emerged as a potential participant in the promotion of atherosclerosis. MPO, a member of the heme peroxidase superfamily, generates reactive oxygen species and diffusible radical species. This enzyme has been implicated in the oxidation of lipids contained within low-density lipoprotein, the promotion of lipid-rich plaque formation, and activation of protease cascades that affect plaque stability and thrombogenicity. MPO might also catalytically consume endothelium-derived nitric oxide (NO) and impair its vasodilatory and anti-inflammatory function, leading to vasoconstriction. Moreover, a recent study has shown that plasma concentrations of MPO predict mortality after acute myocardial infarction (AMI). Therefore, we hypothesized that high MPO levels might alter the function of the endothelium, impair coronary microcirculation, and cause left ventricular remodeling after reperfusion in AMI. The aim of the present study was to determine whether the plasma MPO levels at admission are associated with impaired myocardial microcirculation, as indicated by ST-segment resolution (STR) and myocardial blush grade, and with left ventricular function after reperfusion in patients with AMI.
Methods
The study included 240 consecutive patients with AMI who had undergone primary coronary stenting from July 2002 to June 2006. The inclusion criteria were symptoms consistent with AMI lasting >30 minutes, arrival at our hospital within 12 hours of the onset of chest pain, ST-segment elevation >2 mm in ≥2 contiguous precordial leads, and successful angioplasty, with no additional >50% stenosis of the infarct-related artery. Successful angioplasty was defined as correct stent deployment, stable Thrombolysis In Myocardial Infarction 3 flow, and <30% residual stenosis at the occlusion site. Patients were not eligible if they had ≥50% left main coronary artery stenosis, hemodynamic instability requiring the use of an intra-aortic balloon pump, or sustained arrhythmia. We also excluded patients with electrocardiographic abnormalities that could interfere with ST-segment analysis (left bundle branch block, pacemaker), variant angina, previous coronary bypass surgery, severe heart failure treated with intra-aortic balloon pump, severe valvular heart disease, and malignant tumor. We excluded 12 patients who arrived at the hospital >12 hours from the onset of chest pain, 27 patients with non–ST-segment elevation AMI, and 14 patients with cardiogenic shock attributable to multivessel or left main disease. We also excluded 19 patients with distal embolization demonstrated on angiography by slow flow or no-reflow phenomenon after percutaneous coronary intervention. In addition, we excluded 4 patients with left bundle branch block and 4 patients with malignancy. Thus, a total of 160 patients (124 men and 36 women, mean ± SD age 64 ± 11 years) were enrolled in the present study. All patients were taking aspirin (81 mg) and had received 200 mg of ticlopidine before and after the procedure, the standard regimen in Japan. After stent implantation, most of the patients received β blockers, statins, or other adjuvant medications at the treating physician’s discretion. Glycoprotein IIb/IIIa inhibitors and clopidogrel were not used, because they had not been approved in Japan at that time. At 6 months after the onset of AMI, 138 patients underwent follow-up angiography. All patients provided written informed consent, and the hospital ethics committee approved the study.
The infarct-related artery was defined as a major coronary artery perfusing an area compatible with the distribution of ST-segment elevation on a 12-lead electrocardiogram. The patency of the infarct-related artery was angiographically assessed before percutaneous coronary intervention according to the Thrombolysis In Myocardial Infarction flow grade by 2 independent observers who were unaware of the study design. Subsequent percutaneous coronary intervention was performed for total occlusive lesions or lesions with >75% diameter stenosis, even with Thrombolysis In Myocardial Infarction grade 3 flow. All percutaneous coronary intervention procedures were performed using a femoral approach with a 7Fr-guiding catheter. After administration of 5,000 IU of heparin and conventional wire crossing, predilation with a balloon (n = 12) or thrombectomy (n = 5), or both (n = 103), before stenting or direct stent implantation (n = 40) was performed. All stents used were bare metal stents. All preprocedure, postprocedure, and follow-up angiographic procedures were conducted immediately after the administration of 0.25 mg of intracoronary nitroglycerin. Follow-up angiography was performed with guiding catheters of ≥5Fr in diameter. Angiography was performed such that each lesion could be viewed from ≥2 angles. Off-line quantitative coronary angiography was conducted using the view revealing the greatest degree of stenosis. Calculations were performed using the cardiovascular measurement system (CMS-MEDIS Medical Imaging System, Leiden, The Netherlands) by one investigator who was unaware of the study design. Angiographic restenosis was defined as >50% diameter stenosis on the follow-up angiogram. Left ventriculography was performed on admission and at 6 months after AMI, and the left ventricular end-diastolic volume index (LVEDVI) and left ventricular ejection fraction were calculated.
Venous blood samples from all patients were obtained on admission to the hospital, before heparin administration. The following parameters were measured: serum total cholesterol, serum high-density lipoprotein cholesterol, serum low-density lipoprotein cholesterol, and serum high-sensitive C-reactive protein levels, leukocyte count, neutrophil count, plasma N-terminal pro-brain natriuretic peptide levels, and plasma MPO levels. The concentration of high-sensitive C-reactive protein was measured using the latex agglutination photometric immunoassay with an automated immunochemistry analyzer (LXz-6000, Eiken Chemical, Tokyo, Japan) with normal values <0.3 mg/dl. The plasma N-terminal pro-brain natriuretic peptide levels were measured using an enzyme-linked immunosorbent assay method using the Elecsys N-terminal pro-brain natriuretic peptide sandwich immunoassay (Roche Diagnostics, Belleville, New Jersey), as previously reported. The plasma MPO levels were measured using an enzyme-linked immunosorbent assay method (Oxis International, Beverly Hills, California) according to procedures previously reported. In addition, the plasma MPO levels were measured in 168 patients with stable angina pectoris and 65 normal subjects. Stable angina pectoris was defined as chest pain typical of cardiac ischemia on exertion. All patients had undergone coronary angiography and had angiographically documented narrowing of ≥70% of the luminal diameter of a major coronary artery. The normal subjects were 65 age- and gender-matched healthy volunteer blood donors (43 men and 22 women; mean ± SD age 64 ± 9 years).
A 12-lead electrocardiogram was recorded on admission and at 60 minutes after the final coronary angiography. The sum of the ST-segment elevation at 20 ms from the J-point was calculated using leads V 1 to V 6 , I, and aVL for anterior myocardial infarction. For inferior myocardial infarction, ST-segment elevation was summed in leads II, III, aVF, V 5 , and V 6 . STR was calculated as the change in the sum of the ST-segment elevation from the first to the second electrocardiogram and was expressed as a percentage of the ST-segment elevation on the first electrocardiogram. Two cutoff points of STR (70% and 30%) were applied, and these cutoffs defined 3 groups of STR: complete (≥70%), partial (30% to <70%), and none (<30%). The electrocardiographic measurements were performed by a single operator who was unaware of the patient data. The myocardial blush grade was assessed as previously reported and ranged from grade 0, no myocardial blush, to grade 3, normal myocardial blush.
The results are expressed as the mean ± SD. The high-sensitive C-reactive protein, N-terminal pro-brain natriuretic peptide, and MPO levels did not follow a normal distribution; therefore, a log transformation was performed to normalize the distribution, and the transformed variables were used for the statistical analyses. When 2 groups were compared, the Mann-Whitney U test was used in all circumstances. Statistical comparisons among >3 groups were performed using 1-way analysis of variance, and post hoc multiple comparisons using Schaffer’s test. Categorical variables were compared using the chi-square test. Pearson correlation coefficients were calculated to assess the relation between the log-transformed MPO levels and STR or the percentage of increase in LVEDVI. Multiple regression analysis was performed for various parameters that might affect myocardial microcirculation. Receiver operating characteristic analysis was also performed on MPO levels, neutrophil counts, and high-sensitive C-reactive protein levels for the detection of incomplete STR (<70%). Values of p <0.05 were considered significant.
Results
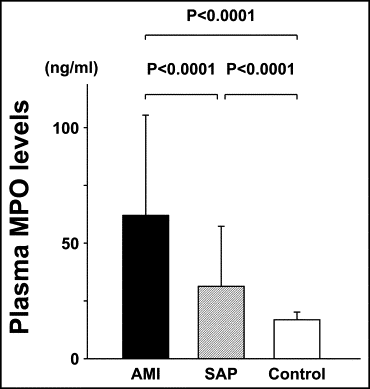
The baseline patient characteristics among those with AMI, those with stable angina pectoris, and the control subjects are listed in Table 1 . The mean plasma MPO level in the patients with AMI was 62.6 ± 43.7 ng/ml, significantly greater than that in those with stable angina pectoris (31.6 ± 26.1 ng/ml, p <0.0001) or the control subjects (17.0 ± 3.4 ng/ml, p <0.0001; Figure 1 ).
| Variable | AMI Group (n = 160) | Stable Angina Pectoris Group (n = 168) | Control Group (n = 65) |
|---|---|---|---|
| Age (years) | 64 ± 11 | 65 ± 8 | 64 ± 9 |
| Men | 124 (78%) | 123 (73%) | 43 (66%) |
| Hypertension ⁎ | 87 (54%) | 106 (63%) | 15 (23%) |
| Hypercholesterolemia † | 70 (44%) | 85 (51%) | 0 (0%) |
| Diabetes mellitus | 55 (34%) | 69 (41%) | 0 (0%) |
| Smoker | 91 (57%) | 105 (63%) | 20 (31%) |
| Multivessel coronary disease | 63 (39%) | 74 (44%) |
⁎ Systolic blood pressure ≥140 mm Hg or diastolic blood pressure ≥90 mm Hg, as defined by World Health Organization/International Society of Hypertension 1999 guidelines or concurrent treatment with antihypertensive medication.
† Total cholesterol ≥220 mg/dl or low-density lipoprotein cholesterol ≥140 mg/dl, as defined by Japan Atherosclerotic Society 2002 guidelines, or concurrent treatment with cholesterol-lowering medication.

Of the 160 patients with AMI, 2 died in the hospital from pneumonia and acute renal failure; all other patients were discharged without recurrent myocardial infarction or coronary artery bypass surgery. In 20 patients, coronary angiography was performed within 6 months, in 14 because of symptoms of unstable angina and in 6 because of heart failure. Angiographic follow-up at 6 months was accomplished in 138 patients (86%). Restenosis had occurred in 45 (33%) of the 138 patients with AMI.
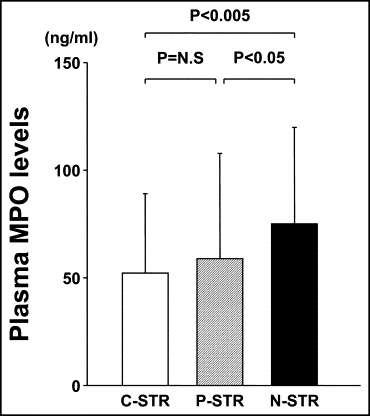
Complete STR (≥70%) was present in 62 patients (39%), partial resolution (30% to <70%) in 58 patients (36%), and no resolution (<30%) in 40 patients (25%). As shown in Figure 2 , the plasma MPO levels on admission in the no-STR group were significantly greater than those in the complete-STR group or partial-STR group (complete-STR group, 52 ± 37 ng/ml; partial-STR group, 59 ± 49 ng/ml; no-STR group, 73 ± 45 ng/ml; complete-STR vs no-STR, p <0.005; partial-STR vs no-STR, p <0.05).

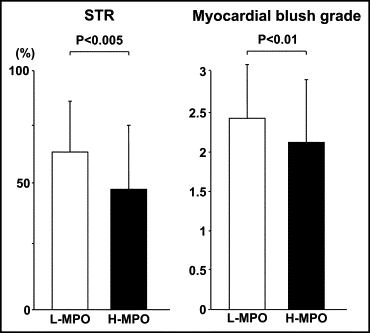
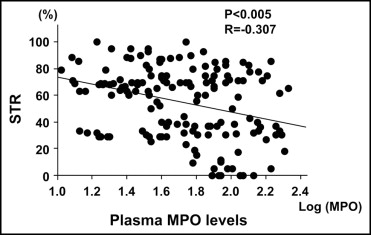
The patients with AMI were divided into 2 groups according to the median MPO value for the entire cohort of patients (low-MPO group ≤50 ng/ml, n = 80; high-MPO group >50 ng/ml, n = 80). No significant differences were found between the 2 groups in the baseline patient characteristics ( Table 2 ), angiographic findings, or acute procedural results ( Table 3 ). Figure 3 shows that the myocardial microcirculation after reperfusion as evaluated by STR and myocardial blush grade were severely impaired in the high-MPO group compared to that in the low-MPO group (48 ± 27% vs 61 ± 24%, p <0.005; and 2.1 ± 0.8 vs 2.4 ± 0.7, p <0.01; respectively). In addition, the plasma MPO levels showed a negative correlation with STR (r = −0.307, p <0.005; Figure 4 ). Figure 5 shows the receiver operating characteristic curves of MPO, neutrophils, and high-sensitive C-reactive protein for the detection of incomplete STR. The area under the curve was 0.64 (95% confidence interval [CI] 0.55 to 0.73) for MPO, 0.58 (95% CI 0.49 to 0.67) for high-sensitive C-reactive protein, and 0.51 (95% CI 0.41 to 0.59) for neutrophils.
| Variable | Low MPO (n = 80) | High MPO (n = 80) | p Value |
|---|---|---|---|
| Age (years) | 65 ± 11 | 64 ± 11 | 0.88 |
| Men | 60 (75%) | 64 (80%) | 0.59 |
| Hypertension ⁎ | 45 (56%) | 42 (53%) | 0.68 |
| Hypercholesterolemia † | 34 (43%) | 36 (45%) | 0.78 |
| Diabetes mellitus | 28 (35%) | 27 (34%) | 0.89 |
| Smoker | 45 (56%) | 46 (58%) | 0.89 |
| Total cholesterol (mg/dl) | 199 ± 50 | 206 ± 50 | 0.43 |
| High-density lipoprotein cholesterol (mg/dl) | 49 ± 13 | 47 ± 13 | 0.58 |
| Low-density lipoprotein cholesterol (mg/dl) | 134 ± 49 | 147 ± 50 | 0.40 |
| Old myocardial infarction | 7 (9%) | 9 (11%) | 0.78 |
| Previous angina pectoris | 25 (31%) | 17 (21%) | 0.27 |
| Sum of ST-segment elevation (mm) | 12.1 ± 10.3 | 13.8 ± 11.7 | 0.30 |
| Elevated troponin T >0.1 ng/ml | 35 (44%) | 43 (54%) | 0.27 |
| Maximum creatine phosphokinase (U/L) | 3,302 ± 2,739 | 4,397 ± 3,721 | 0.08 |
| Killip class ≥2 | 12 (15%) | 15 (19%) | 0.68 |
| Reperfusion time (min) | 280 ± 172 | 248 ± 173 | 0.18 |
| Medications on admission | |||
| Antiplatelets | 14 (18%) | 10 (13%) | 0.59 |
| Angiotensin-converting enzyme inhibitors/angiotensin II type 1 receptor blockers | 13 (16%) | 14 (18%) | 0.89 |
| β Blockers | 4 (5%) | 5 (6%) | 0.89 |
| Lipid-lowering agents | 10 (13%) | 6 (8%) | 0.59 |
| Calcium antagonists | 20 (25%) | 26 (32%) | 0.41 |
| Nitrates | 10 (13%) | 5 (6%) | 0.49 |
| Leukocyte count ( / mm 3 ) | 10,781 ± 4,248 | 10,879 ± 3,981 | 0.65 |
| Neutrophil count ( / mm 3 ) | 7,923 ± 3,763 | 8,548 ± 3,914 | 0.41 |
| High-sensitive C-reactive protein (mg/dl) | 0.60 ± 1.46 | 0.62 ± 1.32 | 0.85 |
| N-terminal pro-brain natriuretic peptide (pg/ml) | 912 ± 2,343 | 1,178 ± 3,091 | 0.53 |
⁎ Systolic blood pressure ≥140 mm Hg or diastolic blood pressure ≥90 mm Hg, as defined by World Health Organization/International Society of Hypertension 1999 guidelines or concurrent treatment with antihypertensive medication.
† Total cholesterol ≥220 mg/dl or low-density lipoprotein cholesterol ≥140 mg/dl, as defined by Japan Atherosclerotic Society 2002 guidelines, or concurrent treatment with cholesterol-lowering medication.
| Variable | Low MPO (n = 80) | High MPO (n = 80) | p Value |
|---|---|---|---|
| Infarct-related coronary artery | 0.36 | ||
| Left anterior descending | 43 (54%) | 34 (43%) | |
| Right coronary | 29 (36%) | 41 (51%) | |
| Left circumflex | 8 (10%) | 5 (6%) | |
| Initial Thrombolysis In Myocardial Infarction flow | 0.19 | ||
| 0 | 43 (54%) | 53 (66%) | |
| 1 | 6 (8%) | 5 (6%) | |
| 2 | 18 (22%) | 11 (14%) | |
| 3 | 13 (16%) | 11 (14%) | |
| Multivessel coronary disease | 32 (40%) | 31 (39%) | 0.89 |
| Rentrop collateral grade ≥2 | 12 (15%) | 10 (13%) | 0.78 |
| Thrombolysis | 7 (9%) | 8 (10%) | 0.89 |
| Thrombectomy | 50 (63%) | 58 (73%) | 0.27 |
| No. of stents per lesion | 1.16 ± 0.37 | 1.18 ± 0.44 | 0.93 |
| Stent size (mm) | 3.31 ± 0.43 | 3.42 ± 0.40 | 0.16 |
| Stent length (mm) | 18.6 ± 7.6 | 20.6 ± 8.2 | 0.13 |
| Quantitative coronary angiography analysis (baseline) | |||
| Reference diameter (mm) | 3.15 ± 0.62 | 3.17 ± 0.57 | 0.71 |
| Minimal lumen diameter (mm) | 0.19 ± 0.29 | 0.13 ± 0.23 | 0.51 |
| Diameter stenosis (%) | 94.2 ± 9.2 | 95.6 ± 7.2 | 0.56 |
| Quantitative coronary angiography analysis (after stenting) | |||
| Minimal lumen diameter (mm) | 2.74 ± 0.53 | 2.84 ± 0.53 | 0.30 |
| Acute gain (mm) | 2.55 ± 0.57 | 2.71 ± 0.56 | 0.10 |
| Diameter stenosis (%) | 12.7 ± 13.4 | 10.1 ± 8.8 | 0.46 |


