Epicardial and myocardial fats increase with degree of visceral adiposity and possibly contribute to obesity-associated cardiac changes. Echocardiographic epicardial fat thickness is a new and independent marker of visceral adiposity. The aim of this study was to test whether echocardiographic epicardial fat is related to myocardial fat. Twenty consecutive Caucasian men (body mass index 30.5 ± 2 kg/m 2 , 42 ± 7 years of age) underwent transthoracic echocardiography for epicardial fat thickness, morphologic and diastolic parameter measurements, hydrogen-1 magnetic resonance spectroscopy for myocardial fat quantification, and magnetic resonance imaging for epicardial fat volume estimation. Hydrogen-1 magnetic resonance spectroscopic myocardial fat content, magnetic resonance imaging of epicardial fat volume, and echocardiographic epicardial fat thickness range varied from 0.5% to 31%, 4.5 to 43 ml, and 3 to 15 mm, respectively. Myocardial fat content showed a statistically significant correlation with echocardiographic epicardial fat thickness (r = 0.79, p <0.01), waist circumference (r = 0.64, p <0.01), low-density lipoprotein cholesterol (r = 0.54, p <0.01), plasma adiponectin levels (r = −0.49, p <0.01), and isovolumic relaxation time (r = 0.59, p <0.01). However, multivariate linear regression analysis showed epicardial fat thickness as the most significant independent correlate of myocardial fat (p <0.001). Although this study is purely correlative and no causative conclusions can be drawn, it can be postulated that increased echocardiographic epicardial fat accumulation could reflect myocardial fat in subjects with a wide range of adiposity.
Epicardial fat can be easily visualized and measured with standard 2-dimensional echocardiography, as we first proposed. Echocardiographic epicardial fat thickness clearly and independently reflects visceral adiposity, as previously reported. However, whether echocardiographic epicardial fat really correlates with myocardial fat content is still unexplored. In this study we sought to test the hypothesis that echocardiographic epicardial fat thickness is related to myocardial fat.
Methods
Twenty consecutive Caucasian men (mean body mass index 30.5 ± 2 kg/m 2 , range 25 to 36, mean age 42 ± 7 years) who were referred to our department for cardiometabolic risk assessment were recruited for transthoracic 2-dimensional guided M-mode echocardiography, hydrogen-1 ( 1 H) magnetic resonance (MR) spectroscopy, cardiovascular MR imaging, and anthropometric and blood measurements. Patients with signs, symptoms, or clinical history of coronary artery disease, heart failure, diabetes mellitus, hypertension, family dyslipidemia, myocardial, pericardial or valve diseases, pulmonary or liver diseases, neoplasias, drug abuse, or human immunodeficiency viral infection were excluded. None of the study patients was taking medications. This study was conducted in accordance with guidelines proposed in the Declaration of Helsinki and all subjects gave their informed consent.
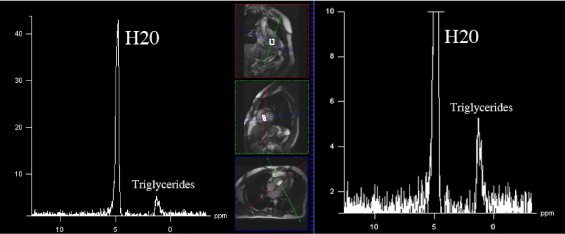
Hydrogen-1 MR spectroscopy was used to determine myocardial fat content, as previously reported. All examinations were performed using a 1.5-T system (Magnetom Sonata, Siemens Medical Systems, Erlangen, Germany) by 2 experienced radiologists (FS, FS) and a physicist (GDL). Subjects remained positioned in the MR unit during the entire examination, with no interval between consecutive measurements. A dedicated 4-element phased-array cardiac coil was used. Images were acquired during repeated end-expiratory breath-holds. Electrocardiographically gated cine true fast imaging with steady-state precession sequences were acquired (bright blood, repetition/echocardiographic times 45/1.5 ms, slice thickness 7 mm, flip angle 65°, 1 excitation; no interslice gap) along the 4-chamber axis for 6 t -9 slices to cover the entire cardiac volume. We placed a rectangular region of interest of ≥10 × 20 × 40 mm into the interventricular septum, accurately adapting size and orientation of this voxel to avoid blood contamination. After semiautomatic shimming, an electrocardiographically gated single-voxel point-resolved spectroscopic sequence was acquired (repetition/echocardiographic times 1,500/90 ms, 1,024 points) with (number of excitations 200) and without (number of excitations 32) water suppression. Analysis of all spectra was performed with the validated fitting algorithm Advanced Method for Accurate, Robust and Efficient Spectral (AMARES). Postprocessing included 0 filling (obtaining 2,048 points), apodization (2 Hz), and automatic or manual phasing. Goodness of fit was assessed by checking the residual spectrum. We summed peak integral of lipid resonances at 0.9 and 1.3 ppm. The water signal at 4.7 ppm was used an internal reference, providing relative fat quantification ( Figure 1 ).
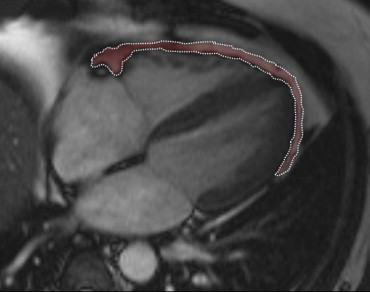
Epicardial fat volume was measured using Argus VA50A (Leonardo, Siemens Medical Systems) on a remote workstation. Epicardial fat was measured as the fat depot between the outer layer of the myocardium and the visceral layer of the pericardium ( Figure 2 ). A radiologist manually segmented cine true fast imaging with steady-state precession images of the end-systolic cardiac cycle. The area corresponding to the epicardial fat of each slice was multiplied by slice thickness and then added each other to obtain the total volume.
Each subject underwent transthoracic 2-dimensional guided M-mode echocardiography using commercially available equipment (Vingmed-System Five, General Electric, Milwaukee, Wisconsin). Standard parasternal and apical views were obtained in the left lateral decubitus position. All echocardiograms were recorded and analyzed off-line for epicardial fat thickness quantification, according to the method that we previously described and validated. Epicardial fat thickness was measured by 2 readers (GI, CC) on 2 different days and with no knowledge of previous readings. Epicardial fat was identified as echocardiographic-free space between the outer wall of the myocardium and the visceral layer of the pericardium. Epicardial fat thickness was measured perpendicularly on the free wall of the right ventricle at end-systole in 3 cardiac cycles. Parasternal long- and short-axis views allowed the most accurate measurement of epicardial adipose tissue in the right ventricle, with optimal cursor beam orientation in each view. Maximum epicardial fat thickness was measured at the point on the free wall of the right ventricle along the midline of the ultrasound beam, perpendicular to the aortic annulus, and used as an anatomic landmark for this view. For midventricular parasternal short-axis assessment, maximum epicardial fat thickness was measured on the right ventricular free wall along the midline of the ultrasound beam, perpendicular to the ventricular septum at the midchorda and tip of the papillary muscle level, as an anatomic landmark. The average value of 3 cardiac cycles from each echocardiographic view was considered. Concordance of long- and short-axis average epicardial fat thickness measurements was excellent. Inter- and intraobserver variabilities of epicardial fat thickness were not statistically significant. Intra- and interobserver reproducibilities of this measurement were excellent (intraclass correlation coefficient 0.90 and 0.87, respectively) as was agreement.
Left ventricular (LV) mass was estimated and adjusted by body surface area (indexed LV mass), as previously described. Right ventricular end-diastolic diameter and the left atrium were measured according to American Society of Echocardiography recommendations. LV diastolic function was evaluated using pulse-wave color Doppler echocardiography. E-wave deceleration time was calculated in 3 to 5 consecutive cardiac cycles. Isovolumic relaxation time (IVRT) was measured between the end of transaortic systolic flow and the beginning of the E wave. Body mass index and waist circumference were measured as previously described. Blood samples were drawn after overnight fasting and plasma was stored at −20°C for subsequent assay. High-sensitive serum C-reactive protein was assayed by immunoturbidimetric assay. Plasma adiponectin concentration was evaluated by an enzyme-linked immunosorbent assay (Human Adiponectin/Acrp30 Quantikine enzyme-linked immunosorbent assay kit, no. DRP300, R&D Systems, Minneapolis, Minnesota). Total cholesterol, high-density lipoprotein cholesterol, triglyceride, glucose, and insulin concentrations and alanine aminotransferase and aspartate aminotransferase activities were measured by standard methods.
Data are presented as mean ± SD or median and range for skewed parameters. 1 H-MR spectroscopic myocardial fat content was expressed as a percentage compared to water content. Intra- and interobserver variabilities of epicardial fat thickness were evaluated using paired t tests. Reproducibility of echocardiographic epicardial fat thickness measurement was evaluated by intraclass correlation coefficient, with values >0.8 considered excellent. Bland-Altman test and linear regression analysis were used to assess the agreement between MR imaging of epicardial fat volume and echocardiographic epicardial fat thickness. Univariate linear regression analysis was used to establish correlates of echocardiographic epicardial fat and 1 H-MR spectroscopic myocardial fat content. Multivariate linear regression analysis was used to assess independent correlates of 1 H-MR spectroscopic myocardial fat content. Variables that were significantly correlated to 1 H-MR spectroscopic myocardial fat in univariate analysis were entered in the multivariable regression model as independent variables. To avoid possible multicollinearity among independent predictors of myocardial fat, 4 different multivariable regression models were performed and independent variables were entered separately with epicardial fat thickness. A p value <0.05 was considered statistically significant.
Results
Subjects’ clinical characteristics are presented in Table 1 . Cardiac imaging parameters are presented in Table 2 . 1 H-MR spectroscopic myocardial fat content, MR imaging of epicardial fat volume, and echocardiographic epicardial fat thickness were from 0.5% to 31%, 4.5 to 43 ml, and 3 to 15 mm, respectively. Intra- and interobserver reproducibilities of epicardial fat thickness were excellent (intraclass correlation coefficient 0.90 and 0.87, respectively). Correlation between epicardial fat thickness, measured by echocardiography, and epicardial fat volume, assessed by MR imaging, was excellent (r = 0.90, p <0.01). Bland-Altman test confirmed the agreement between MR imaging of epicardial fat volume and echocardiographic epicardial fat thickness ( Figure 3 ). Echocardiographic epicardial fat thickness significantly correlated with waist circumference (r = 0.87, p <0.01), LV mass (r = 0.87, p <0.01), plasma adiponectin levels (r = 0.82, p <0.01), IVRT (r = 0.71, p <0.01), right ventricular end-diastolic diameter (r = 0.70, p <0.01), body mass index (r = 0.53, p <0.01), and homeostasis model assessment for insulin resistance (r = 0.40, p <0.05). Myocardial fat content showed a statistically significant correlation with echocardiographic epicardial fat thickness (r = 0.79, p <0.01; Figure 4 ), MR imaging of epicardial fat volume (0.65, p <0.01), waist circumference (r = 0.64, p <0.01), low-density lipoprotein (r = 0.54, p <0.01), plasma adiponectin levels (r = −0.49, p <0.01), and IVRT (r = 0.59, p <0.01). No significant correlation among age, body mass index, body weight, triglycerides, total cholesterol, high-density lipoprotein, fasting glucose, fasting insulin, high-sensitive serum C-reactive protein, blood pressure, transaminases, and myocardial fat content was observed. Multivariable analysis models for 1 H-MR spectroscopic myocardial fat prediction are listed in detail in Table 3 .
| Age (years) | 42 ± 7 |
| Body mass index (kg/m 2 ) | 30.5 ± 2 |
| Waist circumference (cm) | 105 ± 8 |
| Systolic blood pressure (mm Hg) | 129 ± 5 |
| Diastolic blood pressure (mm Hg) | 79 ± 4 |
| Glucose (mg/dl) | 86 ± 8 |
| Insulin (μU/ml) | 11 ± 5 |
| Homeostasis model assessment for insulin resistance | 2.4 ± 1 |
| Total cholesterol (mg/dl) | 221 ± 30 |
| High-density lipoprotein cholesterol (mg/dl) | 44 ± 8 |
| Low-density lipoprotein cholesterol (mg/dl) | 140 ± 9 |
| Triglycerides (mg/dl) | 173 ± 60 |
| High-sensitive C-reactive protein (mg/L) | 0.3 ± 0.2 |
| Adiponectin (μg/ml) | 6.5 ± 4 |
| Alanine aminotransferase (U/I) | 31 ± 7 |
| Aspartate aminotransferase (U/I) | 23 ± 5 |
| Proton magnetic resonance spectroscopy | Myocardial fat content (%) | 5.3 ± 9 |
| Magnetic resonance imaging | Epicardial fat volume (ml) | 23 ± 11 |
| Echocardiography | Epicardial fat thickness (mm) | 7.3 ± 3 |
| Left ventricular mass (g) | 195 ± 24 | |
| Indexed left ventricular mass (g/m 2 ) | 85 ± 13 | |
| Left atrium (mm) | 38 ± 4 | |
| Right ventricular end-diastolic diameter (mm) | 22 ± 5 | |
| Isovolumic relaxation time (ms) | 101 ± 13 | |
| E-wave deceleration time (ms) | 190 ± 18 |
Stay updated, free articles. Join our Telegram channel

Full access? Get Clinical Tree


