Sixty-four-slice multidetector row computed tomography is a noninvasive method of assessing coronary artery stenosis and plaque composition. The aim of this study was to clarify the relation between plaque composition and coronary heart disease. Three hundred sixty consecutive patients and 1,085 plaques were evaluated using 64-slice multidetector row computed tomography. On axial or cross-sectional multiplanar reconstruction images, 3 regions of interest were randomly selected within each plaque. Soft plaques and calcified plaques were defined as having computed tomographic densities <50 and >130 Hounsfield units, respectively. The association between coronary risk factors and plaque composition was analyzed. The number of plaques and the mean computed tomographic density of plaques were significantly higher in men than in women (p = 0.002 and p = 0.04, respectively). Coronary plaques were more frequent in patients with stroke, diabetes, hypertension, and dyslipidemia than in patients without these conditions (all p values <0.001). Calcified plaques were more frequent in patients with hypertension (p = 0.02), and patients with calcified plaques also had significantly lower low-density lipoprotein cholesterol levels (p <0.001). Soft plaques were more frequent in patients with dyslipidemia (p <0.001). Patients with soft plaques had significantly higher low-density lipoprotein cholesterol levels (p = 0.02) and lower high-density lipoprotein cholesterol levels (p <0.001) than those without soft plaques. In conclusion, 64-slice multidetector row computed tomography is a useful noninvasive method for quantifying coronary plaques.
Sixty-four-slice multidetector row computed tomography (MDCT) allows the noninvasive assessment of coronary stenosis and occlusion. There is increasing evidence that 64-slice MDCT has high diagnostic accuracy for coronary heart disease (CHD), and CHD is associated with future coronary events and death. MDCT not only detects coronary artery obstruction but can also be used to assess plaque composition, which may have an important influence on CHD. Previous studies have shown that noncalcified, low-density plaques detected on 64-slice MDCT correspond to rupture-prone soft plaques revealed by intravascular ultrasound (IVUS). Radiographic detection of coronary artery calcium is also a marker of CHD and predicts coronary events. Calculation of the coronary calcium score has been used to evaluate age and gender differences in the extent of coronary calcification. In addition, assessment of coronary plaque morphology may be useful to improve risk stratification. Accordingly, the aim of this study was to clarify the relation between coronary plaque features and the risk for CHD.
Methods
From June 2005 to January 2008, we performed 64-slice MDCT in 360 consecutive patients (255 men and 105 women, mean age 64 ± 11 years) who were suspected to have CHD and detected 1,085 plaques in these patients. The indications for MDCT were evaluation of chest pain, shortness of breath, and abnormal or equivocal stress test findings. Some patients also had histories of revascularization with stents or coronary bypass grafting. Patient with histories of allergic reactions to contrast media or with impaired renal function (serum creatinine >1.5 mg/dl) were excluded.
A history was taken and a structured interview was done to assess the following cardiovascular risk factors: family history of CHD (defined as any member of the immediate family, first-degree relatives, who experienced a fatal or nonfatal myocardial infarction and/or underwent coronary intervention or coronary artery bypass surgery), current smoking (defined as having smoked a cigarette in the past 30 days), history of acute coronary syndromes or stroke, history of inflammatory disease, hypertension, dyslipidemia, and diabetes mellitus. Hypertension was defined as a blood pressure >140/90 mm Hg or current antihypertensive treatment. Dyslipidemia was defined as low-density lipoprotein (LDL) cholesterol ≥140 mg/dl, high-density lipoprotein (HDL) cholesterol <40 mg/dl, total cholesterol ≥220 mg/dl, triglycerides ≥150 mg/dl, or current lipid-lowering treatment. Diabetes mellitus was defined as a fasting plasma glucose level >126 mg/dl or current antidiabetic therapy. In addition, we evaluated the CHD score, which estimates the 10-year risk for CHD on the basis of the Framingham experience and assesses age, blood pressure, total cholesterol, HDL cholesterol, LDL cholesterol, diabetes mellitus, and smoking.
MDCT was performed with an Aquilion 64 scanner (Toshiba Medical, Tokyo, Japan). Patients with heart rates >68 beats/min received a β blocker (oral metoprolol 20 to 80 mg) 60 to 120 minutes before scanning. In the presence of contraindications to β blockers, the scanning was performed at greater heart rates. Sublingual nitroglycerin 0.3 mg was also administered 5 minutes before the scan. A bolus of 65 to 85 ml of contrast medium (iohexol 300 mg/ml) was injected intravenously at a rate of 3.5 to 5.0 ml/s, followed by 25 ml of saline at a rate of 2.0 ml/s. Detector collimation was 64 × 0.5 mm, table speed was 6.4 mm/rotation, tube current was 400 to 500 mA (depending on body weight), gantry rotation speed was 400 ms, helical pitch was 12.8, and tube voltage was 120 kV. Raw data were reconstructed using a half-scan algorithm in all patients, with the end of the reconstruction period being set at the peak of the P wave on the monitoring electrocardiogram. The reconstructed image data were transferred to a workstation (Ziostation; Ziosoft, Tokyo, Japan) for processing.
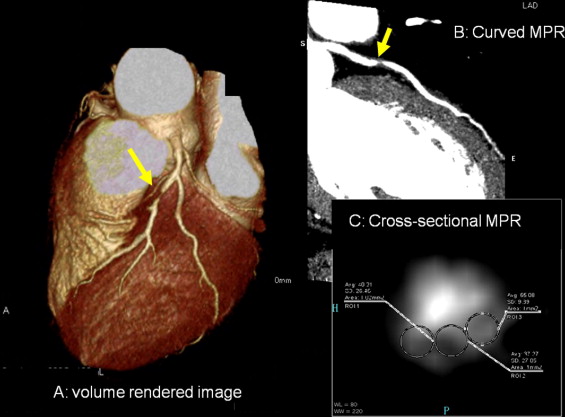
After visual inspection of volume-rendered images that depicted the coronary arteries, coronary artery plaques were viewed on axial images, curved multiplanar reconstruction images, and cross-sectional multiplanar reconstruction images. On the axial or cross-sectional multiplanar reconstruction images, 3 randomly selected regions of interest >1.0 mm 2 were placed within each plaque, and the lowest computed tomographic density was defined as the minimum plaque density. Representative multidetector computed tomographic images are shown in Figure 1 . Analysis of plaques was performed for all coronary arteries with diameters ≥2.0 mm. Each plaque was visually classified as noncalcified or calcified. If the plaque contained spotty calcification that did not affect density measurement, it was classified as noncalcified. Soft plaque was defined as having a minimum computed tomographic density < 50 Hounsfield units, while calcified plaque was defined as having a computed tomographic density >130 Hounsfield units. The multidetector computed tomographic images were evaluated by 2 experienced observers who were blinded to the clinical characteristics. For any disagreement in data analysis between the 2 observers, consensus agreement was achieved. Reproducibility of plaque composition on MDCT was assessed in a random sample of 101 plaques. Intraobserver variability was 100% for sensitivity and 97% for specificity. Interobserver variability was 89% for sensitivity and 96% for specificity. The κ values for intraobserver and interobserver agreement of plaque composition were 0.94 and 0.85, respectively.
Statistical analysis was performed using SPSS version 19.0 (SPSS, Inc., Chicago, Illinois). Continuous variables are presented as mean ± SD. Qualitative data are presented as numbers or percentages. Continuous variables were compared using analysis of variance, and categorical data were compared using chi-square tests with Fisher’s exact test. Univariate and logistic regression analyses were used to identify predictive coronary risk factors and coronary plaque morphology. The multivariate analysis model included baseline characteristics showing correlations at a significance level of p <0.10 in the univariate analysis. Odds ratios (ORs) or estimates of correlation were estimated with 95% confidence intervals (CI). A p value <0.05 was considered to indicate statistical significance.
Results
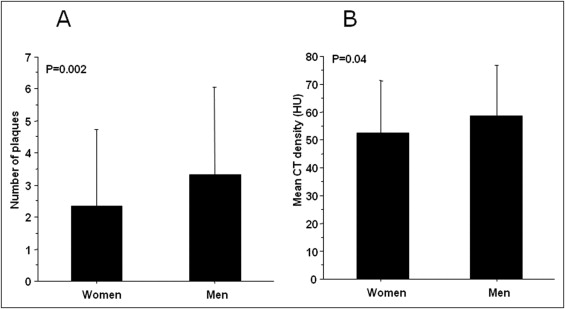
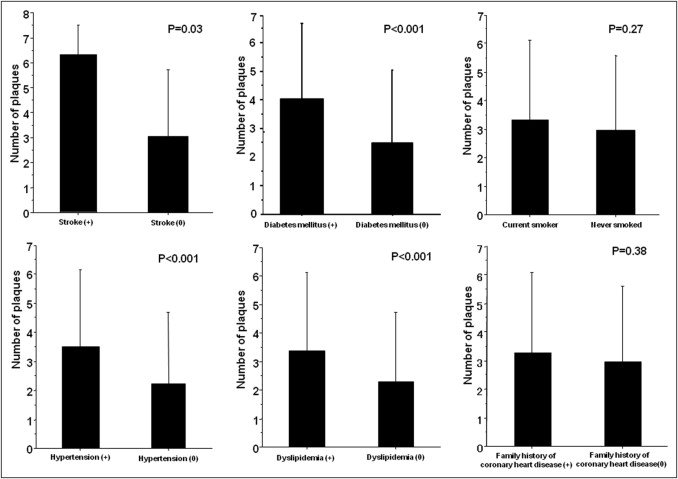
The clinical characteristics of the patients are listed in Table 1 . Most were men, the average age was 64 ± 11 years, and the mean body mass index was 24 ± 3 kg/m 2 . The average heart rate during scan was 62 ± 7 beats/min (range 45 to 89 beats/min). The average length of the examination time was 44 ± 33 minutes. The details of plaques stratified according to gender and location are listed in Table 2 . The number of plaques and their mean computed tomographic density were significantly higher in men than in women ( Figure 2 ). Next, the association between baseline coronary risk factors and the number of plaques was analyzed. Coronary plaques were also more frequent in patients with stroke (6.3 ± 1.2 vs 3.0 ± 2.7), diabetes mellitus (4.0 ± 2.7 vs 2.5 ± 2.5), hypertension (3.5 ± 2.7 vs 2.2 ± 2.5), or dyslipidemia (3.4 ± 2.7 vs 2.3 ± 2.5) than in patients without these risk factors ( Figure 3 ). However, there was no relation between the number of plaques and current smoking or a family history of CHD. In patients taking antihypertensive medications (calcium channel blockers, angiotensin-converting enzyme inhibitors, or angiotensin receptor blockers), coronary plaques were more frequent than in those not taking antihypertensive medications (all p values <0.05). In patients receiving statin therapy, coronary plaques were more frequent than in patients without statin therapy (p <0.001).
| Variable | Value |
|---|---|
| Age (years) | 64 ± 11 |
| Men | 255 (71%) |
| Body mass index (kg/m 2 ) | 24 ± 3 |
| Current smoker | 105 (31%) |
| Stroke | 3 (0.8%) |
| Family history of CHD | 69 (20%) |
| Hypertension | 214 (63%) |
| Diabetes mellitus | 104 (31%) |
| Dyslipidemia | 206 (62%) |
| Total cholesterol (mg/dl) | 206 ± 107 |
| Triglycerides (mg/dl) | 134 ± 69 |
| HDL cholesterol (mg/dl) | 55 ± 16 |
| LDL cholesterol (mg/dl) | 117 ± 32 |
| Fasting plasma glucose (mg/dl) | 111 ± 28 |
| CHD score | 8.1 ± 3 |
| Variable | Value |
|---|---|
| Number of plaques | 3.0 ± 2.6 |
| Men | 3.3 ± 2.7 |
| Women | 2.3 ± 2.4 |
| Calcified plaque | 662 (61%) |
| Multidetector computed tomographic density (Hounsfield units) | |
| Men | 58.8 ± 18.0 |
| Women | 52.5 ± 18.7 |
| Noncalcified plaque | 57.4 ± 18.2 |
| Location | |
| Left main trunk | 109 (10%) |
| Left anterior descending coronary artery | 386 (36%) |
| Left circumflex coronary artery | 210 (19%) |
| Right coronary artery | 380 (35%) |
The association between plaque morphology and coronary risk factors was also analyzed. First, the presence of plaques with or without calcification was assessed in relation to coronary risk factors. As a result, patients with calcified plaques were significantly older compared to those who did not have calcified plaques. In addition, hypertension showed a significantly higher prevalence in patients with calcified plaques than in those without such plaques. Furthermore, patients with calcified plaques had significantly lower LDL cholesterol levels than patients without calcified plaques ( Table 3 ). Second, we analyzed factors related to soft plaques. As a result, dyslipidemia was more frequent in patients with soft plaques than those without soft plaques. In addition, the patients with soft plaques had higher LDL cholesterol levels than those without soft plaques, as well as lower HDL cholesterol levels. Moreover, CHD scores were significantly higher in patients with soft plaques than in those without soft plaques ( Table 4 ). Logistic regression incorporating baseline characteristics with significance levels of p <0.10 in univariate analysis was performed to assess independent predictor of calcified plaques and soft plaques. In univariate analysis, calcified plaques were significantly associated with age (p <0.001), hypertension (p = 0.01), dyslipidemia (p = 0.07), and LDL cholesterol (p <0.001). These variables were tested in a multivariate model. The remaining significant independent predictors of calcified plaque were age (OR 1.05, 95% CI 1.02 to 1.09, p =0.005), hypertension (OR 2.0, 95% CI 1.02 to 4.02, p = 0.04), and LDL cholesterol (OR 0.98, 95% CI 0.97 to 0.99, p = 0.001). Similarly, soft plaques were significantly associated with age (p = 0.04), diabetes mellitus (p = 0.09), dyslipidemia (p <0.001), HDL cholesterol (p = 0.001), LDL cholesterol (p = 0.03), and CHD score (p = 0.007) in univariate analysis. Independent predictors of soft plaque were age (OR 1.04, 95% CI 1.00 to 1.08, p = 0.05), dyslipidemia (OR 2.7, 95% CI 1.3 to 5.6, p = 0.006), HDL cholesterol (OR 0.97, 95% CI 0.95 to 0.99, p = 0.004), and LDL cholesterol (OR 1.01, 95% CI 1.00 to 1.02, p = 0.04).
| Variable | Calcified Plaque | p Value | |
|---|---|---|---|
| Yes | No | ||
| (n = 204) | (n = 79) | ||
| Age (years) | 67 ± 9 | 60 ± 11 | <0.001 |
| Men/women | 149 (70%)/55 (77%) | 63 (30%)/16 (23%) | 0.29 |
| Body mass index (kg/m 2 ) | 24 ± 3 | 24 ± 2 | 0.87 |
| Current smoker | 52 (26%) | 18 (24%) | 0.76 |
| Stroke | 3 (1.5%) | 0 | 0.56 |
| Family history of CHD | 37 (19%) | 17 (23%) | 0.61 |
| Hypertension | 139 (73%) | 42 (57%) | 0.02 |
| Diabetes mellitus | 72 (38%) | 22 (30%) | 0.31 |
| Dyslipidemia | 127 (69%) | 42 (57%) | 0.08 |
| Total cholesterol (mg/dl) | 204 ± 136 | 210 ± 42 | 0.7 |
| Triglycerides (mg/dl) | 132 ± 62 | 147 ± 77 | 0.14 |
| HDL cholesterol (mg/dl) | 55 ± 17 | 51 ± 13 | 0.16 |
| LDL cholesterol (mg/dl) | 111 ± 29 | 129 ± 33 | <0.001 |
| Fasting plasma glucose (mg/dl) | 114 ± 31 | 110 ± 25 | 0.37 |
| CHD score | 8.4 ± 3 | 8.2 ± 3 | 0.67 |
Stay updated, free articles. Join our Telegram channel

Full access? Get Clinical Tree


