Whether conjugated bilirubin concentration, resulting from hepatic UDP-glucuronosyltransferase 1 A1 activity, is associated with cardiovascular disease is unknown. Our aim was to investigate the relation between serum conjugated bilirubin concentrations and coronary artery calcium score (CACS) as a measure of preclinical atherosclerosis. Data were analyzed from an occupational cohort of 14,583 subjects who underwent a cardiac computed tomographic estimation of CACS and measurements of risk factors. Logistic regression was used to describe associations between bilirubin concentrations and CACS. The proportion of subjects with a CACS >0 (total: men = 1,351, women = 111) decreased across increasing conjugated bilirubin quartiles (men p <0.001, women p = 0.005). After adjustment for age, gender, waist, systolic blood pressure, smoking, exercise, alcohol, homeostatic model assessment of insulin resistance, glucose, triglyceride, high- and low-density lipoprotein cholesterols, high-sensitivity C-reactive protein, lipoprotein (a), ferritin, fatty liver, cerebrovascular accident, coronary artery disease, hypertension, and diabetes, there was an inverse independent association between conjugated bilirubin and CACS >0 (odds ratio 0.76, 95% confidence interval 0.64 to 0.92, p = 0.004, for top vs bottom quartile). After further adjustment for estimated glomerular filtration rate, the odds ratio was 0.83 (95% confidence interval 0.69 to 0.99), p = 0.04. Exclusion of subjects with a high bilirubin (total >1.3 mg/dl) did not attenuate the association. In conclusion, there was a strong inverse and independent relation between conjugated bilirubin and CACS. The mechanism behind this association is not clear and may not be causal, but the effects of glucuronidation on cardiovascular disease risk should be tested.
Total bilirubin levels have been shown to be inversely correlated with the Framingham Risk score (FRS) and prevalence of metabolic syndrome, and data from the National Health and Nutrition Examination Survey 1999 to 2004 have suggested that increased serum total bilirubin levels are associated with decreased peripheral arterial disease prevalence. Increased total bilirubin concentration is also associated with a decreased incidence of stroke, and bilirubin might confer some protective function against stroke risk in men. In healthy European populations, common genetic variation of the UGT1A1 promoter region explains ≈45% to 50% of the variability in serum total and conjugated bilirubin levels, and UGT1A1 is also responsible for glucuronidation of many other small lipophilic molecules that affect the vasculature. Coronary artery calcium scoring (CACS) with cardiac computed tomography is a sensitive method to demonstrate the presence of preclinical atherosclerosis and to identify those at an increased risk of cardiovascular disease (CVD). The CACS provides a useful noninvasive tool to investigate relations between putative cardiovascular risk factors and preclinical coronary artery atherosclerosis. The aim of our study was to investigate the association between conjugated serum bilirubin concentrations and CACS (as a marker of early or preclinical atherosclerosis).
Methods
The Institutional Review Board at Kangbuk Samsung Hospital gave ethical permission for the secondary analysis of anonymized data from the cohort for this study. The population includes 14,583 participants who had a CACS assigned after coronary computed tomographic scanning. For men, the age of subjects was (mean ± SD and range) 42.0 ± 6.7 years (23 to 79) and for women, 42.9 ± 7.9 years (25 to 86). Questionnaires were used to ascertain information regarding alcohol consumption (glass/week); smoking (never, ex, or current); frequency of moderate activity each week; and history of cerebrovascular accident, coronary heart disease, hypertension (defined as systolic blood pressure of ≥140 mm Hg, diastolic blood pressure of ≥90 mm Hg, or medication for hypertension), and diabetes. Moderate activity was defined as >30-minute activity/day that induced slight breathlessness. Homeostatic model assessment of insulin resistance (HOMA-IR) index was calculated by the following equation {HOMA-IR = [fasting insulin (μIU/ml) × fasting glucose (mmol/L)]/22.5). Because there are no population-specific thresholds to indicate insulin resistance (IR) in a Korean population, we stratified the populations using the seventy-fifth percentile to establish an IR group (HOMA-IR more than or equal to seventy-fifth percentile = IR) as described previously in this population. Metabolic syndrome was defined by the 2009 joint interim statement of the International Diabetes Federation Task Force on Epidemiology and Prevention criteria with waist circumference thresholds of ≥90 and ≥80 cm that are specific for Asian populations. Abdominal ultrasonography (Logic Q700 MR; GE, Milwaukee, Wisconsin) was performed in all subjects by experienced clinical radiologists, and fatty liver was diagnosed based on known standard criteria, including hepatorenal echo contrast, liver brightness, and vascular blurring, using a 3.5-MHz probe. Total bilirubin was measured by the 2,5-dichlorophenyldiazonium method and direct bilirubin was determined using the method by Jendrassik and Grof. Bilirubin was measured by colorimetric assay (Modular Analytics P800; Roche Diagnostics, Tokyo, Japan). The reference range for conjugated bilirubin was 0.1 to 0.5 mg/dl, and for total bilirubin concentration, it was 0.3 to 1.9 mg/dl. The coefficient of variation for conjugated bilirubin was 7.1% and 9.4%, and for total bilirubin it was 2.0% and 4.9%, for intra- and interassay coefficient of variations respectively (Hitachi Modular D2400 autoanalyser; Roche, Japan). High-sensitivity C-reactive protein (CRP) was analyzed by particle-enhanced immunonephelometry with the BNII System (Dade Behring, Marburg, Germany) using a lower detection limit of 0.175 mg/L. Computed tomographic scans were performed with a 64-slice MDCT scanner (Lightspeed VCT XTe-64 slice; GE Healthcare, Milwaukee, Wisconsin) and the standard scanning protocol used was 32 × 0.625-mm section collimation, 400-ms rotation time, 120-kV tube voltage, and 31 mAs (310 mA × 0.1 second) tube current under electrocardiographic-gated dose modulation. The quantitative CACSs were calculated according to the method described by Agatston et al.
Statistical analysis of the data was performed using SPSS, version 15.0 (SPSS, Point Richmond, California). Continuous variables are expressed as mean ± SD for normally distributed variables or median (interquartile range) for other variables. Total and conjugated (or unconjugated) bilirubin was stratified into quartiles. Categorical variables were created for men and women together, HOMA-IR more than or equal to seventy-fifth percentile (as a marker of IR), CRP ≥2 mg/L, fatty liver, and 10-year FRS ≥10%. The HOMA-IR seventy-fifth percentile threshold for men was 1.84 and for women it was 1.53. The distributions of HOMA-IR for men and women were the same (for men: mean ± SD, 1.48 ± 1.07; for women: mean ± SD, 1.27 ± 1.04). Categorical variables are expressed as percentages and were compared between groups using the chi-square test. Logistic regression was used to determine the odds ratio (OR) and 95% confidence intervals (CIs) for the presence of CACS >0 and ≥20, for the highest bilirubin quartile compared with the lowest bilirubin quartile as the reference. In these regression models, the following variables were entered to investigate the independence of the relation between bilirubin in the highest quartile and CACSs: age, gender, smoking status (never, ex, or current), frequency of moderate activity each week (defined by ≥3 episodes of moderate activity of >30 min/day that induced slight breathlessness), low-density lipoprotein cholesterol, triglyceride, glucose, HOMA-IR, high-sensitivity CRP, alcohol consumption (units/day), ferritin, fatty liver, history of cerebrovascular accident, coronary heart disease, hypertension, and diabetes diagnosed by questionnaire. We adjusted for HOMA-IR as a continuous variable.
Results
In the whole cohort total, conjugated and unconjugated bilirubin concentrations were (mean ± SD) (minimums and maximums) 0.95 ± 0.40 mg/dl (0.13 to 4.47), 0.26 ± 0.11 mg/dl (0.04 to 1.32), 0.69 ± 0.31 mg/dl (0.03 to 3.84), respectively. Table 1 lists the baseline characteristics according to quartiles of conjugated bilirubin concentration. About 8.5% of subjects in the highest bilirubin quartile had a CACS >0 compared with 11.2% in the lowest quartile (p <0.0001), and a similar pattern was observed in both men (p <0.001) and women (p = 0.006), albeit only 111 of 2,552 women had a CACS >0 compared with 1,351 of 12,031 men.
| Variable | Conjugated Bilirubin (mg/dl) | p | |||
|---|---|---|---|---|---|
| 0–0.18, n = 3,834 (%) | 0.18–0.24, n = 3,863 (%) | 0.24–0.31, n = 3,442 (%) | ≥0.31, n = 3,444 (%) | ||
| CACS >0 (men) | 359/2,669 (13.5) | 375/3,181 (11.8) | 333/3,018 (11.0) | 284/3,163 (9.0) | <0.001 |
| CACS >0 (women) | 69/1,165 (5.9) | 21/682 (3.1) | 12/424 (2.8) | 9/281 (3.2) | 0.005 |
| CACS >0 (men and women) | 428 (11.2) | 396 (10.3) | 345 (10.0) | 293 (8.5) | 0.002 |
| Age (yrs) | 42.6 ± 7.3 | 42.3 ± 6.9 | 41.9 ± 6.7 | 41.6 ± 6.7 | <0.001 |
| Total bilirubin (mg/dl) | 0.58 ± 0.14 | 0.80 ± 0.13 | 1.01 ± 0.16 | 1.47 ± 0.41 | <0.001 |
| Conjugated bilirubin (mg/dl) | 0.15 ± 0.03 | 0.21 ± 0.02 | 0.28 ± 0.02 | 0.40 ± 0.09 | <0.001 |
| Unconjugated bilirubin (mg/dl) | 0.43 ± 0.12 | 0.59 ± 0.12 | 0.73 ± 0.15 | 1.07 ± 0.34 | <0.001 |
| eGFR (ml/min/1.73 m 2 body surface area) | 96.6 ± 17.0 | 93.4 ± 15.7 | 91.4 ± 14.7 | 90.7 ± 14.1 | <0.001 |
| AST (SGOT) (IU/L) | 23.3 ± 9.8 | 24.7 ± 12.1 | 25.1 ± 11.8 | 25.8 ± 21.7 | <0.001 |
| ALT (SGPT) (IU/L) | 27.1 ± 18.0 | 29.0 ± 21.3 | 29.2 ± 20.8 | 29.8 ± 42.2 | <0.001 |
| Total cholesterol (mg/dl) | 211.8 ± 37.5 | 207.2 ± 35.2 | 202.3 ± 35.4 | 193.7 ± 33.5 | <0.001 |
| Triglyceride (mg/dl) | 158.7 ± 121.5 | 146.2 ± 98.2 | 132.9 ± 79.6 | 119.2 ± 73.4 | <0.001 |
| HDL-cholesterol (mg/dl) | 51.2 ± 12.6 | 52.1 ± 12.1 | 53.3 ± 12.9 | 55.2 ± 13.2 | <0.001 |
| LDL-cholesterol (mg/dl) | 132.5 ± 33.5 | 129.0 ± 31.5 | 125.2 ± 32.5 | 117.5 ± 30.8 | <0.001 |
| Hs-CRP (mg/L) | 0.14 ± 0.31 | 0.12 ± 0.27 | 0.12 ± 0.29 | 0.11 ± 0.33 | <0.001 |
| Ferritin (ng/ml) | 151.6 ± 119.1 | 177.3 ± 121.6 | 193.2 ± 121.8 | 207.0 ± 143.1 | <0.001 |
| BMI (kg/m 2 ) | 24.7 ± 3.3 | 24.7 ± 3.14 | 24.5 ± 3.1 | 24.1 ± 2.8 | <0.001 |
| Waist (cm) | 85.1 ± 8.6 | 85.5 ± 8.3 | 85.0 ± 8.2 | 84.2 ± 8.0 | <0.001 |
| SBP (mm Hg) | 116.5 ± 12.8 | 117.3 ± 12.6 | 117.6 ± 12.0 | 118.1 ± 12.0 | <0.001 |
| DBP (mm Hg) | 74.2 ± 9.3 | 80.0 ± 9.3 | 75.1 ± 8.7 | 75.5 ± 8.9 | <0.001 |
| HOMA-IR | 1.71 ± 1.27 | 1.47 ± 0.98 | 1.36 ± 0.95 | 1.22 ± 0.95 | <0.001 |
| Alcohol consumption (glass/week) | 1.37 ± 2.45 | 1.72 ± 2.77 | 1.80 ± 2.76 | 1.89 ± 2.83 | <0.001 |
| Current smoker | 878 (22.9) | 1,053 (27.3) | 1,071 (31.1) | 1,116 (32.4) | <0.001 |
| Never smoker | 1,938 (50.5) | 1,812 (46.9) | 1,560 (45.3) | 1,613 (46.8) | <0.001 |
| Exercise ≥3/week | 654 (17.1) | 662 (17.1) | 656 (19.1) | 661 (19.2) | 0.017 |
| Previous medical Hx of cerebrovascular accident | 8 (0.2) | 11 (0.3) | 7 (0.2) | 8 (0.2) | 0.880 |
| Previous medical Hx of coronary artery disease | 28 (0.7) | 27 (0.7) | 27 (0.8) | 20 (0.6) | 0.775 |
| Previous medical Hx of hypertension | 465 (12.1) | 439 (11.4) | 399 (11.6) | 401 (11.6) | 0.765 |
| Previous medical Hx of diabetes | 152 (4.0) | 144 (3.7) | 124 (3.6) | 119 (3.5) | 0.698 |
| Metabolic syndrome | 926 (24.2) | 863 (22.4) | 641 (18.6) | 519 (15.1) | <0.001 |
| HOMA-IR 75th percentile | 1,299 (33.9) | 1,009 (26.1) | 760 (22.1) | 577 (16.8) | <0.001 |
| CRP ≥2 mg/L | 571 (14.9) | 425 (11.0) | 333 (9.7) | 278 (8.1) | <0.001 |
| Fatty liver | 1,768 (46.1) | 1,804 (46.7) | 1,447 (42.0) | 1,309 (38.0) | <0.001 |
| 10-yr FRS ≥10% | 1,027 (26.8) | 1,031 (26.7) | 823 (23.9) | 649 (18.8) | <0.001 |
We investigated the relations among total bilirubin, unconjugated bilirubin, and conjugated bilirubin and CACS >0 and traditional cardiovascular risk factors (10-year FRS ≥10%) or nontraditional cardiovascular risk factors (IR = HOMA-IR more than or equal to seventy-fifth percentile, CRP ≥2 mg/L, and fatty liver). Table 2 lists relations between these risk factors and CACS >0, according to quartiles of bilirubin concentrations. Only when bilirubin was stratified by quartiles of conjugated bilirubin, there was a decrease in the proportion of subjects with a CACS >0, with increasing bilirubin concentration.
| Variable | Total Bilirubin Quartiles (mg/dl) | p | |||
|---|---|---|---|---|---|
| <0.68, n = 3,785 (%) | 0.68–0.88, n = 3,648 (%) | 0.89–1.13, n = 3,548 (%) | >1.13, n = 3,602 (%) | ||
| HOMA-IR >75th percentile | 1,255 (33.2) | 949 (26.0) | 784 (22.1) | 657 (18.2) | <0.001 |
| CRP ≥2 mg/L | 584 (15.4) | 419 (11.5) | 321 (9.0) | 283 (7.9) | <0.001 |
| Fatty liver | 1,613 (42.6) | 1,620 (44.4) | 1,559 (43.9) | 1,536 (42.6) | 0.294 |
| 10-yr FRS ≥10% | 853 (22.5) | 930 (25.5) | 912 (25.7) | 835 (23.2) | 0.001 |
| CACS >0 | 397 (10.5) | 369 (10.1) | 349 (9.8) | 349 (9.7) | 0.654 |
| Variable | Conjugated Bilirubin Quartiles (mg/dl) | p | |||
|---|---|---|---|---|---|
| 0–0.18, n = 3,834 (%) | 0.18–0.24, n = 3,863 (%) | 0.24–0.31, n = 3,442 (%) | ≥0.31, n = 3,444 (%) | ||
| HOMA-IR >75th percentile | 1,299 (33.9) | 1,009 (26.1) | 760 (20.9) | 577 (16.8) | <0.001 |
| CRP ≥2 mg/L | 571 (14.9) | 425 (11.0) | 333 (9.7) | 278 (8.1) | <0.001 |
| Fatty liver | 1,768 (46.1) | 1,804 (46.7) | 1,447 (42.0) | 1,309 (38.0) | <0.001 |
| 10-yr FRS ≥10% | 1,027 (26.8) | 1,031 (26.7) | 823 (23.9) | 649 (18.8) | <0.001 |
| CACS >0 | 428 (11.2) | 396 (10.3) | 345 (10.0) | 293 (8.5) | 0.002 |
| Variables | Unconjugated Bilirubin Quartiles (mg/dl) | p | |||
|---|---|---|---|---|---|
| <0.49, n = 3,713 (%) | 0.49–0.64, n = 3,718 (%) | 0.65–0.82, n = 3,403 (%) | >0.82, n = 3,749 (%) | ||
| HOMA-IR >75th percentile | 1,216 (32.7) | 937 (25.2) | 806 (23.7) | 686 (18.3) | <0.001 |
| CRP ≥2 mg/L | 570 (15.4) | 435 (11.7) | 312 (9.2) | 290 (7.7) | <0.001 |
| Fatty liver | 1,535 (41.3) | 1,606 (43.2) | 1,544 (45.4) | 1,643 (43.8) | 0.007 |
| 10-yr FRS ≥10% | 779 (21.0) | 921 (24.8) | 897 (26.4) | 933 (24.9) | <0.001 |
| CACS >0 | 378 (10.2) | 371 (10.0) | 337 (9.9) | 376 (10.0) | 0.983 |
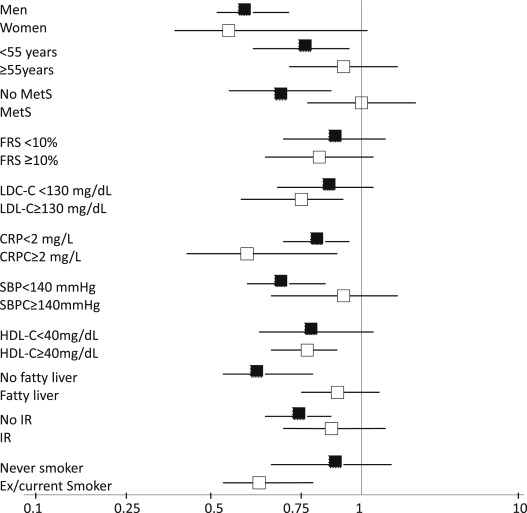
Because the proportion of subjects with CACS >0 and cardiovascular risk factors (i.e., IR, CRP ≥2 mg/L, fatty liver, and FRS ≥10%) varied between conjugated bilirubin quartiles, we tested associations between conjugated bilirubin and CACS >0 for being in the highest versus the lowest conjugated bilirubin quartile, according to each of the dichotomized groups. Figure 1 shows the ORs (95 CIs) between conjugated bilirubin concentration (highest vs lowest quartile) and CACS >0 for each dichotomized group. We tested whether cardiovascular risk factors influenced the association between conjugated bilirubin and CACS >0. Table 3 lists associations between quartiles of conjugated bilirubin and CACS >0 after adjustment for potential confounders. After adjustment for all cardiovascular risk factors, the association between conjugated bilirubin and CACS >0 remained significant.
| Quartile 1 | Quartile 2 | Quartile 3 | Quartile 4 | ||||
|---|---|---|---|---|---|---|---|
| Reference | OR (95% CI) | p | OR (95% CI) | p | OR (95% CI) | p | |
| Total bilirubin quartile | |||||||
| Model 1 | 1 | 0.818 (0.694–0.963) | 0.016 | 0.771 (0.653–0.910) | 0.002 | 0.754 (0.639–0.891) | 0.001 |
| Model 2 | 1 | 0.839 (0.708–0.994) | 0.043 | 0.801 (0.673–0.954) | 0.013 | 0.808 (0.676–0.965) | 0.019 |
| Model 3 | 1 | 0.838 (0.707–0.993) | 0.041 | 0.796 (0.669–0.948) | 0.011 | 0.802 (0.672–0.958) | 0.015 |
| Model 4 | 1 | 0.871 (0.735–1.034) | 0.114 | 0.854 (0.716–1.018) | 0.078 | 0.867 (0.724–1.037) | 0.118 |
| Conjugated bilirubin quartile | |||||||
| Model 1 | 1 | 0.806 (0.689–0.943) | 0.007 | 0.779 (0.662–0.917) | 0.003 | 0.646 (0.546–0.766) | <0.001 |
| Model 2 | 1 | 0.854 (0.726–1.005) | 0.057 | 0.859 (0.724–1.020) | 0.083 | 0.767 (0.638–0.922) | 0.005 |
| Model 3 | 1 | 0.854 (0.726–1.004) | 0.056 | 0.857 (0.722–1.017) | 0.077 | 0.764 (0.636–0.919) | 0.004 |
| Model 4 | 1 | 0.883 (0.750–1.039) | 0.135 | 0.922 (0.775–1.096) | 0.356 | 0.825 (0.685–0.994) | 0.043 |
| Unconjugated bilirubin quartile | |||||||
| Model 1 | 1 | 0.847 (0.718–0.999) | 0.048 | 0.793 (0.669–0.940) | 0.007 | 0.808 (0.685–0.954) | 0.012 |
| Model 2 | 1 | 0.865 (0.728–1.027) | 0.098 | 0.802 (0.671–0.958) | 0.015 | 0.831 (0.697–0.992) | 0.040 |
| Model 3 | 1 | 0.864 (0.727–1.025) | 0.094 | 0.795 (0.665–0.950) | 0.011 | 0.825 (0.692–0.985) | 0.034 |
| Model 4 | 1 | 0.906 (0.762–1.077) | 0.265 | 0.855 (0.715–1.023) | 0.086 | 0.894 (0.748–1.069) | 0.220 |
Stay updated, free articles. Join our Telegram channel

Full access? Get Clinical Tree


