Abnormal frontal QRS-T angle on a 12-lead electrocardiogram is associated with incident coronary heart disease and total mortality in a biracial cohort, but there have been no studies to date examining QRS-T angle’s prognostic value across multiple ethnicities. We studied 6,814 participants (52.7% women, mean age 62 years) from Multi-Ethnic Study of Atherosclerosis, a multiethnic cohort aged 45 to 84 years free of clinical cardiovascular disease (CVD) at enrollment. Baseline examination included measurement of traditional risk factors and 12-lead electrocardiograms. Frontal QRS-T axis was defined as normal (less than seventy-fifth percentile), borderline (seventy-fifth to ninety-fifth percentile), or abnormal (ninety-fifth percentile or more), and participants were followed for the composite end point of incident CVD events: cardiovascular death, myocardial infarction, angina pectoris, or heart failure. After 7.6 years of follow-up, there were 444 total events. Borderline (HR [hazard ratio] 1.37, 95% confidence interval [CI] 1.10 to 1.70) and abnormal QRS-T angles (HR 2.2, 95% CI 1.63 to 2.97) were associated with incident CVD events in multivariate-adjusted models. However, after adjusting for T-wave abnormalities, there was no statistically significant association of either borderline (HR 1.12, 95% CI 0.90 to 1.41) or abnormal (HR 1.31, 95% CI 0.93 to 1.84) QRS-T angle with incident CVD events. Abnormal frontal QRS-T angle predicts incident CVD events in a multiethnic population, and this increased risk is primarily mediated through T-wave abnormalities. QRS-T angle provides an easily interpretable continuous marker of abnormal ventricular repolarization that can aid the everyday clinician in risk prediction.
The QRS complex on a surface electrocardiogram (ECG) represents ventricular depolarization and the T wave represents ventricular repolarization. The frontal QRS-T angle, defined as the difference between QRS and T-wave axis, has been described as a marker of ventricular repolarization. Multiple epidemiologic studies to date have established that abnormal QRS-T angle predicts incident cardiovascular disease (CVD) events and mortality. Most studies, however, have been conducted on “spatial,” as opposed to “frontal” QRS-T angle. Although spatial QRS-T angle is not routinely available in a clinical setting, frontal QRS-T is easily calculated on 12-lead ECG by subtracting T angle from the QRS angle. Moreover, there have been no studies to date examining the association of abnormal QRS-T angle with incident CVD events across a multiethnic cohort such as the Multi-Ethnic Study of Atherosclerosis (MESA). Therefore, in the present analysis, we sought to describe the association of abnormal frontal QRS-T angle with incident CVD events in the MESA.
Methods
The MESA cohort was initiated to investigate the prevalence, correlates, and progression of subclinical CVD. Details about the study design have previously been published. Briefly, from July 2000 to August 2002, 6,814 men and women aged 45 to 84 years old, self-identified as white, black, Hispanic, or Chinese, and free of clinically apparent CVD were recruited from portions of 6 United States communities: Baltimore City and Baltimore County, Maryland; Chicago, Illinois; Forsyth County, North Carolina; Los Angeles County, California; Northern Manhattan and the Bronx, New York; and St. Paul, Minnesota. Each field site recruited from locally available sources, which included lists of residents, lists of dwellings, and telephone exchanges. The institutional review boards at all participating centers approved the study, and all participants gave informed consent.
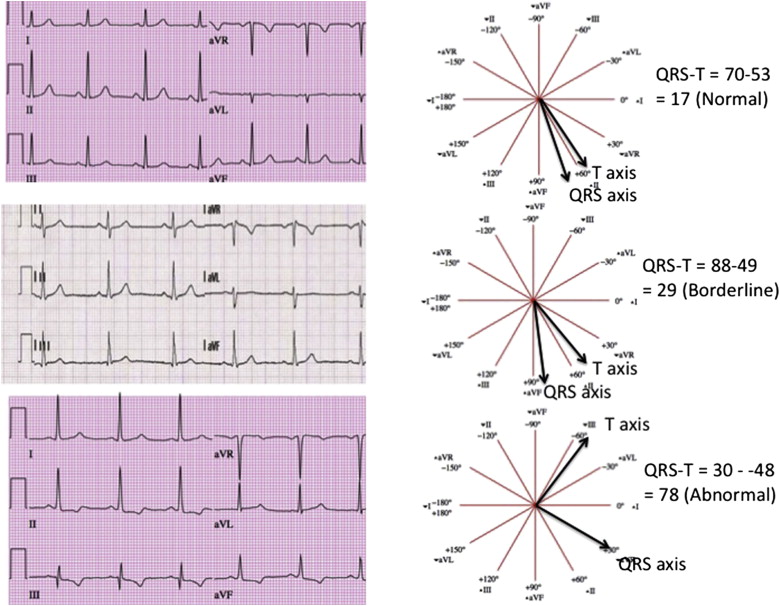
For electrocardiography, three 12-lead recordings were obtained using a Marquette MAC-PC instrument (Marquette Electronics, Milwaukee, Wisconsin). Electrocardiographic data were processed centrally at the EPICARE center, Wake Forest University using GE Marquette 12-SL 2001 (Milwaukee, Wisconsin) where the ECGs were classified and coded using both Minnesota Code and Novacode criteria. For the present analysis, baseline ECGs were used and frontal plane QRS-T angle was defined as the absolute value of the difference between the frontal plane QRS axis and T-wave axis (if QRS-T angle was >180° then QRS-T angle = 360° − absolute value). As shown in Figure 1 , QRS-T angle was defined as normal (more than seventy-fifth percentile), borderline (seventy-fifth to ninety-fifth percentile), or abnormal (ninety-fifth percentile or more). For the purposes of this study, major electrocardiographic abnormalities were defined by the presence of ≥1 of the following findings: major ventricular conduction defect, major Q wave, minor Q, QS waves with ST-T abnormalities, major isolated ST-T wave abnormalities, left ventricular hypertrophy, major QT prolongation (≥116%), atrial fibrillation, or major atrioventricular block. Minor electrocardiographic abnormalities were defined by the presence of ≥1 of the following findings: minor Q, QS waves, high R waves, minor isolated ST-T abnormalities, ST elevation, incomplete (left or right) bundle branch block, minor QT prolongation (≥112%), short PR segment (<120 ms), left-axis deviation (≥−90, ≤−30), right-axis deviation (≥120, ≤210), frequent ventricular premature beats, and other minor arrhythmias. ST- and T-wave abnormalities are defined according to Minnesota Code criteria. Of the 6,814 original participants at baseline, there were 48 participants excluded for missing ECGs, 87 excluded for incomplete coronary artery calcium and carotid intima-medial thickness measurements, 285 excluded for paced rhythm, Wolf-Parkinson-White pattern, bundle branch block (QRS ≥120 ms), or uninterpretable ECG, and lastly there were 26 participants excluded for missing follow-up data. Hence, there were 6,368 participants available for the present analysis.
At intervals of 9 to 12 months, an interviewer contacted each participant or a family member by telephone to inquire about interim hospital admissions, outpatient diagnoses of CVD, and deaths. To verify self-reported diagnoses, an independent adjudication committee obtained medical records for participants who had been hospitalized or received an outpatient diagnosis of CVD. Interviews were conducted with the next of kin and copies of death certificates were requested for participants who had died of cardiovascular causes outside the hospital. Event definitions have been previously published and are available for reference.
All analyses were performed using SAS, version 9.1 (SAS Institute, Cary, North Carolina). Baseline characteristics are described, after stratification by category of QRS-T angle, using means and SDs or percentages. Differences in means or percentages were compared between subgroups using general linear models ( t test) for continuous variables and chi-square tests for categorical variables, as appropriate. Unadjusted and multivariate-adjusted Cox proportional hazards regressions models were constructed with QRS-T angle as the predictor (categorized as normal [less than seventy-fifth percentile], borderline [seventy-fifth to ninety-fifth percentile], or abnormal [ninety-fifth percentile or more]) and the composite of cardiovascular death, myocardial infarction, angina, or heart failure hospitalization as the outcome. The normal category was considered the reference cell in the analysis, and adjustments were made for clinical and electrocardiographic variables. In secondary analyses, Cox proportional hazards regression models were constructed in gender-specific models adjusting for race and race-specific models adjusting for gender. A p value <0.05 was considered statistically significant.
Results
As listed in Table 1 , participants with borderline and abnormal QRS-T angle were older, had higher blood pressure, lower fitness level, and were more likely to be diabetic and have both major and minor electrocardiographic abnormalities including ST-T wave abnormalities and electrocardiographically diagnosed left ventricular hypertrophy. They were also more likely to have elevated measures of subclinical atherosclerosis (coronary artery calcium >0 and common carotid intima-medial thickness).
| Variable | Normal (n = 4,741), % | Borderline (n = 1,298), % | Abnormal (n = 329), % |
|---|---|---|---|
| Mean QRS-T angle | 14.9 ± 9.8 | 50.4 ± 11.9 | 104.3 ± 30.1 |
| Age, (yrs) ∗ | 60.6 ± 9.9 | 65 ± 9.9 | 68.3 ± 9.6 |
| Race (%) | |||
| White | 38 | 37.6 | 38.3 |
| Black | 27.7 | 27.1 | 27.1 |
| Asian | 12.2 | 12.6 | 12.2 |
| Hispanic | 22.1 | 22.7 | 22.5 |
| Women | 53.8 | 53.5 | 54.4 |
| Smoker | 13 | 13.4 | 13.1 |
| Systolic BP (mm Hg) | 124.5 ± 20.9 | 130.2 ± 21.9 | 138.6 ± 21.9 |
| Diastolic BP (mm Hg) | 71.6 ± 10.1 | 72.3 ± 10.5 | 74.6 ± 11.3 |
| Body mass index (kg/m 2 ) | 28.2 ± 5.4 | 28.4 ± 5.6 | 28.9 ± 6.0 |
| Waist/hip ratio | 0.92 ± 0.08 | 0.94 ± 0.08 | 0.95 ± 0.07 |
| Total cholesterol (mg/dl) | 194.6 ± 36.2 | 193.7 ± 34 | 194.9 ± 35.3 |
| HDL-cholesterol (mg/dl) | 51.3 ± 14.8 | 50.2 ± 14.7 | 51 ± 14.9 |
| LDL-cholesterol (mg/dl) | 117.5 ± 31.8 | 117.2 ± 30.1 | 116.6 ± 32.8 |
| Triglycerides (mg/dl) | 130.6 ± 91.9 | 134.3 ± 82.5 | 136.9 ± 78.2 |
| Glucose (mg/dl) | 96.2 ± 29.9 | 99.8 ± 30.5 | 102 ± 33.6 |
| Creatinine (mg/dl) | 0.94 ± 0.2 | 0.97 ± 0.3 | 1.0 ± 0.3 |
| Diabetes mellitus † | 11.2 | 15.7 | 17.7 |
| Treatment for hypertension | 30 | 38.8 | 46.8 |
| Treatment for hyperlipidemia | 15.2 | 17.8 | 19.5 |
| Physical activity (MET-min/week) | 6,020 ± 6,216 | 5,183 ± 4,933 | 4,604 ± 5,210 |
| Common carotid IMT (mm) | 0.85 ± 0.19 | 0.90 ± 0.21 | 0.94 ± 0.21 |
| QRS (ms) | 91.2 ± 9.5 | 92 ± 10.3 | 93.5 ± 10.5 |
| QTc (ms) | 416.1 ± 20.2 | 420 ± 20.6 | 425.8 ± 24.6 |
| Heart rate variability (RMSDD1) (NS) | 26.8 ± 21.7 | 26.4 ± 25.7 | 26.7 ± 31.6 |
| Minor and major ST abnormalities (Minnesota Code 4-1, 4-2, 4-3, and 4-4) | 2.3 | 7.2 | 37.4 |
| Minor and major T-wave abnormalities (Minnesota Code 5-1, 5-2, 5-3, and 5-4) | 6.1 | 23.6 | 64.1 |
| Major ECG abnormality (Minnesota Code) | 5.8 | 11 | 44 |
| Minor ECG abnormality (Minnesota Code) | 31.6 | 48.9 | 69.3 |
| ECG LVH ‡ | 0.4 | 0.9 | 10.3 |
| Coronary artery calcium >0 | 45.9 | 56.6 | 68.4 |
∗ Mean ± SD unless otherwise indicated.
† Defined as self-reported “yes” or fasting glucose ≥126 mg/dl.
‡ Cornell voltage >2,200 μV for women and >2,800 μV for men.
Stay updated, free articles. Join our Telegram channel

Full access? Get Clinical Tree


