Previous research has suggested that obesity is associated with increased high on-treatment platelet reactivity. We therefore tested platelet reactivity in 251 patients with VerifyNow P2Y12, vasodilator-stimulated phosphoprotein phosphorylation, and light transmission aggregometry with adenosine diphosphate 5 and 20 μM 6 to 24 hours after percutaneous coronary intervention. High on-treatment platelet reactivity was defined as a maximum platelet aggregation ≥46% for light transmission aggregometry with adenosine diphosphate 5 μM or ≥60% for 20 μM, platelet reactivity index ≥50% for vasodilator-stimulated phosphoprotein phosphorylation, and P2Y12 reaction units ≥235 for VerifyNow. The relation between body mass index (BMI) and platelet reactivity values was examined with Spearman coefficients; BMI and high on-treatment platelet reactivity were assessed with Student’s t test. Multivariable logistic regression for high on-treatment platelet reactivity was also performed. Average BMI was 30.3 ± 5.9 kg/m 2 and 44% of patients had a BMI ≥30 kg/m 2 . Overall there was very poor correlation between BMI and on-treatment platelet reactivity, with Spearman coefficients ranging from 0.08 to 0.10. BMI was also not associated with the various definitions of high on-treatment platelet reactivity. Multivariable logistic regressions showed no association between BMI and high on-treatment platelet reactivity. In conclusion, and contrary to previous reports, we found no association whatsoever between BMI and on-treatment platelet reactivity as quantified by a variety of platelet function tests.
Numerous publications have shown that high on-treatment platelet reactivity in patients taking clopidogrel is associated with major adverse cardiac events and periprocedural myonecrosis after percutaneous coronary intervention. Similarly, patients with increased levels of arachidonic acid–induced platelet aggregation, despite aspirin therapy, suffer adverse cardiac events more frequently. Recent efforts have focused upon genetic polymorphisms, in particular CYP 2C19*2, that result in less efficient metabolism of clopidogrel. Patients with a “poor metabolizer” phenotype are thus at an increased risk of inadequate platelet inhibition despite antiplatelet therapy. Many factors that determine interindividual variability in on-treatment platelet reactivity, however, remain obscure. Obesity has been proposed in multiple studies as an independent risk factor. Some studies, however, have shown increased body mass index (BMI) to be associated with improved outcomes after percutaneous coronary intervention. This “obesity paradox” is thus at odds with platelet reactivity studies. We therefore sought to examine the relation between BMI and on-treatment platelet reactivity using light transmission aggregometry (LTA), vasodilator-stimulated phosphoprotein phosphorylation (VASP), VerifyNow P2Y12, and VerifyNow aspirin assays. We hypothesized that increasing BMI would be associated with high on-treatment platelet reactivity.
Methods
Patients ≥18 years of age presenting for elective and urgent percutaneous coronary intervention at a single center were consecutively enrolled in this study from October 2009 through December 2010. All patients received a 600-mg loading dose of clopidogrel ≥6 hours before platelet reactivity testing or a 75-mg maintenance dose for ≥5 days before testing. All patients received aspirin 325 mg 6 to 24 hours before testing. After the procedure aspirin was prescribed indefinitely and clopidogrel was prescribed for a minimum of 1 month in patients receiving bare metal stents and 12 months in patients receiving drug-eluting stents.
Patients receiving the glycoprotein IIb/IIIa inhibitor eptifibatide ≤8 hours before platelet reactivity testing were excluded (no patients received abciximab or tirofiban), as were patients on warfarin and nonsteroidal anti-inflammatory drugs. Patients known to be pregnant, with a history of bleeding diathesis, active bleeding, platelet count <100 × 10 9 /L, hematocrit <25%, or who had received a blood transfusion in the preceding 10 days were also excluded. Written informed consent was obtained before platelet reactivity testing. The institutional review board at Washington Hospital Center and MedStar Research Institute (Washington, DC) approved this study.
All patients underwent platelet reactivity testing with 4 assays simultaneously: LTA (Chrono-Log, Havertown, Pennsylvania), VASP analysis (FACSCalibur flow cytometer, BD Biosciences, San Jose, California), and the VerifyNow P2Y12 and aspirin assays (Accumetrics, San Diego, California). The objective was to assess on-treatment platelet reactivity measured 6 to 24 hours after percutaneous coronary intervention. Whole blood samples were drawn through an ≥18-gauge needle into 3.2% sodium citrate tubes including 1 1.8-ml Greiner tube for the VerifyNow assay. Two highly trained research scientists performed the platelet reactivity testing within 3 hours of blood sampling.
LTA was performed at 37°C using platelet-rich plasma, which was obtained by centrifugation of citrated whole blood for 10 minutes at 1,000 rpm. LTA results were not adjusted for baseline platelet count because this time-consuming process has been shown to be unnecessary. Aggregation parameters were measured with adenosine diphosphate (ADP) 5 and 20 μM as agonists; these on-treatment platelet reactivity values are reported as percentages of maximum platelet aggregation.
VASP analysis was performed using the PLT VASP/P2Y12 assay (BioCytex, Marseille, France). First, whole blood was incubated with ADP with or without prostaglandin E1. A monoclonal antibody to label the VASP protein in its phosphorylated state was then added. This antibody was then stained with a fluorescein reagent, which can be detected as mean fluorescence intensity by flow cytometry. The ratio of mean fluorescence intensity of prostaglandin E1 minus mean fluorescence intensity of ADP plus prostaglandin E1 to mean fluorescence intensity of prostaglandin E1 was then calculated to estimate the ratio of activated versus nonactivated platelets. This value was reported as the platelet reactivity index.
The VerifyNow P2Y12 assay was performed by addition of whole blood to dedicated cartridges containing fibrinogen-coated beads, ADP 20 μM (as the agonist), and prostaglandin E1 22 nmol (to decrease the nonspecific contribution of P2Y1 receptors). This point-of-care system uses turbidimetric optical detection to measure changes in light transmittance that result from clumping of fibrinogen-coated beads, with these changes reported as P2Y12 reaction units. The VerifyNow aspirin assay was performed in a similar manner but used arachidonic acid as the agonist; this result is reported as aspirin reaction units (we did not perform LTA with arachidonic acid in this cohort).
A dedicated data coordinating center performed all data management and analyses. Prespecified clinical and laboratory data during hospitalization periods were obtained from hospital charts reviewed by independent research personnel blinded to objectives of the study. High on-treatment platelet reactivity was defined according to recent white paper definitions: maximum platelet aggregation >46% for LTA with ADP 5 μM, platelet reactivity index >50% for VASP, and P2Y12 reaction units <235 for VerifyNow P2Y12. Although there is no consensus definition for high on-treatment platelet reactivity as measured by LTA with ADP 20 μM, we selected maximum platelet aggregation >60% based on previous studies. Similarly, we used an aspirin reaction units threshold >550 based on previous research. BMI was calculated as kilograms per meter squared based on weight and height at the time of hospital admission.
Continuous variables are presented as mean ± SD or median ± interquartile range; categorical variables are presented as percentages. Normality was assessed with the Kolmogorov–Smirnov test. Differences in continuous variables between groups were compared using Student’s t test or Wilcoxon rank-sum test. Categorical variables were compared using chi-square test or Fisher’s exact test. A p value <0.05 was considered statistically significant. Statistical analyses were performed using SAS 9.1 (SAS Institute, Cary, North Carolina).
The relation between BMI and platelet reactivity values was examined with Spearman correlation coefficients and scatter plots. The relation between BMI and high on-treatment platelet reactivity was assessed with Student’s t test. In addition, the relation between BMI >30 kg/m 2 and high on-treatment platelet reactivity was assessed with the chi-square test. Multivariable logistic regressions, with high on-treatment platelet reactivity as the outcome and BMI as the covariable of interest, were also performed. Models were constructed for VerifyNow P2Y12 and VASP. Covariables were selected based on univariable p values and overall clinical significance. Remaining covariables in the 2 models included acute presentation (ST-segment elevation or non–ST-segment elevation acute coronary syndrome) and a history of diabetes mellitus, hypertension, chronic renal insufficiency, and current smoking.
Results
Two hundred fifty-one patients underwent ≥1 platelet reactivity test and were included in the analysis. Average BMI was 30.3 ± 5.9 kg/m 2 (range 16.9 to 51.7); 17.1% had a BMI <25 kg/m 2 , 38.6% had a BMI 25 to 29.9 kg/m 2 , 25.5% had a BMI 30 to 34.9 kg/m 2 , and 18.7% had a BMI ≥35 kg/m 2 . Overall 44% of patients had a BMI ≥30 kg/m 2 ; such patients were more likely to have a history of diabetes mellitus but were otherwise generally similar to nonobese patients ( Table 1 ). Overall average age in years was 64.9 years; 185 patients (74%) were men, 61 (24.3%) were African-American, 218 (86.9%) had a history of systemic hypertension, 74 (29.5%) were current smokers, and 39 (15.5%) presented with an acute coronary syndrome.
| BMI ≤30 kg/m 2 | BMI >30 kg/m 2 | p Value | |
|---|---|---|---|
| (n = 140) | (n = 111) | ||
| Age (years), mean ± SD | 64.4 ± 12.5 | 61.1 ± 11.0 | 0.28 |
| Men | 102 (73.4%) | 83 (74.8%) | 0.80 |
| Caucasian | 94 (67.1%) | 83 (74.8%) | 0.19 |
| African-American | 33 (23.6%) | 28 (25.2%) | 0.76 |
| Current smoker | 38 (27.1%) | 36 (32.4%) | 0.36 |
| Acute coronary syndrome | 24 (17.1%) | 15 (13.5%) | 0.43 |
| Diabetes mellitus | 39 (28.1%) | 52 (46.8%) | 0.002 |
| Systemic hypertension ⁎ | 117 (83.6%) | 101 (91.0%) | 0.08 |
| Chronic renal failure | 25 (17.9%) | 15 (13.6%) | 0.37 |
| Congestive heart failure | 22 (15.7%) | 20 (18.0%) | 0.63 |
| Previous coronary bypass | 31 (22.1%) | 30 (27.0%) | 0.37 |
| Previous myocardial infarction | 34 (24.3%) | 38 (34.9%) | 0.07 |
| Body mass index (kg/m 2 ) | 26.2 ± 2.9 | 35.5 ± 4.5 | <0.001 |
⁎ History of hypertension diagnosed and/or treated with medication or currently being treated with diet and/or medication by a physician.
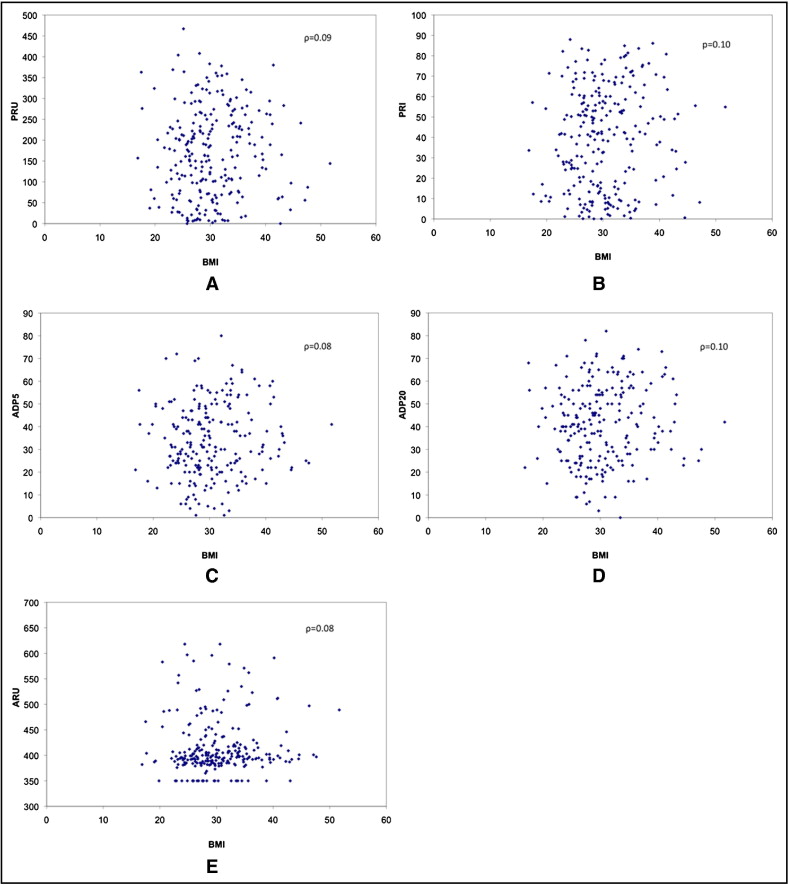
All 5 platelet reactivity tests were not normally distributed. Medians (interquartile ranges) for each test were 398 (387 to 420) for VerifyNow aspirin, 164 (75 to 246) for VerifyNow P2Y12, 41.5% (16.2 to 59.7) for VASP, 32% (23 to 44) for LTA with ADP 5 μM, and 41% (27 to 54) for LTA with ADP 20 μM. Prevalences of high on-treatment platelet reactivity by each test were 27.8% for VerifyNow P2Y12, 39.5% for VASP, 23.6% for LTA with ADP 5 μM, 15.5% for LTA with ADP 20 μM, and 4.7% for VerifyNow aspirin. Regarding correlation, Spearman coefficients (ρ) and scatter plots were used to examine the relation between continuous variables of BMI and each platelet reactivity test ( Figure 1 ). Overall there was very poor correlation and significant scatter, with ρ ranging from 0.08 to 0.10 and p values ranging from 0.11 (VerifyNow) to 0.25 (LTA with ADP 5 μM).
The relation between BMI and high on-treatment platelet reactivity was also explored ( Table 2 ). Using definitions specific to each test, there was still no statistically significant association with BMI (as a continuous or a categorical variable). This lack of association persisted despite multivariable adjustment using models for high on-treatment platelet reactivity as defined by VerifyNow P2Y12 and VASP. Specifically, the model for VerifyNow P2Y12 showed that only chronic renal insufficiency was associated with high on-treatment platelet reactivity (odds ratio 2.13, 95% confidence interval 1.01 to 4.46, p = 0.046); chronic renal insufficiency, however, was not significant in the VASP model. BMI was not associated with high on-treatment platelet reactivity in the VerifyNow P2Y12 (odds ratio 1.04, 95% confidence interval 0.99 to 1.09, p = 0.15) or VASP (odds ratio 1.03, 95% confidence interval 0.98 to 1.08, p = 0.23) model.


