We aimed to examine whether an association exists between the presence and extent of coronary lipid core plaques (LCPs) detected by near-infrared spectroscopy (NIRS) performed before percutaneous coronary intervention (PCI) with postprocedural myocardial infarction (MI). NIRS was performed in the native coronary arteries of 30 patients before PCI. Angular extent of LCP, lesion segment lipid core burden index, and block chemogram were evaluated. Cardiac biomarkers were measured before and 16 to 24 hours after PCI to determine occurrence of postprocedural MI. Mean number of 2-mm yellow blocks within the stented lesion was 1.4 ± 2.1 and mean lesion lipid core burden index was 110.3 ± 99. Using a definition of creatine kinase-MB >1 time upper limit of normal (ULN), >2 times ULN, and >3 times ULN, MI after PCI occurred in 23%, 13%, and 10% of patients, respectively. Compared to patients who did not have MI after PCI, those who did had similar clinical characteristics but received more stents and had more blocks within the stented lesion. Creatine kinase-MB increase >3 times ULN was observed in 27% of patients with ≥1 yellow block versus in none of the patients without a yellow block within the stented lesion (p = 0.02). In conclusion, PCI of LCP-positive lesions as assessed by NIRS is associated with increased risk for MI after PCI. NIRS may allow lesion-specific risk stratification before PCI and optimization of PCI strategies for myocardial injury risk minimization.
Recently an in vivo catheter-based near-infrared spectroscopic system was developed and validated for detection of coronary lipid core plaques (LCPs). Stenting of large LCPs has been associated with distal embolization and no reflow in case reports. In the present study, we sought to determine whether percutaneous coronary intervention (PCI) of an LCP as detected by near-infrared spectroscopy (NIRS) is associated with postprocedural myocardial infarction (MI).
Methods
Consecutive patients who underwent coronary near-infrared spectroscopic imaging at our institution were evaluated for inclusion in the study (n = 220). Patients were excluded if they were already enrolled in an Observational Study of Cholesterol in Coronary Arteries (COLOR) registry (identifier NCT00831116 , available at: http://www.clinicaltrials.gov ) (n = 154), if they had near-infrared spectroscopic scans of a bypass graft or NIRS was performed only after PCI (n = 34), or if they did not have cardiac biomarker measurements before or after PCI (n = 2). Thirty patients were included in the present study. The study was approved by our institutional review board.
Coronary near-infrared spectroscopic imaging was performed using a 3.2Fr 165-cm coronary catheter (Lipiscan, InfraRedx, Burlington, Massachusetts) that was inserted in the target vessel over a 0.014-inch guidewire before PCI. The catheter was pulled back using an automatic pullback and rotation device at a speed of 0.5 mm/s and 240 rpm until it was withdrawn into the guiding catheter. Borders of the target lesion, which was the region of intervention for the present analysis, and other anatomic landmarks such as side branches were marked using contrast visualization before chemographic acquisition. After the operator visually assessed the chemograms, near-infrared spectroscopic images were recorded to a compact disk for quantitative analysis offline. No complications occurred during near-infrared spectroscopic imaging.
The primary output of the near-infrared spectroscopic algorithm is the probability that LCPs are present in the vessel scanned. This probability is displayed as a chemographic image, summarized as a block chemographic image, and quantified by the lipid core burden index, as highlighted in Figures 1 and 2 . In a chemographic image, each pixel corresponds to a specific location in the scanned vessel; the x axis is the length (millimeters) of the vessel and the y axis represents the circumferential location (degrees). Each group of probabilities is assigned a color; yellow indicates the highest probability of lipid present at a specific location (>60%). The block chemogram summarizes the chemographic image in 2-mm segments, where a yellow block represents that the probability of LCP present in a 2 mm region is >95%. Lipid core burden index is an automated measurement and represents the proportion of the number of pixels with lipid probability score >0.6 to the number of all valid pixels in the analyzed chemographic section multiplied by 1,000. Because the lipid core burden index is dependent on length of the vessel scanned, only the lipid core burden index within the region of intervention was considered in this study. To determine the region of intervention, the chemographic image was compared to the angiograms taken before PCI.
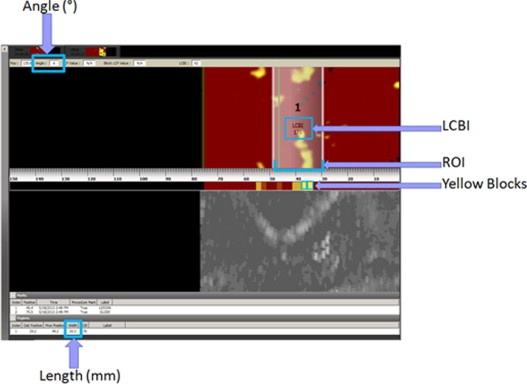
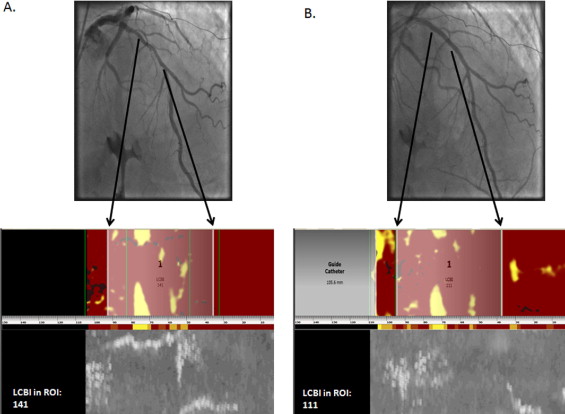
Quantification of amount of LCPs within the PCI target lesion was performed using the Lipiscan Data Analyzer software (InfraRedx, Burlington, Massachusetts). The largest angle of LCP found within the PCI target lesion was measured using electronic calipers. The number of yellow blocks found in the block chemographic image within the PCI target lesion was also counted. Near-infrared spectroscopic findings used in this study were the lipid core burden index within the region of intervention, greatest angular extent, number of yellow blocks, and length of lesion. All near-infrared spectroscopic measurements were performed blinded to occurrence of MI after PCI.
Cardiac biomarkers (creatine kinase-MB) were measured before PCI and 16 to 24 hours after PCI. Periprocedural MI was defined as creatine kinase-MB increases >1 times, >2 times, and >3 times the upper limit of normal (ULN). If creatine kinase-MB was increased before stenting, then MI after PCI was defined as a ≥50% increase over the baseline levels. Determination of MI after PCI was performed blinded to near-infrared spectroscopic findings. Association of near-infrared spectroscopic findings with magnitude of MI after PCI was evaluated.
Continuous parameters were presented as mean ± SD and were compared using Wilcoxon rank-sum test. Nominal variables were presented as percentages and compared using Pearson chi-square test. A p value <0.05 was considered statistically significant. All analyses were conducted using JMP 8.0 (SAS Institute, Cary, North Carolina).
Results
Baseline and near-infrared spectroscopic characteristics of study patients are listed in Table 1 . All patients were men with a high prevalence of coronary artery disease risk factors. In most patients, the PCI target vessel was the left anterior descending coronary artery and was treated with drug-eluting stent implantation. Within the lesion, mean number of 2-mm yellow blocks presented in the block chemogram was 1.4 ± 2.1 and mean lesion lipid core burden index was 110 ± 99. Mean number of yellow blocks found in the entire scanned region of the artery was 2.0 ± 2.3.
| Variable | All Patients (n = 30) | MI After PCI | p Value | |
|---|---|---|---|---|
| Yes | No | |||
| (n = 7) | (n = 23) | |||
| Age (years) ⁎ | 63 ± 7 (61) | 60 ± 8 (59) | 64 ± 7 (61) | 0.29 |
| Men | 30 | 7 | 23 | 1.0 |
| Clinical presentation | 0.77 | |||
| Stable angina pectoris | 18 | 5 | 13 | |
| Unstable angina pectoris | 2 | 0 | 2 | |
| Acute myocardial infarction | 8 | 2 | 6 | |
| Atypical chest pain | 2 | 0 | 2 | |
| Hypertension † | 27 | 6 | 21 | 0.67 |
| Hyperlipidemia ‡ | 27 | 6 | 21 | 0.67 |
| Diabetes mellitus | 15 | 1 | 14 | 0.04 |
| Tobacco use | 0.28 | |||
| Never used | 4 | 1 | 3 | |
| Previous user | 16 | 2 | 14 | |
| Current user | 10 | 4 | 6 | |
| Previous myocardial infarction | 12 | 3 | 9 | 0.86 |
| Previous coronary artery bypass grafting | 6 | 0 | 6 | 0.13 |
| Previous percutaneous coronary intervention | 14 | 4 | 10 | 0.53 |
| Number of diseased coronary arteries ⁎ | 1.6 ± 0.8 (1) | 2.1 ± 1.1 (2) | 1.6 ± 0.9 (1) | 0.89 |
| Body mass index (kg/m 2 ) ⁎ | 32 ± 6 (30.7) | 31 ± 6 (29) | 32 ± 6 (31) | 0.61 |
| Total cholesterol (mg/dl) ⁎ | 162 ± 51 (149) | 161 ± 48 (160) | 162 ± 52 (147) | 0.98 |
| Low-density lipoprotein cholesterol (mg/dl) ⁎ | 90 ± 36 (78) | 91 ± 39 (78) | 89 ± 36 (78) | 0.90 |
| High-density lipoprotein cholesterol (mg/dl) ⁎ | 34 ± 8 (34) | 39 ± 9 (40) | 33 ± 8 (33) | 0.13 |
| Triglycerides (mg/dl) ⁎ | 206 ± 151 (153) | 156 ± 104 (155) | 221 ± 161 (152) | 0.45 |
| Target coronary artery | 0.41 | |||
| Left anterior descending/diagonal | 18 | 5 | 13 | |
| Circumflex/obtuse marginal | 5 | 1 | 4 | |
| Right/posterior descending | 6 | 0 | 6 | |
| Ramus | 1 | 1 | 0 | |
| Anticoagulation | 0.75 | |||
| Unfractionated heparin | 6 | 1 | 5 | |
| Bivalirudin | 19 | 5 | 14 | |
| Unfractionated heparin and eptifibatide/tirofiban | 3 | 0 | 3 | |
| Bivalirudin and eptifibatide/tirofiban | 2 | 1 | 1 | |
| Stent type | 0.57 | |||
| Drug eluting | 29 | 6 | 21 | |
| Bare metal | 2 | 1 | 1 | |
| Balloon angioplasty | 1 | 0 | 1 | |
| Number of stents ⁎ | 1.4 ± 0.8 (1) | 2.1 ± 1.1 (2) | 1.1 ± 0.46 (1) | 0.004 |
| Length of stent (mm) ⁎ | 24.8 ± 15.7 (20) | 31.3 ± 24.6 (20) | 22.9 ± 11.9 (20) | 0.65 |
| Lipid core burden index in region of intervention ⁎ | 110 ± 96 (101.5) | 145 ± 82 (141) | 100 ± 102 (60) | 0.18 |
| Yellow blocks within region of intervention ⁎ | 1.4 ± 2.1 (0.5) | 2.3 ± 1.4 (2) | 1.2 ± 2.2 (0) | 0.02 |
| Total yellow blocks in scanned artery ⁎ | 2.0 ± 2.3 (2) | 3.1 ± 2.3 (2) | 1.7 ± 2.2 (1) | 0.09 |
| Greatest angular extent in region of intervention (°) ⁎ | 154 ± 135 (103) | 228 ± 124 (269) | 131 ± 132 (84) | 0.07 |
Stay updated, free articles. Join our Telegram channel

Full access? Get Clinical Tree


