Increased red blood cell distribution width (RDW) has been associated with adverse outcomes in heart failure and stable coronary disease. We studied the association between baseline RDW and changes in RDW during hospital course with clinical outcomes in patients with acute myocardial infarction (AMI). Baseline RDW and RDW change during hospital course were determined in 1,709 patients with AMI who were followed for a median of 27 months (range 6 to 48). The relation between RDW and clinical outcomes after hospital discharge were tested using Cox regression models, adjusting for clinical variables, baseline hemoglobin, mean corpuscular volume, and left ventricular ejection fraction. Compared to patients in the first RDW quintile, the adjusted hazard ratios for death progressively increased with higher quintiles of RDW (second quintile 1.1, 95% confidence interval [CI] 0.6 to 2.1; third quintile 1.8, 95% CI 1.0 to 3.2; fourth quintile 2.0, 95% CI 1.1 to 3.4; fifth quintile 2.8, 95% CI 1.6 to 4.7, p for trend <0.0001). An increase in RDW during hospital course was also associated with subsequent mortality (adjusted hazard ratio 1.13 for 1-SD increase in RDW, 95% CI 1.02 to 1.25). Similar results were obtained for the end point of heart failure. The association between increased RDW and worse outcome was evident in patients with and without anemia. In conclusion, there is a graded, independent association between increased RDW and mortality after AMI. An increase in RDW during hospitalization also portends adverse clinical outcome.
Red blood cell distribution width (RDW), a measurement of the variability in size of circulating erythrocytes, is also reported as part of the routine blood cell count. Recent studies have reported a strong independent association between increased RDW and the risk of adverse outcomes in patients with heart failure and in patients with stable coronary disease. However, there is no information regarding the prognostic significance of RDW in acute myocardial infarction (AMI). In addition, previous studies have used a single RDW measurement, and no information is available regarding the potential impact of changes in RDW occurring during hospital course. In the present study we used a prospective database to investigate the association between RDW and risk of all-cause mortality and adverse cardiovascular outcomes in patients with AMI. The database provided an opportunity to study the relation between baseline RDW and changes in RDW with cardiovascular outcomes, controlling for severity of concomitant anemia.
Methods
Patients presenting to the intensive coronary care unit were eligible for the study if they had a diagnosis of AMI. The study was conducted in accordance with the principles of the Declaration of Helsinki and approved by the institutional review committee on human research.
Hemoglobin levels, mean corpuscular volume (MCV), and RDW were measured on admission and before hospital discharge using the Advia 120 Hematology Analyzer (Siemens Healthcare Diagnostics, Deerfield, Illinois). Data on red blood cell transfusions was collected in each patient.
Anemia was defined as hemoglobin levels lower than 13 g/dL in men and 12 g/dL in women, in accordance with the World Health Organization criteria. Standard criteria for microcytosis (MCV <82 fl) and macrocytosis (MCV >98 fl) were used.
RDW is reported as a coefficient of variation (percentage) of red blood cell volume. The normal range for RDW in our laboratory is 11.5% to 14.5%. The correctness of this normal range was confirmed by analyzing RDW data in 17,293 ambulatory subjects with coronary artery disease risk factors who attended the Rambam Center for Preventive Medicine for a medical examination and health counseling. In this group, mean RDW was 13.1% (median 13.0) with a 95% confidence interval (CI) of RDW of 12.0% to 14.4%.
All patients were followed for ≥12 months after hospital discharge. The primary end point of the study was all-cause mortality after hospital discharge. Secondary end points included readmission for management of heart failure (defined by presence of new symptoms of dyspnea with pulmonary venous congestion on x-ray with interstitial or alveolar edema) and recurrent infarction. After hospital discharge, clinical end-point information was acquired by reviewing the national death registry and by contacting each patient individually and independently reviewing the hospital course for major clinical events if the patient had been rehospitalized.
Continuous variables are presented as means ± SDs or medians (interquartile ranges), and categorical variables as numbers and percentages. Baseline characteristics of groups were compared using analysis of variance for continuous variables and by chi-square statistic for categorical variables. Changes in RDW at different time points were evaluated using a nonparametric approach to paired measurements (Wilcoxon signed-ranks test).
RDW was categorized according to quintiles of distribution, with the lowest quintile serving as the reference group. Survival curves were constructed using the Kaplan-Meier method, and comparisons were made using log-rank test. Stepwise Cox proportional hazards models with backward selection were used to calculate hazard ratios (HRs) and 95% CIs for RDW categories. Cox models were adjusted for age, gender, previous infarction, previous heart failure, history of diabetes, hypertension, smoking status, serum creatinine, anterior location of the infarction, ST-elevation infarction, Killip class at admission, thrombolytic therapy, primary angioplasty, coronary revascularization during hospital course, and medical therapy (antiplatelet agents, β blockers, angiotensin-converting-enzyme inhibitors, and statins). The Cox models were also adjusted for baseline hemoglobin, baseline MCV, and for left ventricular (LV) ejection fraction (EF) using a dummy variable for coding missing LVEF (n = 115, 6.7%).
The relation between changes in RDW during hospital course and outcome was analyzed by categorizing patients according to RDW at baseline and discharge and using RDW change as a continuous variable. We also compared the predictive value of RDW at baseline and before hospital discharge. Nested models were compared using chi-square likelihood-ratio tests to determine whether Cox regression models that included categories of RDW at admission and RDW before hospital discharge provided significantly better fit than Cox regression models limited to RDW at admission and vice versa.
In confirmatory analyses, we verified the relation between RDW and clinical outcomes after excluding patients with anemia on admission, patients receiving blood transfusions during hospital course, and patients with microcytosis or macrocytosis. Differences were considered statistically significant at the 2-sided p <0.05 level. Statistical analyses were performed using SPSS 15.0 (SPSS, Inc., Chicago, Illinois).
Results
From July 2001 to September 2007, 1,925 patients were recruited to the study. We excluded patients with malignancy (n = 40), inflammatory disease (n = 10), surgery or trauma within the previous month (n = 29), missing repeated hemoglobin measurements (n = 22), and in-hospital death (n = 115). The study population consisted of the 1,709 remaining patients.
Clinical characteristics of patients according to quintiles of baseline RDW are presented in Table 1 . Patients with higher RDW values were older, more likely to be women, and had higher baseline creatinine levels. They had lower baseline hemoglobin and MCV and were more likely to have previous infarction, previous heart failure, diabetes, and hypertension. They were more likely to present with higher Killip class and less likely to undergo coronary revascularization during the index hospitalization.
| Characteristic | RDW Quintile | p Value | ||||
|---|---|---|---|---|---|---|
| ≤12.8 | 12.9–13.2 | 13.3–13.7 | 13.8–14.3 | ≥14.4 | ||
| (n = 324) | (n = 327) | (n = 372) | (n = 332) | (n = 354) | ||
| Age (years) | 56 ± 12 | 60 ± 13 | 61 ± 12 | 63 ± 13 | 66 ± 13 | <0.0001 |
| Women | 50 (15%) | 54 (17%) | 79 (21%) | 78 (24%) | 112 (32%) | <0.0001 |
| Previous myocardial infarction | 50 (15%) | 51 (16%) | 82 (22%) | 73 (22%) | 84 (24%) | 0.01 |
| Previous heart failure | 12 (4%) | 16 (5%) | 18 (5%) | 22 (7%) | 37 (11%) | 0.002 |
| Current smoker | 31 (10%) | 37 (11%) | 56 (15%) | 48 (15%) | 46 (13%) | 0.18 |
| Hypertension (history) | 150 (46%) | 150 (46%) | 173 (47%) | 182 (55%) | 206 (58%) | 0.001 |
| Diabetes mellitus | 86 (27%) | 76 (23%) | 103 (28%) | 109 (33%) | 123 (35%) | 0.006 |
| Creatinine (mg/dl) | 0.9 [0.8–1.0] | 0.9 [0.8–1.1] | 0.9 [0.8–1.1] | 1.0 [0.8–1.2] | 1.0 [0.8–1.3] | <0.0001 |
| Baseline hemoglobin (g/dl) | 14.5 ± 1.6 | 14.4 ± 1.5 | 14.3 ± 1.6 | 14.0 ± 1.8 | 13.2 ± 1.9 | <0.0001 |
| Anemia (World Health Organization) | 40 (12%) | 30 (9%) | 60 (16%) | 60 (18%) | 120 (34%) | <0.0001 |
| Mean corpuscular volume (μm 3 ) | 88 ± 4 | 88 ± 4 | 87 ± 5 | 88 ± 5 | 86 ± 7 | <0.0001 |
| Systolic blood pressure (mm Hg) | 132 ± 24 | 133 ± 24 | 133 ± 26 | 132 ± 29 | 133 ± 27 | 0.99 |
| Heart rate (beats/minute) | 77 ± 18 | 76 ± 17 | 78 ± 18 | 79 ± 17 | 79 ± 18 | 0.31 |
| Killip class >I | 39 (12%) | 59 (18%) | 81 (22%) | 85 (26%) | 111 (31%) | <0.0001 |
| ST-elevation infarction | 227 (86%) | 276 (84%) | 323 (87%) | 262 (79%) | 264 (75%) | <0.0001 |
| Anterior wall infarct | 145 (45%) | 135 (41%) | 156 (42%) | 154 (46%) | 169 (48%) | 0.36 |
| Reperfusion therapy | 77 (24%) | 90 (28%) | 92 (25%) | 82 (25%) | 78 (22%) | 0.58 |
| Primary angioplasty | 104 (32%) | 88 (27%) | 115 (31%) | 94 (28%) | 87 (25%) | 0.19 |
| Left ventricular ejection fraction (%) | 47 ± 12 | 46 ± 12 | 46 ± 12 | 44 ± 13 | 45 ± 13 | 0.06 |
| In hospital medications | ||||||
| Antiplatelet agents | 316 (98%) | 317 (97%) | 364 (98%) | 319 (96%) | 335 (95%) | 0.13 |
| β blockers | 294 (91%) | 282 (86%) | 307 (83%) | 266 (80%) | 285 (81%) | <0.0001 |
| Angiotensin-converting enzyme inhibitors/angiotensin receptor blockers | 264 (82%) | 257 (79%) | 308 (83%) | 263 (79%) | 280 (79%) | 0.54 |
| Statins | 225 (69%) | 226 (69%) | 257 (69%) | 199 (60%) | 196 (55%) | <0.0001 |
| Coronary revascularization | 131 (40%) | 141 (43%) | 172 (46%) | 138 (42%) | 119 (34%) | 0.01 |
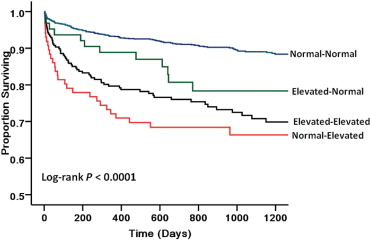
Median duration of follow-up after hospital discharge was 27 months (range 12 to 50). During the follow-up period 222 patients (13.0%) died. Median RDW was significantly higher in patients who died than in patients who survived (14.0%, interquartile range 13.4 to 14.9, vs 13.5%, interquartile range, 12.9 to 14.1, p <0.0001). Kaplan-Meier analysis showed a graded increased probability of death during follow-up with increasing quintiles of RDW ( Figure 1 ).
In a univariable Cox proportional hazards model, there was a graded positive association between RDW and all-cause mortality after hospital discharge. Small changes in RDW were associated with large increases in HR for mortality, with an unadjusted HR of nearly fivefold in patients in the fifth RDW quintile compared to patients in the first RDW quintile ( Table 2 ). Although attenuated, the association between RDW and subsequent mortality remained significant after multivariable adjustment that included clinical variables, baseline hemoglobin, baseline MCV, and LVEF ( Table 2 ). Using baseline RDW as a continuous variable, the adjusted HR for 1-SD increase in RDW was 1.30 (95% CI 1.16 to 1.46, p <0.0001).
| Model | Patients | Events | Unadjusted | Adjusted ⁎ | ||||
|---|---|---|---|---|---|---|---|---|
| HR (95% CI) | p Value | p Value for Trend | HR (95% CI) | p Value | p Value for Trend | |||
| Baseline red blood cell distribution width | ||||||||
| First quintile | 324 | 20 (6.2%) | 1.0 | — | <0.0001 | 1.0 | — | <0.0001 |
| Second quintile | 327 | 30 (9.2%) | 1.4 (0.8–2.6) | 0.25 | 1.1 (0.6–2.1) | 0.70 | ||
| Third quintile | 372 | 47 (12.6%) | 2.4 (1.4–4.2) | 0.002 | 1.8 (1.0–3.2) | 0.04 | ||
| Fourth quintile | 332 | 61 (18.4%) | 3.3 (1.9–5.7) | <0.0001 | 2.0 (1.1–3.4) | 0.02 | ||
| Fifth quintile | 354 | 89 (25.1%) | 4.8 (3.8–8.1) | <0.0001 | 2.8 (1.6–4.7) | <0.0001 | ||
| Discharge red blood cell distribution width | ||||||||
| First quintile | 319 | 15 (4.7%) | 1.0 | — | <0.0001 | 1.0 | — | <0.0001 |
| Second quintile | 374 | 38 (10.2%) | 2.1 (1.2–3.8) | 0.02 | 1.7 (0.9–3.1) | 0.08 | ||
| Third quintile | 334 | 43 (12.9%) | 2.7 (1.5–4.9) | 0.001 | 1.8 (1.0–3.2) | 0.06 | ||
| Fourth quintile | 339 | 50 (14.7%) | 3.2 (1.8–5.7) | <0.0001 | 2.1 (1.2–3.8) | 0.01 | ||
| Fifth quintile | 343 | 101 (29.4%) | 7.0 (4.1–12.0) | <0.0001 | 3.6 (2.0–6.4) | <0.0001 | ||
⁎ Cox models were adjusted for age, gender, previous infarction, previous heart failure, history of diabetes, hypertension, smoking status, serum creatinine, anterior location of infarction, ST-elevation infarction, Killip class at admission, thrombolytic therapy, primary angioplasty, coronary revascularization during hospital course, medical therapy (antiplatelet agents, β blockers, angiotensin-converting-enzyme inhibitors, and statins), LVEF, baseline hemoglobin, and MCV.
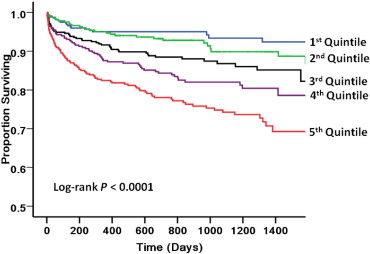
There was a moderate correlation between admission and predischarge RDW (Spearman rho 0.77, p <0.0001). We categorized the patients into 4 groups based on whether RDW was within the normal range at baseline and before discharge (n = 1,333, 78.0%), increased at baseline but normal at discharge (n = 63, 3.7%), normal at baseline and increased at discharge (n = 86, 5.0%), or increased at the 2 time points (n = 227, 13.3%).
The effect of changes in RDW during hospital course on patient outcome after hospital discharge is depicted in Figure 2 . Patients with normal RDW at the 2 time points had the best outcome. There was a marked increase in mortality after hospital discharge in patients in whom RDW became abnormally increased during hospital course. Patients with increased RDW at baseline and normal RDW at discharge had an intermediate outcome.