Short-sleep and long-sleep duration are associated with prevalent hypertension, poor cardiovascular health, and mortality. The relation of sleep hours with increased left ventricular (LV) mass, a strong correlate of elevated blood pressure (BP) values, is not established. We conducted a cross-sectional analysis among the participants of the population-based Cardiovascular Abnormalities and Brain Lesions study. LV mass was estimated by transthoracic echocardiography. Sleep duration was assessed by reported hours of sleep on a diary kept during 24-hour BP monitoring. Multivariate linear regression models were constructed to assess the relation between sleep hours and LV mass index (LV mass divided by body surface area). Analysis of sleep hour categories (short and long sleep) was performed. Among 756 participants (mean age 71 ± 9 years, 60% women, and 71% Hispanics), the mean sleep duration was 8.6 ± 1.8 hours, and LV mass index was 103 ± 26 g/m 2 . A J-shaped relation between sleep hours squared and LV mass index was observed adjusting for demographics and cardiovascular risk factors. Categorical analysis showed an association between long-sleep duration (>11 hours) and LV mass index (β = 7.4; p = 0.013). Long sleepers had higher diurnal systolic BP (p = 0.012) and nocturnal systolic BP (p <0.001) compared with the reference group. A great part of the variance between sleep duration and LV mass was explained by 24-hour systolic BP (β = 0.45; p <0.0001). In conclusion, self-reported long-sleep duration was associated with increased LV mass. Higher systolic BP, especially nocturnal, may account for part of the observed association.
Increased left ventricular (LV) mass, usually measured with transthoracic echocardiography, is associated with stroke and increased mortality. Reduction of LV mass in patients with hypertension and LV hypertrophy has been shown to decrease cardiovascular morbidity. The relation of sleep hours with LV mass, a strong correlate of elevated blood pressure (BP) values, is not established. The aim of our study was to evaluate the relation between sleep hours and LV mass in a multiethnic elderly cohort and to assess the effect of BP values on this relation.
Methods
The population of this study was derived from the Cardiovascular Abnormalities and Brain Lesion (CABL) study, an ancillary study to the Northern Manhattan Study (NOMAS). The NOMAS cohort of 3,298 stroke-free participants was randomly sampled from the northern Manhattan population as previously described. Subjects from the NOMAS who were >50 years old, were willing to participate, and had no contraindications underwent a brain magnetic resonance imaging study and an extensive transthoracic echocardiography evaluation as part of CABL. For the purpose of this analysis, we included participants with simultaneous measures of self-reported sleep hours (obtained from a diary kept during 24-hour BP monitoring) and LV mass. A total of 1,004 participants were enrolled in CABL; 169 of them refused BP monitoring or could not complete it. Of the remaining 835, 75 were excluded because of incomplete information on sleep hours or echocardiographic measures and 4 were excluded because of at least moderate valvular lesions on echocardiogram. The remaining 756 participants constitute the present study population. Both CABL and NOMAS were approved by the Columbia University Medical Center Institutional Board Review and the University of Miami Institutional Board Review. All participants gave written informed consent.
Data were collected through interviews by trained bilingual (English and Spanish) research assistants using standardized data collection instruments. Race and ethnicity were defined by self-identification according to questions modeled after the United States census and categorized into mutually exclusive groups (Black, White, and Hispanic). Educational level was used as an indicator of socioeconomic status (SES) and classified into 2 categories: “less than high school” and “completed high school.” Obesity was defined by a body mass index of ≥30 kg/m 2 . Hypertension was defined as a systolic BP of >140 mm Hg or a diastolic BP of >90 mm Hg (average of 2 measurements obtained in sitting position) or use of antihypertensive medications. Diabetes mellitus was defined as fasting blood glucose of ≥126 mg/dl, the patient’s self-report of diabetes, use of insulin, or hypoglycemic medications. Cigarette smoking was defined by history (ever or never). Hypercholesterolemia was defined as the total serum cholesterol of >240 mg/dl, a subject self-report of hypercholesterolemia, or use of lipid-lowering medications. Renal disease was defined as a creatinine of >1.5 mg/dl. Cardiac disease included angina pectoris, myocardial infarction, coronary artery disease, atrial fibrillation, or heart failure. Depressive symptoms were evaluated with the Center for Epidemiological Studies Depression scale, a 20-item scale assessing depressive affect, somatic complaints, positive affect, and interpersonal relations. The Center for Epidemiological Studies Depression scale scores range from 0 to 60, with greater scores indicating symptoms of depression. Depressive symptoms were considered present if the sum of the Center for Epidemiological Studies Depression scale scores was ≥16.
Sleep hours were determined using subject-entered diary reports of sleep and wake times during the 24-hour ambulatory BP monitoring, conducted as the participants performed their normal activities. Transthoracic echocardiography was performed using a commercially available system (iE 33, Philips, Andover, Massachusetts) by a trained, registered cardiac sonographer according to a standardized protocol. Measurements were taken from standard 2-dimensional images according to the guidelines of the American Society of Echocardiography. LV mass was calculated with the use of the corrected American Society of Echocardiography method: 0.8 × (1.04 × [(VS + LV diastolic dimension + PWT) 3 −(LV diastolic dimension) 3 ] + 0.6) 0.8. LV mass was then indexed by body surface area.
Ambulatory BP monitoring was performed with a commercially available BP monitor (SpaceLabs 90207, Williams Medical Supplies Ltd., Rhymney, South Wales, United Kingdom), calibrated against a reference mercury sphygmomanometer. Participants were asked to keep their usual daily activities during monitoring and to note them on a diary together with the waking and the sleeping time. Ambulatory BP monitoring was performed with a BP cuff appropriately sized to arm circumference on the nondominant arm. BP was recorded automatically every 15 minutes during awake hours and every 30 minutes during sleeping hours for a total of 24 hours. The variables obtained were (1) Nighttime systolic BP and diastolic BP (average of sleeping measurements), (2) daytime systolic BP and diastolic BP (average of awake measurements), and (3) nondipping status (failure of BP values to decrease by ≥10% during sleep).
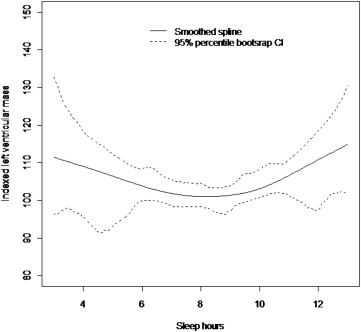
Data are presented as mean ± SD for continuous variables and as proportions for categorical variables. The chi-square test was used to compare proportions. Analysis of variance was performed to test mean differences between groups. Univariate and multivariate linear regression were used to analyze the association between sleep hours and indexed LV mass. The variables included in the models either had a univariate association to LV mass or are known predictors of increased LV mass. The models were sequentially adjusted for age at echocardiography, gender, race-ethnicity, and education (model 1), and vascular risk factors such as hypertension, diabetes, hypercholesterolemia, waist circumference, body mass index, and renal and cardiac disease (model 2). To evaluate the effect of BP values on the relation between sleep hours and LV mass, we further adjusted for mean 24-hour systolic BP (model 3) and for mean 24-hour diastolic BP (model 4). After analysis of sleep hours as a continuous variable, a quadratic term for sleep hours was included for each of the above models to evaluate the possibility of a nonlinear relation between reported sleep hours and LV mass index. We then categorized sleep hours into 3 prespecified groups (short, long, and reference), which have been associated with increased cardiovascular disease and mortality. Short sleep was defined as <6 hours and long sleep as ≥11 hours, whereas 6 to 10:59 hours was the reference to evaluate the extremes of the U-shaped distribution in our sample. We compared LV mass amongst these 3 sleep duration categories. We also performed a sensitivity analysis and divided the reference group into 2 smaller categories of 6 to 8:29 hours and 8:30 to 10:59 hours and compared them with <6 hours for the prediction of indexed LV mass. We observed similar relations of these categories, 6 to 8:29 hours (p = 0.002) and 8:30 to 10:59 hours (p = 0.003) with indexed LV mass and therefore used the broader category (6 to 10:59 hours) in all subsequent analyses. Secondary analysis to further explore the relation between sleep hours and LV mass was done by including interaction terms for age, gender, race-ethnicity, and cardiovascular risk factors in the multivariate models predicting LV mass. The 95% confidence interval of smoothed spline was obtained by the method of percentile bootstrap confidence interval using 1,000 bootstrap samples in R. All analyses were carried out using SAS software version 9.2 (SAS Institute Inc., Cary, North Carolina).
Results
Of 756 participants (mean age 71 ± 9 years, 60% women, and 71% Hispanics), most had hypertension (71%) and hypercholesterolemia (63%). The mean sleep duration was 8.6 ± 1.8 hours and mean indexed LV mass was 103 ± 26 g/m 2 ( Table 1 ).
| Characteristics | n = 756 |
|---|---|
| Age (yrs) | 71 ± 9 |
| Women (%) | 454 (60) |
| Black (%) | 119 (16) |
| Hispanic (%) | 538 (71) |
| White (%) | 99 (13) |
| High school education (%) | 337 (45) |
| Waist circumference (cm) | 38 ± 5 |
| Hypertension (%) | 532 (70) |
| Diabetes mellitus (%) | 218 (29) |
| Cigarette smoker (ever, %) | 405 (54) |
| Hypercholesterolemia (%) | 472 (63) |
| Depressive symptoms (%) | 116 (16) |
| Sleep hours | 8.6 ± 1.8 |
| LV mass (index, g/m 2 ) | 103 ± 25 |
The covariates that were associated with LV mass index were age (β = 0.46; p <0.0001), male gender (β = 5.8; p = 0.0022), waist circumference (β = 0.4; p <0.05), hypertension (β = 12.2; p <0.0001), and diabetes (β = 5.21; p = 0.0109), whereas depressive symptoms, alcohol consumption, body mass index, and cigarette smoking were not. Subjects who had education greater than high school (β = −4.3; p <0.0001) had significantly less LV mass index. There was no significant race-ethnic difference in LV mass index (data not shown).
Table 2 lists the distribution of demographics, risk factors, and mean BP values across categories of sleep duration. Eleven percent of the cohort reported ≥11 hours, whereas 6 percent reported <6 hours of sleep. There was a greater frequency of Hispanics, subjects with lower than high school education, and hypertensive subjects among long sleepers. There was no difference in the frequency of diabetes, obesity, and waist circumference among the sleep duration groups. Long sleepers (≥11 hours) had higher mean systolic BP during the day, with an even more pronounced difference at night than the reference group. In addition, long sleepers had an increased frequency of nocturnal “nondipping” of BP compared with the reference. There were no differences in diastolic BP between long sleepers and the reference. In addition, long sleepers had greater mean LV mass index.
| Variable | Sleep Hours | ||
|---|---|---|---|
| <6 48 (6%) | 6 to 10:59 628 (83%) | ≥11 80 (11%) | |
| Women | 25 (6) | 380 (84) | 49 (10) |
| White | 11 (11) | 82 (81) | 7 (7) |
| Black | 12 (10) | 100 (84) | 7 (6) |
| Hispanic ∗ | 25 (5) | 450 (83) | 66 (12) |
| Less than high school ∗ | 18 (4) | 341 (82) | 59 (14) |
| Hypertension † | 41 (8) | 431 (81) | 60 (11) |
| Diabetes | 12 (6) | 177 (81) | 29 (13) |
| Hypercholesterolemia † | 27 (6) | 384 (81) | 61 (13) |
| Ever smoker † | 32 (8) | 339 (84) | 34 (8) |
| Waist (cm) | 38 ± 4 | 38 ± 5 | 38 ± 5 |
| Obesity (BMI ≥30 kg/m 2 ) | 13 (6) | 192 (81) | 31 (13) |
| Serum creatinine >1.5 mg/dl † | 5 (23) | 15 (68) | 2 (9) |
| Daytime systolic BP † | 130 ± 13 | 128 ± 14 | 132 ± 16 |
| Nighttime systolic BP ∗ | 121 ± 16 | 118 ± 16 | 124 ± 17 |
| Daytime diastolic BP | 77 ± 9 | 74 ± 9 | 74 ± 10 |
| Nighttime diastolic BP | 68 ± 11 | 66 ± 9 | 68 ± 9 |
| 24-mean systolic BP | 128 ± 13 | 124 ± 14 | 128 ± 15 |
| 24-mean diastolic BP | 75 ± 9 | 71 ± 8 | 71 ± 9 |
| BP nondipping status †,‡ | 30 (6) | 383 (81) | 58 (12) |
| LV mass index (g/m 2 ) ∗ | 110 ± 26 | 102 ± 27 | 111 ± 28 |
In univariate analysis, sleep hours as a continuous variable did not show a linear relation with LV mass index, but a nonlinear J-shaped relation was found between sleep hours squared and LV mass index (β = 0.7; p = 0.002), ( Figure 1 ). Table 3 lists multivariate models adjusted for demographics (model 1) and cardiovascular risk factors (model 2). Categorical analysis showed that short-sleep duration (<6 hours) was associated with LV mass index after adjusting for demographic factors. This association did not persist in models adjusted for cardiovascular risk factors. A positive association between reported long-sleep duration and LV mass index was seen in the model adjusted for demographics and cardiovascular risk factors. When continuous 24-hour mean systolic BP was included in the analysis (model 3), no significant association was seen between sleep hours and LV mass index, with the majority of the variance of LV mass explained by 24-hour mean systolic BP (β = 0.45; p <0.0001). In model 4, the 24-hour mean diastolic BP attenuated but did not eliminate the overall association between sleep hours and LV mass index. Secondary analysis showed an interaction between hypertension and sleep hours squared (β = 0.99; p = 0.044) on LV mass index. We further explored the relation between morning systolic and diastolic BP surges and sleep hours, but did not observe an association between these measures. There was no interaction between sleep hours squared and age, gender, or cardiovascular risk factors (data not shown).