Epicardial adipose tissue (EAT) has been linked to coronary artery calcium deposits and atherosclerotic disease. Mitral annular (MAC) and aortic valve calcium (AVC) have also been associated with atherosclerosis. This study examined the possible relation between EAT thickness and valvular calcium deposits. We included 294 patients aged ≥65 years who had noncontrast computed tomography scans of the chest. Mean age was 76 ± 7 years; 47% were men. Using reconstructed images, EAT thickness was measured at various locations. MAC and AVC were quantified by Agatston technique. The sum of AVC and MAC was reported as the grand total score (GTS). Subjects were divided into 2 groups based on the value of GTS; GTS = 0, no cardiac calcification and GTS ≥1, cardiac calcification group. Epicardial fat (left and right atrioventricular grooves and superior interventricular groove) was significantly greater in the cardiac calcification group compared with the no cardiac calcification (all values, p <0.05). After adjusting for clinical variables including BMI, EAT at the superior interventricular groove remained significantly associated with total calcium. Left atrioventricular groove EAT demonstrated a trend toward an association with total calcium, but this did not reach statistical significance. In conclusion, epicardial fat is associated with calcium deposits of the mitral annulus and aortic valve.
Epicardial adipose tissue (EAT) is visceral fat deposited around the heart. It is usually concentrated in the atrioventricular and interventricular grooves and along the branches of the major coronary arteries. Epicardial fat is anatomically contiguous with the myocardium, and several studies have shown paracrine or vasocrine secretion of adipokines into the myocardium and coronary arteries. Under physiological conditions, EAT serves as an energy source for the myocardium and a provider of anti-inflammatory and antiatherogenic mediators. However, under pathological circumstances or when there is excess fat, EAT appears to play a role in atherogenesis and the development of cardiometabolic disease. This is considered to be mediated through expression of inflammatory cytokines such as tumor necrosis factor-alpha (TNF-α), interleukin (IL)-6, IL-1B, and monocyte chemoattractant protein-1 (MCP-1). In addition, EAT has been associated with insulin resistance, cardiac sympathetic denervation, presence and severity of coronary artery disease (CAD), and the presence of coronary calcium deposits. In contrast, it is known that mitral annular calcification (MAC) and aortic valve calcification (AVC) share risk factors associated with atherosclerosis. Histopathologic studies of cardiac valves demonstrate lesions similar to atherosclerotic plaques with accumulation of atherogenic and inflammatory molecules. As the disease progresses, cardiac valves express markers of osteoblastic activity similar to those of normal osteogenesis. Clinically, MAC is associated with increased risk of stroke, atherosclerosis, and cardiac conduction defects. In addition, MAC and AVC are independently associated with coronary events and all-cause mortality. To our knowledge, only one study examined the relation between EAT and aortic valve calcium using echocardiography. We sought to assess this association by measuring aortic valve and mitral annuls calcium using computed tomography (CT).
Methods
A cross-sectional study of 319 patients with a noncontrast axial chest CT scan was performed from August 2012 to June 2013 for clinical indications in subjects aged ≥65 years. Exclusion criteria included (1) poor image quality related to motion artifact (16 subjects); (2) incomplete clinical information (7 subjects); and (3) mitral/aortic valve surgery (2 subjects). We included 294 subjects in the analyses.
Demographic and clinical data were obtained, including age, gender, race, BMI, a history of CAD, congestive heart failure, hypertension (HTN), hyperlipidemia, chronic kidney disease including baseline creatinine, diabetes mellitus, and smoking status. The estimated glomerular filtration rate was then calculated using the Modification of Diet in Renal Disease formula. The study was approved by the Institutional Review Board of the Albert Einstein Healthcare Network.
Indications for chest CT included the evaluation of thoracic or extrathoracic tumors (n = 142), diseases of the lung parenchyma (n = 106), pleural effusions (n = 18), preoperative (n = 17), or posttraumatic evaluation (n = 11).
Subjects underwent CT scans performed using Brilliance iCT (Philips Healthcare, Cleveland, Ohio) or LightSpeed VCT (General Electric Healthcare, Milwaukee, Wisconsin) scanners. Thin CT slices ranging from 0.62 to 1.25 mm were retrieved from a “Synapse PACS” system (Fujifilm Medical Systems USA, Stamford, Connecticut). Multiplanar reconstructions of cardiac planes were created using an “IntelliSpace 3D” workstation (Philips Healthcare, Cleveland, Ohio). The effective doses from the CT scans ranged from 4.6 to 8.3 mSv with an average effective dose of 6.9 mSv.
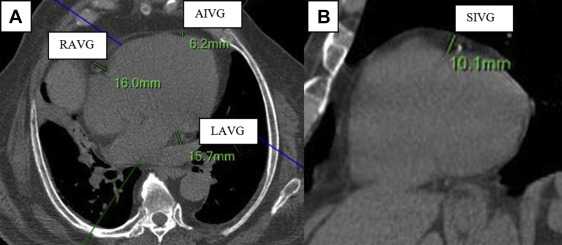
To measure EAT thickness, we used a modification to the protocol used by Abbara et al ( Figure 1 ). We measured EAT thickness on the parasternal short-axis plane at the superior interventricular groove (SIVG). On the horizontal long-axis plane, EAT thickness was measured at the left atrioventricular groove (LAVG), right atrioventricular groove (RAVG), and the anterior interventricular groove. EAT thickness was measured as the adipose tissue between the epicardium and parietal pericardium. All measurements were made by one reader with an intraobserver and interobserver reproducibility of r = 0.92 and r = 0.90, respectively (both; p <0.001).
To analyze mitral annular calcium deposits, we reconstructed a plane perpendicular to the 4-chamber view, running through the right and left atrioventricular grooves ( Figure 2 ). The mitral annulus was identified in the resulting coronal plane by locating surrounding landmarks (aortic root and left ventricle) thus guiding the reader to the proper mitral annular orientation ( Figure 2 ). For purposes of this analysis, the mitral annulus was considered to extend 3 to 5 mm above and below the atrioventricular groove.
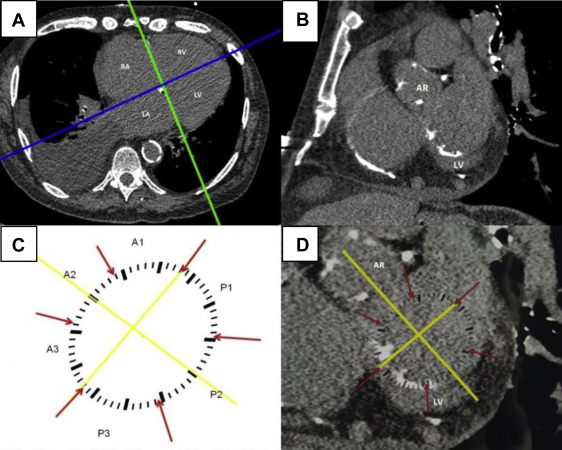
Using CT scan images, we created a schematic template of the mitral annulus ( Figure 2 ). The template was arbitrarily divided into 3 anterior and 3 posterior segments according to Carpentier’s nomenclature, designating P1, P2, and P3 as the lateral posterior, central, and medial segment, respectively. The anterior leaflet was divided into segments A1, A2, and A3, corresponding to the adjacent regions of the posterior leaflet. A line was drawn between the mitral valve commissures (intercommissural axis) dividing the anterior and posterior segments. A further line running through the middle of the aortic valve and the middle of the P2 portion of the mitral annulus was added. This subsequently allowed precise alignment of the template over the mitral annulus with correct orientation relative to the aortic valve. The template was then manually applied to the monitor screen and image magnification was adjusted to allow a proper fit ( Figure 2 ).
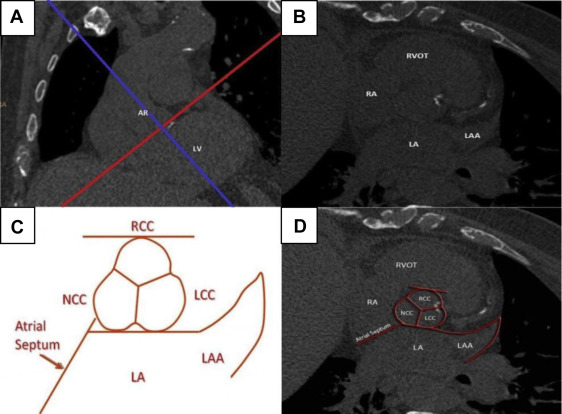
To measure calcium deposits on the aortic valve, we defined 3 major orthogonal planes using the same 3D software (Philips Healthcare, Amsterdam, the Netherlands). The oblique plane across the aortic valve annulus was selected using coronal reconstructions ( Figure 3 ). The typical shape of the aortic root with the contours of 3 coronary cusps as well as surrounding landmarks (left atrium, left atrial appendage, and atrial septum) were recognized on this oblique transverse reconstruction ( Figure 3 ). The area from the attachment of cusps to the coronary ostia was marked and analyzed. For the aortic valve template ( Figure 3 ), the left, right, and noncoronary cusps were depicted in their proper anatomical relation with surrounding cardiac structures.
Calcium deposits were defined as focal conglomerates of high radiographic density (≥100 Hounsfield units [HUs]). We assigned the location of calcium deposits using the respective templates. Agatston score in arbitrary units (AUs) was calculated separately for each segment using Heartbeat CS software (Philips Healthcare, Cleveland, Ohio). We designated the grand total score (GTS) to be the sum of the Agatston score for the mitral annulus and aortic valve. Subjects were stratified into groups based on the presence or absence of any degree of calcium deposits. Patients with a GTS of 0 were assigned to the no-calcium group and those with a score greater or equal to 1 were assigned to the calcium group. Subjects were further stratified into MAC (MAC ≥1) versus no-MAC (MAC = 0) and AVC (AVC ≥1) versus no-AVC (AVC = 0) groups. All CT scans were analyzed by one reader. The intraobserver and interobserver reproducibility for calcium measurements was excellent ( r = 0.98 and r = 0.97, respectively, p <0.001 for both).
Data are presented as mean ± SD for continuous variables and as numbers and percentage for categorical variables. To assess the relation between calcium depositions and EAT we performed Spearman nonparametric correlations between total, aortic, and mitral calcium deposit scores and EAT in different locations as described previously. Using standard statistical tests, we then compared calcium versus no-calcium across different EAT locations to assess if calcium was dependent on EAT. Similar analyses were carried out after dividing the total subjects first into MAC versus no-MAC groups then into AVC versus no-AVC groups. We then performed multivariate and logistic regression to adjust for clinical variables including BMI and to assess the independent relation between EAT and calcium deposits. Two-tailed p values <0.05 were considered significant. JMP 11 statistical software (SAS, Cary, North Carolina) was used for analyses.
Results
The mean age of our subjects was 76 ± 7 years with 139 male participants (47%) and 173 Caucasian subjects (59%). The average BMI of all patients was 26.9 ± 5.9 kg/m 2 . Aortic valve calcification was present in 151 of patients (51.3%), whereas 130 (44.2%) had some degree of mitral annular calcification. The rest of the clinical characteristics of the subjects are outlined in Table 1 . Median total MAC was 0 AU (IQR 25%–75% 0 to 71 AU), median total AVC was 0.43 AU (IQR 25%–75% 0 to 143.6 AU), and median GTS was 48.96 AU (IQR 25%–75% 0 to 339.6 AU).
| Variable | Number (n=294) |
|---|---|
| Age (years) | 76 ± 7 |
| Men | 139 (47.3%) |
| White | 173 (58.8%) |
| Black | 87 (29.6%) |
| Other | 34 (11.5%) |
| Hypertension | 192 (71%) |
| Diabetes mellitus | 76 (28%) |
| Chronic kidney disease | 45 (16.6%) |
| Smokers | 37 (12.5%) |
| Hyperlipidemia ∗ | 136 (52.7%) |
| Coronary artery disease † | 90 (33.3%) |
| Heart failure | 50 (18.7%) |
| Creatinine (mg/dl) | 1.18 ± 0.6 |
| Glomerular filtration rate (ml/min/1.73 m 2 ) | 72.4 ± 33.3 |
| Body mass index (Kg/m 2 ) | 26.9 ± 5.9 |
Stay updated, free articles. Join our Telegram channel

Full access? Get Clinical Tree


