Exercise training (ET) in patients with heart failure (HF), as demonstrated in the Heart Failure: A Controlled Trial Investigating Outcomes of Exercise TraiNing (HF-ACTION), was associated with improved exercise tolerance and health status and a trend toward reduced mortality or hospitalization. The present analysis of the HF-ACTION cohort examined the effect of ET in overweight and obese subjects compared to normal weight subjects with HF. Of 2,331 subjects with systolic HF randomized to aerobic ET versus usual care in the HF-ACTION, 2,314 were analyzed to determine the effect of ET on all-cause mortality, hospitalizations, exercise parameters, quality of life, and body weight changes by subgroups of body mass index (BMI). The strata included normal weight (BMI 18.5 to 24.9 kg/m 2 ), overweight (BMI 25.0 to 29.9 kg/m 2 ), obese I (BMI 30 to 34.9 kg/m 2 ), obese II (BMI 35 to 39.9 kg/m 2 ), and obese III (BMI ≥40 kg/m 2 ). At enrollment, 19.4% of subjects were normal weight, 31.3% were overweight, and 49.4% were obese. A greater BMI was associated with a nonsignificant increase in all-cause mortality or hospitalization. ET was associated with nonsignificant reductions in all-cause mortality and hospitalization in each weight category (hazard ratio 0.98, 0.95, 0.92, 0.89, and 0.86 in the normal weight, overweight, obese I, obese II, and obese III categories, respectively; all p >0.05). Modeled improvement in exercise capacity (peak oxygen consumption) and quality of life in the ET group was seen in all BMI categories. In conclusion, aerobic ET in subjects with HF was associated with a nonsignificant trend toward decreased mortality and hospitalization and a significant improvement in quality of life across the range of BMI categories.
In patients with heart failure (HF), an increased body mass index (BMI) has been associated with a lower quality of life and lower exercise tolerance, as measured by peak oxygen consumption (PKVO 2 ). However, contrary to expectations, an increased BMI has been associated with improved, rather than impaired, outcomes in a broad range of HF; this has been termed the “obesity paradox.” The overall results from the Heart Failure: A Controlled Trial Investigating Outcomes of Exercise TraiNing (HF-ACTION) demonstrated that aerobic exercise training (ET) in patients with systolic HF was associated with a nonsignificant trend toward a reduction in mortality or hospitalization and a substantial improvement in health status. The present report examines whether overweight and obese patients with HF in the HF-ACTION derived differential benefit from ET in terms of health status and clinical outcomes.
Methods
The HF-ACTION was a multicenter, randomized trial (1:1) of ET versus usual care in patients with left ventricular systolic dysfunction and symptomatic HF. (HF-ACTION is registered with ClinicalTrials.gov , study number NCT00047437 .) The inclusion criteria were left ventricular ejection fraction ≤35%, New York Heart Association class II-IV symptoms, stable, optimal medical therapy for 6 weeks before randomization, and an ability to exercise. The BMI recorded at baseline was available for 2,324 of 2,331 subjects. The subjects were divided into categories according to their BMI, as defined by the International Obesity Taskforce: underweight (BMI <18.5 kg/m 2 ), normal weight (BMI 18.5 to 24.9 kg/m 2 ), overweight (BMI 25.0 to 29.9 kg/m 2 ), obese I (BMI 30 to 34.9 kg/m 2 ), obese II (BMI 35 to 39.9 kg/m 2 ), and obese III (BMI ≥40 kg/m 2 ). Because only 10 subjects were in the underweight category, those subjects were excluded from the analysis, leaving a final study cohort of 2,314.
The HF-ACTION study subjects underwent baseline cardiopulmonary exercise testing (CPX) before randomization. The primary method used for exercise testing was a modified Naughton treadmill protocol. For patients unable to exercise on a treadmill, or at certain sites, a cycle ergometer was used (20 W/2 min stage or 10 W/min ramp). At most sites, the respiratory gas exchange was recorded during exercise testing, in addition to the blood pressure and continuous electrocardiographic recordings. All patients were strongly encouraged to exercise to a sign and symptom-limited maximum exertion. Multiple physiologic variables obtained using CPX testing were determined, including PKVO 2 , anaerobic threshold, and the slope of the ventilation to carbon dioxide output, maximum heart rate, and exercise time. PKVO 2 is defined as the oxygen uptake at peak exercise and can be described as an absolute value (ml/min) or relative to the body weight (ml/kg/min). The ventilatory-derived anaerobic threshold, the oxygen consumption at which ventilation increases disproportionately relative to oxygen consumption and work, also known as the lactate threshold, was determined using the modified v-slope method by 2 blinded reviewers (ml/kg/min). The slope of ventilation to carbon dioxide output, is the most widely studied index of ventilatory efficiency. Furthermore, 6-minute walk tests were performed at baseline to determine the submaximal exercise capacity (meters). All CPX data were analyzed by a core laboratory.
Patients randomized to ET initially participated in supervised group exercise sessions 3 times/week for 3 months. The primary training mode was walking, treadmill, or stationary bicycle. The patients transitioned to home exercise with study-provided equipment after 36 group sessions, with a goal of exercising 5 times/week for 40 minutes. The patients in the usual care group were advised to exercise at a moderate pace for 30 minutes on most days but did not participate in the supervised training.
The primary end point of the present analysis was the primary end point of the HF-ACTION, a composite of all-cause mortality and all-cause hospitalization. The secondary end points analyzed were all-cause mortality and cardiovascular death or cardiovascular hospitalization. The other end points assessed in the present analysis were changes in the 6-minute walk distance (in meters), PKVO 2 , duration of exercise (in minutes) on CPX, quality of life, as assessed by the Kansas City Cardiomyopathy Questionnaire, and weight (in kilograms).
The baseline demographic data, clinical data, and CPX data were analyzed by BMI category. Data are expressed as median and interquartile range or a percentage of the total. The relation between the continuous variables and continuous BMI was assessed using linear regression analysis, and the relation between categorical variables and BMI was assessed using logistic regression analysis. Kaplan-Meier survival plots were analyzed by BMI category. Cox proportional hazards models were used to estimate the relation between BMI and the primary and secondary end points of the trial. The model for the primary end point tested for interactions between BMI and treatment group. A multivariate Cox model that included >50 candidate predictor variables was constructed for the primary end point. The final set of predictors of the primary end point was objectively selected using a stepwise variable selection using a bootstrap-backward selection process. Multiple imputation was used to replace missing data for the covariates. A relation was found between the baseline BMI and missing data in CPX, quality of life, and weight variables. Because it was likely that the data were not missing at random, a mixed model approach was also used to compare the change in CPX, quality of life, and weight variables to the BMI and treatment groups. Statistical analyses were performed using SAS (SAS Institute, Cary, North Carolina). All statistical tests were 2-tailed, with statistical significance at 0.05.
Results
The baseline characteristics and baseline exercise variables of the study cohort stratified by BMI category are listed in Table 1 . An increased BMI was associated with greater absolute PKVO 2 (ml/min) but lower relative PKVO 2 (ml/kg/min). The slope of ventilation to carbon dioxide output, CPX exercise time, and 6-minute walk distance all decreased with increasing BMI category.
| Variable | BMI (kg/m 2 ) | p Value ⁎ | ||||
|---|---|---|---|---|---|---|
| 18.5–24.9 (n = 448) | 25.0–29.9 (n = 724) | 30.0–34.9 (n = 551) | 35.0–39.9 (n = 330) | ≥40 (n = 261) | ||
| Randomized to exercise training (n) | 226 | 350 | 289 | 158 | 129 | — |
| Age (years) | 64 (55–74) | 63 (54–70) | 59 (51–67) | 56 (49–62) | 50 (40–57) | <0.0001 |
| Women | 32% | 22% | 27% | 32% | 37% | 0.003 |
| Race | <0.0001 | |||||
| Black | 29% | 25% | 31% | 40% | 57% | |
| White | 65% | 69% | 65% | 55% | 39% | |
| Other | 6% | 6% | 4% | 5% | 4% | |
| Hispanic | 4% | 3% | 4% | 4% | 4% | 0.89 |
| Ischemic etiology | 52% | 60% | 57% | 44% | 25% | <0.0001 |
| Previous myocardial infarction | 44% | 50% | 45% | 35% | 20% | <0.0001 |
| Hypertension (history) | 50% | 56% | 65% | 67% | 71% | <0.0001 |
| Diabetes mellitus | 19% | 28% | 37% | 39% | 49% | <0.0001 |
| Smoking status | 0.0084 | |||||
| Never | 39% | 33% | 36% | 38% | 50% | |
| Current | 21% | 18% | 15% | 13% | 15% | |
| Past | 40% | 50% | 49% | 49% | 36% | |
| New York Heart Association class II/III-IV | 63%/37% | 70%/30% | 63%/37% | 62%/38% | 51%/49% | <0.0001 |
| Left ventricular ejection fraction (%) | 24 (20–30) | 25 (20–30) | 25 (21–30) | 25 (20–30) | 25 (20–30) | 0.68 |
| Atrial fibrillation or atrial flutter | 21% | 23% | 21% | 21% | 15% | 0.013 |
| Systolic blood pressure (mm Hg) | 110 (98–120) | 110 (100–128) | 112 (100–128) | 112 (102–122) | 116 (104–130) | <0.0001 |
| Diastolic blood pressure (mm Hg) | 68 (60.73) | 70 (60–78) | 70 (61–80) | 70 (64–80) | 74 (66–82) | <0.0001 |
| Heart rate at rest (beats/min) | 69 (61.77) | 69 (61–76) | 71 (63–79) | 72 (64–80) | 75 (67–84) | <0.0001 |
| Sodium (mmol/L) | 139 (137–141) | 139 (137–141) | 139 (137–141) | 139 (137–141) | 139 (137–141) | 0.092 |
| Creatinine (mg/dl) | 1.2 (1.0–1.5) | 1.2 (1.0–1.5) | 1.2 (1.0–1.5) | 1.2 (1.0–1.4) | 1.1 (0.9–1.3) | 0.005 |
| Blood urea nitrogen (mg/dl) | 21 (16–29) | 21 (16–28) | 21 (16–28) | 19 (14–27) | 19 (14–26) | 0.0007 |
| Angiotensin-converting enzyme inhibitor/angiotensin II receptor blocker | 93% | 94% | 94% | 6% | 94% | 0.14 |
| β Blocker | 94% | 93% | 96% | 97% | 96% | 0.09 |
| Aldosterone antagonist | 42% | 43% | 42% | 49% | 56% | <0.0001 |
| Loop diuretic | 74% | 73% | 80% | 84% | 87% | <0.0001 |
| Digoxin | 47% | 44% | 44% | 47% | 43% | 0.52 |
| Implantable cardioverter-defibrillator | 41% | 43% | 41% | 40% | 30% | 0.0007 |
| Cardiac resychronization therapy | 18% | 20% | 19% | 17% | 13% | 0.031 |
| Beck Depression Inventory II | 7 (4–13) | 8 (4–13) | 8 (5–15) | 10 (5–17) | 10 (6–17) | <0.0001 |
| Kansas City Cardiomyopathy questionnaire overall summary score | 72 (55–88) | 72 (55–86) | 66 (50–82) | 61 (47–80) | 60 (43–76) | <0.0001 |
| Cardiopulmonary exercise testing variables | ||||||
| Peak oxygen consumption (ml/kg/min) | 14.4 (11.6–18.0) | 15.1 (12.4–18.4) | 15.0 (11.2–17.8) | 13.9 (11.3–16.6) | 12.4 (10.1–15.9) | <0.0001 |
| Peak oxygen consumption (ml/min) | 954 (773–1208) | 1,271 (985–1565) | 1,430 (1,077–1,760) | 1,520 (1,231–1,865) | 1,661 (1,277–2,115) | <0.0001 |
| Slope of ventilation to carbon dioxide output ratio | 36 (30–43) | 33 (29–39) | 32 (29–37) | 30 (27–35) | 29 (25–34) | <0.0001 |
| Exercise duration (min) | 9.4 (6.7–12.0) | 10.3 (7.9–13.0) | 9.8 (7.1–12.0) | 9.1 (6.7–11.6) | 8.0 (5.7–10.3) | <0.0001 |
| 6-Minute walk distance (m) | 366 (296–430) | 387 (317–446) | 372 (297–443) | 362 (294–426) | 335 (274–407) | <0.0001 |
| Respiratory exchange ratio >1.1 | 47% | 48% | 43% | 37% | 32% | <0.0001 |
| Heart rate at peak exercise (beats/min) | 115 (98–131) | 119 (105–132) | 120 (103–133) | 122 (108–136) | 123 (111–141) | <0.0001 |
⁎ p Value by linear regression analysis for all continuous variables correlated with BMI as continuous variable; p value by logistic regression analysis for all categorical variables correlated with BMI as continuous variable.
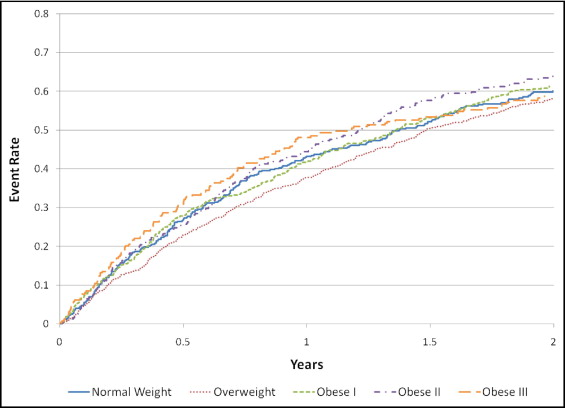
In the present study cohort, 1,539 subjects had a primary end point event. Continuous BMI was not a significant predictor of the primary outcome of all-cause mortality or hospitalization (relative risk 1.004, 95% confidence interval 0.997 to 1.011, p = 0.24). Even after adjustment for treatment category (ET vs usual care) and additional explanatory variables, continuous baseline BMI was not associated with the primary end point (BMI, p = 0.45; ET, p = 0.80; interaction p = 0.91). Kaplan-Meier survival plots for the BMI categories are shown in Figure 1 .
The effects of ET on the primary and secondary end points after stratification by BMI category are listed in Table 2 . ET was associated with a nonsignificant trend toward a reduction in events in the overall cohort and in each BMI category for all end points. Although, for each end point, the hazard ratios associated with treatment tended to decrease with increasing BMI category, the relation was not statistically significant.
| Variable | BMI (kg/m 2 ) | ||||
|---|---|---|---|---|---|
| 18.5–24.9 | 25.0–29.9 | 30.0–34.9 | 35.0–39.9 | ≥40 | |
| Primary end point | |||||
| Exercise event rate ⁎ | 42% | 40% | 39% | 43% | 46% |
| Usual care event rate | 44% | 35% | 44% | 46% | 50% |
| Treatment hazard ratio † (95% confidence interval) | 0.98 (0.83–1.16) | 0.95 (0.85–1.06) | 0.92 (0.83–1.02) | 89 (0.78–1.02) | 0.86 (0.71–1.04) |
| Mortality | |||||
| Exercise event rate | 7% | 3% | 4% | 3% | 4% |
| Usual care event rate | 7% | 5% | 6% | 6% | 5% |
| Treatment hazard ratio (95% confidence interval) | 0.97 (0.70–1.35) | 0.95 (0.77–1.19) | 0.94 (0.76–1.16) | 0.93 (0.69–1.24) | 0.91 (0.60–1.39) |
| Cardiovascular death or hospitalization | |||||
| Exercise event rate | 32% | 33% | 28% | 32% | 37% |
| Usual care event rate | 34% | 27% | 35% | 39% | 36% |
| Treatment hazard ratio (95% confidence interval) | 0.94 (0.78–1.13) | 0.92 (0.82–1.04) | 0.91 (0.81–1.02) | 0.90 (0.77–1.04) | 0.88 (0.72–1.08) |
⁎ All event rates are 1-year Kaplan-Meier rates, stratified by treatment group and BMI category.
† All hazard ratios were estimated using Cox regression analysis, with BMI estimated at the mid-BMI for each category.
Changes in exercise variables, quality of life, and weight over time were also assessed by BMI category ( Table 3 ). Because a relation was found between the baseline BMI and the rates of missing CPX, Kansas City Cardiomyopathy Questionnaire, and weight data, these results should be interpreted with caution. A significant difference, stratified by BMI and treatment, was found for the changes in PKVO 2 , CPX duration, quality of life according to the Kansas City Cardiomyopathy Questionnaire, and weight (all p <0.05), but not for the 6-minute walk distance (p = 0.12). The change in PKVO 2 at 3 months and weight loss at 3 months were significantly correlated (r = 0.17, p = 0.0005); for every 1-kg increase in the 3-month weight change, it was estimated that PKVO 2 increased by 17.6 ml/min. However, as the baseline BMI increased, the association between the weight changes and PKVO 2 lessened (p = 0.045); for each 1-unit increase in BMI, the increase in PKVO 2 associated with weight loss was decreased by 0.3 ml/min.
| Variable | BMI (kg/m 2 ) | ||||
|---|---|---|---|---|---|
| 18.5–24.9 | 25.0–29.9 | 30.0–34.9 | 35.0–39.9 | ≥40 | |
| 6-Minute walk (meters) | |||||
| Exercise baseline to 3 mo | |||||
| Median | 23 | 24 | 17 | 24 | 10 |
| Quartile 1, quartile 3 | −19, 61 | −9, 61 | −17, 50 | −9, 63 | −30, 55 |
| Patients (n) | 182 | 294 | 254 | 127 | 97 |
| Usual care baseline to 3 mo | |||||
| Median | 9 | 4 | 7 | 4 | 4 |
| Quartile 1, quartile 3 | −29, 46 | −27, 35 | −29, 38 | −27, 37 | −31, 35 |
| Patients (n) | 172 | 287 | 198 | 123 | 88 |
| Peak oxygen consumption (ml/kg/min) | |||||
| Exercise baseline to 3 mo | |||||
| Median | 0.4 | 0.8 | 0.6 | 0.9 | 0.3 |
| Quartile 1, quartile 3 | −0.7, 2.2 | −0.7, 2.3 | −1.1, 2.4 | −0.4, 2.7 | −0.7, 1.8 |
| Patients (n) | 185 | 304 | 248 | 130 | 99 |
| Usual Care baseline to 3 mo | |||||
| Median | 0.0 | 0.2 | 0.3 | −0.2 | 0.6 |
| Quartile 1, quartile 3 | −1.3, 1.2 | −1.2, 1.4 | −0.9, 1.5 | −1.4, 1.0 | −0.7, 1.8 |
| Patients (n) | 171 | 288 | 213 | 129 | 91 |
| Peak oxygen consumption (ml/min) | |||||
| Exercise baseline to 3 mo | |||||
| Median | 35 | 52 | 46 | 88 | 30 |
| Quartile 1, quartile 3 | −33, 149 | −54, 184 | −112, 206 | −62, 263 | −101, 228 |
| Patients (n) | 185 | 304 | 248 | 130 | 99 |
| Usual care baseline to 3 mo | |||||
| Median | 13 | 20 | 20 | −16 | 50 |
| Quartile 1, quartile 3 | −79, 90 | −100, 131 | −100, 162 | −155, 112 | −81, 215 |
| Patients (n) | 171 | 288 | 212 | 129 | 91 |
| Cardiopulmonary exercise test duration (min) | |||||
| Exercise baseline to 3 mo | |||||
| Median | 1.7 | 1.5 | 1.6 | 1.5 | 1.4 |
| Quartile 1, quartile 3 | 0.2, 3.0 | 0.1, 3.0 | 0.3, 2.9 | 0.5, 2.9 | 0.3, 2.5 |
| Patients (n) | 193 | 311 | 251 | 134 | 102 |
| Usual care baseline to 3 mo | |||||
| Median | 0.2 | 0.5 | 0.2 | 0.0 | 0.5 |
| Quartile 1, quartile 3 | −0.5, 1.2 | −0.6, 1.5 | −0.9, 1.3 | −0.9, 1.1 | −0.3, 1.9 |
| Patients (n) | 181 | 296 | 212 | 130 | 92 |
| Kansas City Cardiomyopathy Questionnaire overall summary score | |||||
| Exercise baseline to 3 mo | |||||
| Median | 4.7 | 4.2 | 4.7 | 6.0 | 5.7 |
| Quartile 1, quartile 3 | −2.9, 13.4 | −3.5, 12.7 | −2.3, 12.2 | −2.1, 16.4 | 0.0, 18.0 |
| Patients (n) | 207 | 320 | 264 | 143 | 111 |
| Usual care baseline to 3 mo | |||||
| Median | 3.1 | 2.1 | 2.6 | 2.1 | 4.5 |
| Quartile 1, quartile 3 | −3.7, 9.4 | −4.2, 9.1 | −6.5, 9.4 | −5.5, 12.0 | −4.8, 10.8 |
| Patients (n) | 195 | 318 | 219 | 139 | 108 |
| Weight (kg) | |||||
| Exercise baseline to 3 mo | |||||
| Median | 0.1 | 0.0 | −0.5 | −0.5 | −0.3 |
| Quartile 1, quartile 3 | −1.0, 1.9 | −1.6, 1.1 | −2.2, 1.2 | −2.8, 1.5 | −3.7, 2.1 |
| Patients (n) | 188 | 304 | 248 | 130 | 101 |
| Usual care baseline to 3 mo | |||||
| Median | 0.1 | 0.2 | −0.1 | 0.3 | −0.4 |
| Quartile 1, quartile 3 | −1.6, 1.4 | −1.1, 1.6 | −2.7, 2.1 | −1.4, 2.9 | −2.4, 1.6 |
| Patients (n) | 173 | 291 | 213 | 130 | 92 |
Stay updated, free articles. Join our Telegram channel

Full access? Get Clinical Tree


