Cardiac magnetic resonance (CMR) is a standard of reference for cardiac structure and function. Recent advances in T1 mapping and spectroscopy also provide assessment of myocardial tissue composition. However, the reference ranges of left ventricular parameters have rarely been assessed in an African-American (AA) population without known cardiac disease. To estimate the reference values of myocardial structure, function, and tissue composition by CMR and to explore their relationships to serologic factors and cardiovascular risk factors in asymptomatic AAs with low Framingham risk, between November 2010 and June 2012, 92 healthy AAs aged ≥21 years, from Baltimore, MD, were enrolled in an observational study. CMR examination was performed on a 3T scanner. Proton magnetic resonance spectroscopy was performed to noninvasively quantify myocardial triglyceride content. Native T1 values were obtained from modified Look-Locker inversion recovery sequence. The median age was 37 (interquartile range IQR 27 to 44) years (41% men). The median native T1 time of the myocardium was 1,228 ms (IQR 1,200 to 1,263) with no gender difference. The median myocardial fat content was 0.6% (IQR 0.7% to 4.6%). Native T1 time was not influenced by age, sex, and body mass index. Among the factors investigated, myocardial fat and elevated C-reactive protein (>2.0 mg/dL) were independently associated with T1 relaxation time. Native T1 time was also independently associated with left ventricular end-diastolic volume indexed to body surface area. In conclusion, this study of asymptomatic AAs provides reference ranges for cardiovascular structure, function, and tissue composition. Alterations in myocardial fat are associated with native T1 time, a CMR measure of interstitial fibrosis.
T1 mapping is emerging as a useful tool for quantitative assessment of myocardial disease, and measurement of myocardial T1 relaxation times with noncontrast magnetic resonance T1 mapping, also known as “native” T1, has demonstrated potential to detect interstitial expansion because of myocardial edema and fibrosis. Native T1 time of the myocardium has recently been evaluated as a marker of myocardial disease. To use T1 mapping for characterizing myocardium, it is critical to obtain “normal or standard” T1 values. Although T1 values have been estimated in those who were cardiovascularly asymptomatic without known cardiac disease at 3T, normal variation of T1 values in healthy African-American (AA) population has not assessed. Also, factors that are associated with T1 relaxation time in this population should be investigated. The objectives of this investigation were (1) to explore the reference range for T1 relaxation time in healthy AA population and (2) to identify factors that are independently associated with T1 relaxation time in healthy subjects.
Methods
Between November 2010 and June 2012, as part of a cohort study of heart disease in AAs conducted in Baltimore, 92 AA study participants from the city of Baltimore, MD, were enrolled in an observational study investigating factors that are associated with T1 relaxation time.
Inclusion criteria were age ≥21 years and AA. Exclusion criteria were (1) any evidence of ischemic heart disease as indicated by clinical history, previous hospitalization for myocardial infarction, angina pectoris, or evidence of valve disease or hypertension; (2) any symptoms believed to be related to cardiovascular disease; (3) hypertension and/or diabetes; (4) a positive urine test for illegal drugs; (5) HIV infection; (6) pregnancy; and (7) history of magnetic resonance imaging (MRI) claustrophobia.
Interviews regarding sociodemographics, medical history, and behaviors were conducted; urine tests for illegal drugs were performed to exclude those with drug abuse, and HIV infection was determined by enzyme-linked immunosorbent assay and confirmed by Western blot test. Clinical examinations, blood pressure (BP) measurement, cardiac magnetic resonance (CMR), and proton magnetic resonance spectroscopy were performed; and laboratory tests, including lipid profiles, leptin, and high-sensitivity C-reactive protein (hsCRP) levels were obtained.
The Johns Hopkins Medicine Institutional Review Board approved the study protocol and consent form, and all study participants provided written informed consent. All procedures used in this study were in accordance with institutional guidelines. Although the overall investigation is a cohort study, the data presented here are cross-sectional.
All studies were performed on a 3T MR scanner (Trio Tim; Siemens, Erlangen, Germany) with a 6-channel phased-array torso coil and combined with posterior coil elements resulting in 12 channels of data. Participants were instructed to hold their breath at end expiration during imaging and to breathe normally during spectroscopy. To measure left ventricular (LV) function, the heart was imaged in both long- and short-axis orientations, using retrospectively gated steady-state free precession cine images. One grid tagged short-axis slice was obtained at the middle LV.
Myocardial proton MRS spectra were obtained with electrocardiogram gating during early systole, with navigator gating to enable free breathing using a single-voxel point-resolved spectroscopy sequence. The spectroscopic volume (6- to 8-ml voxel) was positioned within the interventricular septum. The navigator was placed across the liver-lung interface. For reliable measurement of the low-fat signals, 1 spectrum was recorded with water suppression (32 averages) and another spectrum (8 averages) was recorded without water suppression.
Native (noncontrast) T1 values were obtained by modified Look-Locker inversion recovery sequence. The modified Look-Locker inversion recovery sequence acquired a set of 11 source 4-chamber view images with 1 breath-hold (17 heartbeats), allowing the reconstruction of 1 parametric T1 map. The source images were all identical with the same voxel size, image position, and phase of the cardiac cycle, except for different effective inversion recovery times. This was achieved by performing 3 different electrocardiography-gated inversion recovery–prepared experiments, each followed by several single-shot image acquisition (about 200 ms) at end-diastole cardiac phase.
The distribution of visceral adipose tissue and subcutaneous adipose tissue were quantified by a single-shot fast spin-echo sequence (slice thickness = 10 mm). Three transverse images were acquired at the level of the fifth lumbar vertebrae during 1 breath hold.
LV volumes and mass were determined at end-diastole from manual endocardial and epicardial contours traced on a stack of short-axis slices using commercially available software (QMass 7.2; Medis, Leiden, The Netherlands). Spectral analysis was performed offline using Java-based MR user interface (jMRUI version 3.0 software). Estimated lipid and water signals were fitted by the advanced method for accurate robust and efficient spectral fitting with the assumption of Gaussian distribution. Resonance frequency of lipids at 0.9 and 1.3 ppm were summed to quantify myocardial triglycerides content and related to water in unsuppressed spectra. Fat fraction was calculated as the ratio of total lipids in the water-suppressed spectra to water content and reported as a percentage.
Tagged ventricular magnetic resonance images were analyzed by HARP MRI (Diagnosoft, Inc., Palo Alto, CA). The average peak midwall circumferential strain (Ecc, %) in the systolic phase was determined in all myocardial segments at the basal, mid, and apical levels as previously described. The value of Ecc is normally negative during the contraction of the ventricle as it corresponds to relative circumferential shortening. Less negative Ecc (or positive Ecc) indicates diminished regional LV shortening. Tagged images were analyzed by a single reader who was blinded to participants’ demographics and steatosis results.
T1 images were processed off-line using MASS research software (Mass; Leiden University Medical Center, Leiden, The Netherlands). Typical pixel-by-pixel fit was performed to a 3-parameter model using Levenberg-Marquardt algorithm. Myocardial T1 value was drawn manually from interventricular septum, the same area that the MRS voxel was positioned. To avoid partial volume effects, voxels at the edge of the myocardium and interatrial septum fat and blood pool were excluded from the contour. The blood T1 value was measured from the LV cavity. Visceral and subcutaneous adipose tissues were identified by selecting the region of interest and thresholding the pixel signal intensity using QMASS software. Adipose tissue volumes were quantified by converting the number of pixels to square centimeters and multiplied by the thickness of slices. The total volume of visceral adipose tissue and subcutaneous adipose tissue was calculated by totaling the volumes of the individual slices.
Statistical analysis was performed with SAS 9.3 (SAS Institute, Cary, NC). All continuous parameters were summarized by medians and interquartile ranges (IQRs), and all categorical parameters were summarized as proportions. To compare between-group differences in demographic and clinical characteristics, lipid profiles, and other factors, the nonparametric Wilcoxon 2-sample test was used for continuous variables and the Fisher’s exact test was employed for categorical variables.
Because the ordinary least-square regression model minimizes the sum of all the residuals and, thus, is sensitive to outliers, a robust regression model with the least trimmed square estimation method was used to provide robust (stable) results in the presence of outliers. Both the Framingham risk score and the newly developed 2013 cardiovascular risk were calculated to estimate the CAD risk. Univariate robust regression models were first fitted to evaluate the crude association between T1 and each of the factors—including age, sex, total serum cholesterol, high-density lipoprotein cholesterol, low-density lipoprotein cholesterol, serum triglycerides, hsCRP, leptin, cigarette smoking, alcohol use, glucose level, systolic BP, diastolic BP, body mass index (BMI), Framingham risk score, and myocardial triglyceride content individually. Those factors that were significant at the p <0.30 level in the univariate models were put into the multivariate robust regression models to identify the ones independently associated with the presence of cardiac steatosis. Those variables that ceased to make significant contributions to the models based on these criteria were deleted in a stagewise manner, and a new model was refitted. This process of eliminating, refitting, and verifying continued until all the variables included were statistically significant, yielding a final model. To examine whether relaxation time influences LV function, a univariate robust regression model was first fitted for each LV function parameter, and then multivariate robust regression analysis was performed for each parameter, adjusting for age, sex, BMI, and Framingham risk score. Because T1 relaxation time is influenced by heart rate, heart rate was treated as a potential confounding factor in the regression models. The p values reported are 2 sided. A p value <0.05 indicated statistical significance.
Results
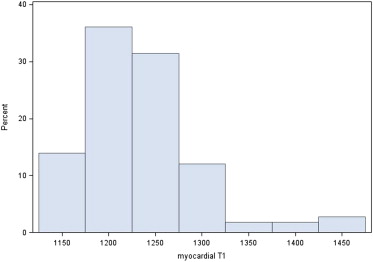
The general and clinical characteristics of the study participants are presented in Table 1 . Among these 92, 31 (33.7%) were of normal weight (18.5 ≤ BMI < 25), 23 (25.0%) were overweight (25 ≤ BMI < 30), and 38 (41.3%) were obese (BMI ≥30). The median myocardial triglyceride content was 0.6 (IQR 0.3 to 1.0). The distribution of T1 relaxation time was moderately skewed (skewness = 0.79) ( Figure 1 ).
| Characteristic | Total | Male | Female | p-Value |
|---|---|---|---|---|
| (N = 92) | (N = 38) | (N = 54) | ||
| Age (years) | 37 (27–44) | 34 (26–42) | 37 (28–47) | 0.52 |
| Family history of CAD | 28% | 16% | 37% | 0.03 |
| Cigarette smoking | 62% | 82% | 48% | 0.001 |
| Years of cigarette smoking | 5 (0–15) | 12 (2–20) | 0 (0–10) | 0.001 |
| Alcohol use | 50% | 66% | 39% | 0.01 |
| Years of alcohol use | 0 (0–11) | 5 (0–15) | 0 (0–5) | 0.016 |
| Hematocrit (%) | 37.1 (34.6–41.2) | 41.5 (40.0–41.8) | 35.1 (33.4–36.5) | 0.0009 |
| hsCRP ≥2 mg/dL | 38% | 21% | 50% | 0.005 |
| hsCRP (mg/dL) | 1.2 (0.4–3.5) | 0.6 (0.2–1.5) | 2.2 (0.6–4.8) | 0.0004 |
| Systolic BP (mm Hg) | 114 (106–124) | 117 (107–126) | 112 (105–120) | 0.19 |
| Diastolic BP (mm Hg) | 65 (59–74) | 64 (60–73) | 67 (58–75) | 0.96 |
| Glucose (mg/dL) | 81 (77–89) | 80 (77–89) | 82 (78–89) | 0.56 |
| BMI (kg/m 2 ) | 28 (23–34) | 25 (21–30) | 31 (26–38) | 0.0005 |
| Leptin (ng/mL) | 10.8 (3.9–37.0) | 3.7 (2.6–5.0) | 35.8 (12.7–47.8) | <0.0001 |
| Total cholesterol (mg/dL) | 168 (148–191) | 161 (147–186) | 172 (149–198) | 0.39 |
| LDL-C (mg/dL) | 94 (77–114) | 87 (72–102) | 100 (79–119) | 0.09 |
| HDL-C (mg/dL) | 58 (49–64) | 54 (45–64) | 59 (51–64) | 0.28 |
| TG (mg/dL) | 70 (56–102) | 70 (56–115) | 70 (56–98) | 0.63 |
| Subcutaneous fat (ml) | 796 (476–1295) | 441 (253–733) | 1105 (730–1420) | <0.0001 |
| Visceral fat (ml) | 402 (294–582) | 348 (267–458) | 473 (337–650) | 0.001 |
| Hepatic TG content (%) | 1.3 (0.7–4.6) | 1.0 (0.4–1.5) | 2.1 (0.9–5.4) | 0.008 |
| Myocardial TG content (%) | 0.6 (0.3–1.0) | 0.4 (0.3–0.8) | 0.7 (0.4–1.1) | 0.024 |
| Framingham risk score | 2 (1–3) | 3 (2–4) | 1 (1–2) | <0.0001 |
| Framingham score <10.0 | 100% | 100% | 100% | — |
| ACC/AHA new risk score | 1.2 (1.0–3.3)% | 2.5 (1.3–4.8)% | 0.2 (0.02–1.53)% | <0.0001 |
| ACC/AHA high risk | 5.4% | 10.5 | 1.9 | 0.07 |
| LV EDV (ml) | 153 (134–174) | 173 (157–194) | 143 (122–160) | <0.0001 |
| LV ESV (ml) | 70 (57–82) | 79 (72–88) | 62 (51–71) | <0.0001 |
| LV SV (ml) | 83 (74–99) | 92 (81–110) | 80 (71–90) | 0.0005 |
| CO (L) | 5.8 (5.0–6.8) | 5.8 (5.1–6.8) | 5.7 (4.7–6.7) | 0.09 |
| LV ejection fraction (%) | 55 (52–59) | 54 (51–58) | 56 (52–62) | 0.03 |
| LV EDM (g) | 118 (91–134) | 134 (122–148) | 102 (84–118) | <0.0001 |
| LV mass to volume ratio (g/ml) | 0.75 (0.67–0.81) | 0.77 (0.71–0.84) | 0.70 (0.64–0.77) | 0.0008 |
| LV EDV indexed to BSA (ml/m 2 ) | 82 (74–91) | 90 (84–97) | 76 (69–81) | <0.0001 |
| LV ESV indexed to BSA (ml/m 2 ) | 38 (31–41) | 41 (39–44) | 33 (28–39) | <0.0001 |
| LV SV indexed to BSA (ml/m 2 ) | 44 (40–51) | 48 (44–54) | 42 (39–47) | 0.0002 |
| CO indexed to BSA (L/m 2 ) | 3.1 (2.7–3.4) | 3.2 (2.7–3.6) | 3.1 (2.6–3.4) | 0.23 |
| LV EDM index to BSA (g/m 2 ) | 61.5 (52.8–68.4) | 68.8 (65.2–75.6) | 54.2 (47.4–60.6) | <0.0001 |
| T1 times (ms) | 1228 (1200–1263) | 1219 (1187–1252) | 1228 (1201–1274) | 0.18 |
| Heart rate (beats/minute) | 64 (58–72) | 60 (58–69) | 66 (58–74) | 0.12 |
∗ Median (interquartile range) for continuous variables, proportion (%) for categorical variables.

Compared with men, women had significantly higher CRP, BMI, leptin, subcutaneous fat, visceral fat, hepatic fat, and myocardial fat and significantly lower LV end-diastolic volume, LV end-systolic volume, LV stroke volume, LV ejection fraction, LV end-diastolic mass, LV mass-to-volume ratio, LV end-diastolic volume indexed to body surface area, LV end-systolic volume indexed to body surface area, LV stroke volume indexed to body surface area, and LV end-diastolic mass indexed to body surface area.
The reference range for myocardial T1 relaxation time was between 1,132 and 1,332 ms based on the mean ± SD of 1,232 ± 51 ms. The 90th and 95th percentiles of T1 relaxation time were 1,294 and 1,309 ms, respectively.
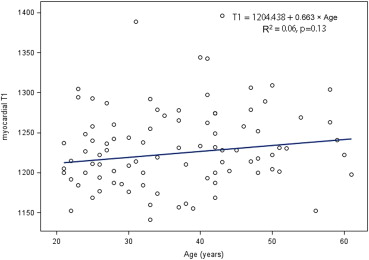
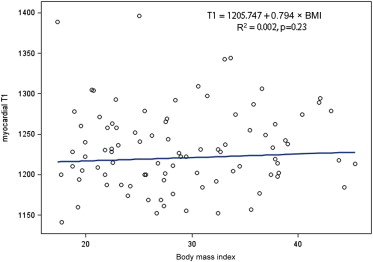
According to robust regression analyses, age and BMI had no impact on T1 relaxation time ( Figures 2 and 3 ). The difference between men and women in T1 relaxation time was not statistically significantly different (the medians with IQRs of T1 are presented in Table 1 , the means and SDs of T1 for men and women are 1,224 ± 49 ms and 1,239 ± 51 ms, respectively, p value for the t test: 0.17).


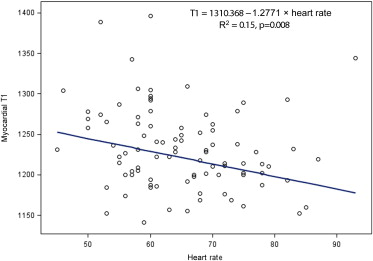
As shown in Figure 4 , T1 relaxation time was significantly associated with the heart rate. By univariate robust regression analyses, factors associated with T1 relaxation time at the 0.30 level included age, male sex, leptin, hsCRP, hsCRP >2 mg/dl, BMI, total cholesterol, high-density lipoprotein cholesterol, subcutaneous fat, visceral fat, hepatic fat, and myocardial triglyceride content. The final robust regression model indicated that only hsCRP >2 mg/dl and myocardial triglyceride content were independently associated with the T1 relaxation time ( Table 2 , Figure 5 ).

| Variable | Noncontrast T1 Relaxation Times (ms) | |
|---|---|---|
| Bi-variate Regression Estimate (SE) ∗ | p-Value | |
| Age (year) | 0.485 (0.416) | 0.24 |
| Male sex | −18.85 (9.020) | 0.037 |
| Cigarette smoking | −7.216 (9.280) | 0.44 |
| Years of cigarette smoking | 0.208 (0.396) | 0.60 |
| Alcohol use | 9.039 (8.963) | 0.31 |
| Years of alcohol use | 0.312 (0.400) | 0.44 |
| Hematocrit (%) | 0.578 (2.640) | 0.83 |
| Leptin (ng/mL) | 0.244 (0.182) | 0.18 |
| hsCRP (mg/dL) | 1.388 (0.925) | 0.13 |
| hsCRP >2 mg/dL | 25.428 (8.955) | 0.005 |
| Systolic BP (mmHg) | −0.264 (0.371) | 0.48 |
| Diastolic BP (mm Hg) | 0.270 (0.505) | 0.59 |
| Fasting glucose (mg/dL) | 0.375 (0.548) | 0.49 |
| BMI (kg/m 2 ) | 0.895 (0.616) | 0.15 |
| Total cholesterol (mg/dL) | −0.145 (0.134) | 0.28 |
| LDL-C (mg/dL) | −0.055 (0.153) | 0.72 |
| HDL-C (mg/dL) | −0.387 (0.285) | 0.17 |
| Triglycerides (mg/dL) | −0.036 (0.118) | 0.76 |
| Framingham score | 1.575 (2.971) | 0.60 |
| ACC/AHA new risk score | −12.405 (148.762) | 0.93 |
| ACC/AHA high risk | 18.424 (19.362) | 0.34 |
| Hepatic triglyceride (%) | 1.110 (0.838) | 0.19 |
| Subcutaneous fat (mL) | 0.011 (0.008) | 0.14 |
| Visceral fat (mL) | 0.025 (0.021) | 0.25 |
| Myocardial triglyceride content (%) | 22.538 (5.149) | <0.0001 |
Stay updated, free articles. Join our Telegram channel

Full access? Get Clinical Tree


