Exercise testing provides valuable information but is rarely integrated to derive a risk prediction model in a referral population. In this study, we assessed the predictive value of conventional cardiovascular risk factors and exercise test parameters in 6,546 consecutive adults referred for exercise testing, who were followed for a period of 8.1 ± 3.7 years for incident myocardial infarction, coronary revascularization, and cardiovascular death. A risk prediction model was developed, and cross-validation of model was performed by splitting the data set into 10 equal random subsets, with model fitting based on 9 of the 10 subsets and testing in of the remaining subset, repeated in all 10 possible ways. The best performing model was chosen based on measurements of model discrimination and stability. A risk score was constructed from the final model, with points assigned for the presence of each predictor based on the regression coefficients. Using both conventional risk factors and exercise test parameters, a total of 9 variables were identified as independent and robust predictors and were included in a risk score. The prognostic ability of this model was compared with that of the Adult Treatment Panel III model using the net reclassification and integrated discrimination index. From the cross-validation results, the c statistic of 0.77 for the final model indicated strong predictive power. In conclusion, we developed, tested, and internally validated a novel risk prediction model using exercise treadmill testing parameters.
There are several risk prediction systems that have been derived from a cohort of healthy participants, but only one model was derived using health records of general practice attendees in United Kingdom, which can be considered as a referral high-risk population. This model has performed better on every measure compared with the Framingham score model, which was derived from a community sample. In addition to its ability to diagnose obstructive coronary lesions, exercise treadmill test (ETT) provides useful prognostic information. Several large studies and a meta-analysis have reported that lesser cardiopulmonary fitness (CPF) is strongly associated with increased cardiovascular (CV) events and death. In addition to CPF, chronotropic incompetence, blood pressure (BP) response, heart rate recovery, and ventricular ectopy have been shown to be associated with increased CV events and deaths. The Framingham and SCORE risk calculators are widely used to estimate 10-year probability of a CV event in a healthy participant, although its ability to accurately predict varies considerably among populations. Patients seen in referral CV clinics would be considered to have greater CV disease (CVD) risk than general population, suggesting that new algorithms for risk prediction are needed in this specific patient subgroup. We sought to develop such a model by studying consecutive patients from Olmsted County, Minnesota, who were referred to our clinic for ETT and CV risk evaluation.
Methods
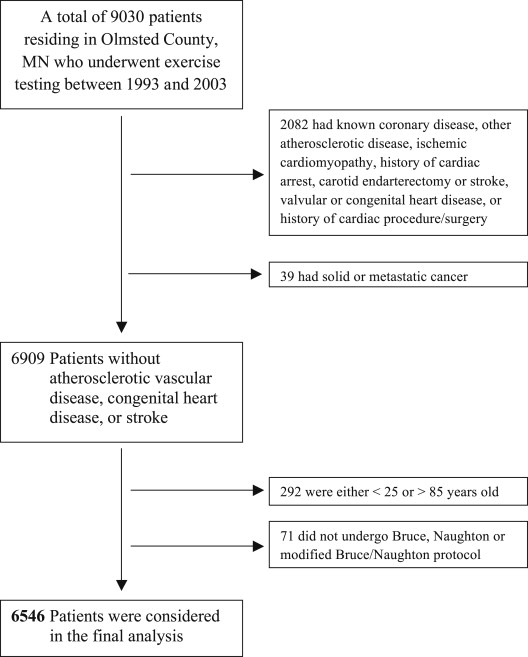
The study population consisted of 9,030 consecutive patients residing in Olmsted County, Minnesota, who were referred for ETT from 1993 to 2003 to our Exercise Testing Laboratory, Cardiovascular Health Clinic, Mayo Clinic, Rochester, Minnesota. All patients were screened for conventional CVD risk factors. Exclusion criteria were age <25 or >85 years, known CVD, presence of another form of atherosclerotic disease including stroke and peripheral vascular disease, significant valvular heart disease, congenital heart disease, malignancy, and inability to undergo ETT using Bruce, Naughton, or modified Naughton protocols. Thus, after exclusion of 2,484 patients, the final study population consisted of 6,546 patients ( Figure 1 ). The Institutional Review Boards of Mayo Clinic and Olmsted Medical Center approved the study.
Clinical characteristics, anthropometric measurements, and electrocardiographic findings were noted at baseline. The patients also had fasting plasma tests within 6 months of ETT. The plasma samples were measured in the Mayo Clinic Laboratory facility for total cholesterol, high-density lipoprotein cholesterol, low-density lipoprotein cholesterol, triglycerides, fasting glucose, and hemoglobin A1c if a patient had suspicion or diagnosis of diabetes mellitus (DM). DM was considered present if any of following conditions were satisfied: physician-documented diagnosis of DM, taking insulin or oral hypoglycemic medications, fasting glucose of ≥125 mg/dl, or hemoglobin A1c of ≥6.5%. Patients were considered current smokers if they had smoked in the past 30 days and past smokers if they were not a current smoker, but had smoked ≥100 cigarettes in their lifetime.
Each patient underwent a symptom-limited maximal ETT using the Bruce, Naughton, or modified Naughton protocol. Exercise duration was expressed in minutes and in percentage of age- and gender-predicted values. Patients were questioned for symptoms at every stage of the test, and the test was stopped because of either symptoms or positive high-risk signs, including a decrease in systolic BP of ≥20 mm Hg with increasing workload, high-risk ST changes, and sustained ventricular tachycardia. The parameters recorded during ETT were symptoms, continuous heart rate and electrocardiogram, and BP at 3-minute intervals. CPF was measured in the form of functional aerobic capacity, which was calculated as actual exercise duration/predicted exercise time × 100. Predicted exercise time was calculated depending on the treadmill protocol using previously published equations as following : for the Bruce protocol: for men: 16 − 0.11 × age in years, for women: 13.3 − 0.1 × age in years; for the Naughton protocol: for men: (60 − 0.5 × age in years)/1.75, for women: (55 − 0.5 × age in years)/1.75; and for the modified Naughton protocol: for men: 16.3 − 0.12 × age in years, for women: 13 − 0.1 × age in years. Heart rate recovery, calculated as peak heart rate − heart rate at 1 minute recovery, was considered abnormal if ≤12. The maximal heart rate was calculated as 220 − age in years. Heart rate reserve was calculated as maximal heart rate − heart rate at rest. Proportion of heart rate reserve used was then calculated as (peak heart rate − heart rate at rest)/heart rate reserve × 100. Chronotropic incompetence was considered present if the proportion of heart rate reserve used was <80% or <62% if patient is taking a β blocker. Electrocardiogram was considered positive for ischemia using standard criteria. In a patient with right bundle block, only V 5 and V 6 leads were analyzed. BP response was considered hypotensive if there was a decrease in systolic BP below baseline with increasing workload.
All patients were followed through May 2008 for incident myocardial infarction (MI; both ST and non-ST elevations), coronary revascularization, and CV deaths. Vital status and cause of death for all subjects were determined using Mayo Clinic registration database, death certificate database from the state of Minnesota, and Accurint (an institutionally approved Web-based resource and location service). Revascularization procedures were obtained from surgical data retrieval using medical record linkage system, and diagnosis of MI was determined using International Classification of Diseases codes through medical diagnosis retrieval using medical record linkage system. One reviewer randomly reviewed 200 charts to assess the accuracy of the MI diagnosis codes. Assuming manually abstracted diagnosis of MI to be the gold standard, the specificity was 83% and the sensitivity was high at 95%. The revascularization procedures occurring within the first 60 days of the test were not included in the analysis as they were mostly prompted by the ETT results.
Descriptive statistics were used to summarize baseline data including demographic, clinical, and ETT parameters. All hypothesized risk factors were evaluated for an association with having a CV event using Cox proportional hazards regression, initially adjusting only for age and gender. Those factors demonstrating a significant-to-marginal association (p <0.10) were carried forward in multivariate modeling to identify independent risk factors that could be jointly used for prediction. To determine a final multivariate model from which the risk score would be based, 4 different models, selected using the entire sample, were considered. These were derived using stepwise model selection with varying retention criteria (p <0.05 vs p <0.01), with or without the inclusion of 2-way interaction terms. Using a cross-validation approach, the performance of these 4 multivariate models was assessed and compared, with the model deemed to have the best performance carried forward for evaluating prediction. To assess model stability, the same stepwise selection criteria were applied in the model fitting. In addition, an aggregate testing sample composed of all the subsets was used for estimating model performance. Under this cross-validation framework, the prognostic ability of each regression model was assessed in terms of discrimination (using concordance [c] statistic) and calibration, while correcting for optimism bias and accounting for uncertainty from the model selection. To assess the performance of our best performing model relative to that of the current Adult Treatment Panel (ATP) III risk algorithm, we compared the accuracy of predictions between the 2 models based on the idea of net reclassification. Then, as proposed by Pencina et al, we calculated the proportion of subjects who were reclassified, whether appropriately or not, using our model in place of the ATP III model. Net reclassification was formally tested for an improvement using a binomial exact test that compared the number appropriately versus inappropriately reclassified by our model. Additionally, the integrative discrimination index (IDI) was assessed to demonstrate how far on average participants were moving (in an appropriate direction) along the continuum of predicted risk between the 2 prediction models. The details of statistical methods are provided in the online Supplementary File .
Results
Table 1 lists baseline characteristics, anthropometric measurements, medication use, laboratory values, and responses to exercise during stress test. During a mean follow up of 8.1 ± 3.7 years, a total of 448 CV events of interest occurred.
| Baseline characters | |
| Age at exercise testing (years) | 49.3 (41.4, 58.6) |
| Men | 3807 (58%) |
| European Americans | 5272 (81%) |
| Asian | 110 (2%) |
| African American | 57 (1%) |
| Other/not reported | 1107 (16%) |
| Body mass index (kg/m 2 ) | 28.1 (25.0, 32.0) |
| Waist/hip ratio | 0.9 (0.8, 1.0) |
| Smokers | |
| Never | 3440 (53%) |
| Past | 2141 (33%) |
| Current | 958 (15%) |
| Family history of coronary disease | 3544 (54%) |
| Diabetes mellitus | 609 (9%) |
| Medications | |
| Anti-hypertension | 1565 (24%) |
| Lipid lowering | 388 (6%) |
| Resting blood pressure | |
| Diastolic (mm Hg) | 80.0 (72.0, 88.0) |
| Systolic (mm Hg) | 126.0 (114.0, 140.0) |
| Fasting blood tests | |
| Total cholesterol (mg/dL) | 209.0 (183.0, 239.0) |
| High-density-lipoprotein cholesterol (mg/dL) | 46.0 (38.0, 56.0) |
| Low-density-lipoprotein cholesterol (mg/dL) | 129.0 (106.0, 154.0) |
| Glucose (mg/dL) | 97.0 (90.0, 106.0) |
| Triglycerides (mg/dL) | 142.0 (101.0, 205.0) |
| Exercise test parameters | |
| Abnormal HR recovery at 1 minute | 1618 (25%) |
| Functional aerobic capacity (%) | 84.2 (68.8, 98.7) |
| Ventricular premature complexes | |
| None | 4519 (69%) |
| ≤5/minute | 1527 (23%) |
| >5/minute | 500 (8%) |
| Positive ST changes | 432 (7%) |
| Chronotropic incompetence | 1578 (24%) |
| Blood pressure response | |
| Normal | 5885 (90%) |
| Hypotensive | 118 (2%) |
| Hypertensive | 543 (8%) |
| Chest pain | |
| Absent | 6059 (93%) |
| Non-angina pectoris | 237 (4%) |
| Atypical angina pectoris | 88 (1%) |
| Typical angina pectoris | 162 (2%) |
| Test protocol | |
| Bruce | 5611 (86%) |
| Modified Bruce | 780 (12%) |
| Naughton | 103 (2%) |
| Modified Naughton | 43 (1%) |
| Cardiovascular outcome | |
| Total number of events | 448 |
| Cumulative incidence (years) | |
| 5 | 216 (3.6%) |
| 10 | 388 (8%) |
| Cardiovascular event type | |
| Percutaneous coronary intervention | 154 (34%) |
| Non-fatal myocardial infarction | 149 (33%) |
| Coronary artery bypass graft surgery | 79 (18%) |
| Cardiovascular mortality | 66 (15%) |
Using the overall cohort, all study variables were evaluated as potential predictors of having a CV event by Cox proportional hazards regression. Because age and gender were each strongly associated with the end point, the initial modeling controlled for these 2 potential confounders through regression adjustment. These models revealed many factors that were significantly associated with increased CV event independent of age and gender, including most of the conventional CV risk factors and several ETT parameters ( Table 2 ). These variables were then carried forward in multivariate regression and competed for inclusion in a final prediction model by stepwise selection. The details of selection of 4 models, that is model 1-A, model 1-N-A, model 2-A, and model 2-N-A, are described in online Supplemental File . With these models, we used cross-validation techniques to assess the model stability and decide the most efficient best performing model to use in a risk score. For the additive model in which the more stringent selection criteria were set to p ≤0.01 (corresponding to the settings of model 1-A), the bias-corrected c statistic for the pooled left-out sample was 0.771, suggesting good discrimination.
| Predictor | Age- & Sex-Adjusted Model Results | Stepwise Selected Model Results ∗ | Stepwise Selected Model Results † |
|---|---|---|---|
| Age (per 10 yrs) | 1.95 (1.81, 2.10) | 1.80 (1.64, 1.96) | 1.77 (1.62, 1.94) |
| Male gender | 2.50 (2.03, 3.07) | 2.41 (1.87, 3.10) | 2.31 (1.78, 2.98) |
| Classical risk factors | |||
| Body mass index | Not selected | ||
| <20 | 2.76 (1.52, 5.02) | 2.88 (1.29, 6.44) | |
| 20–25 | 1.0 (Reference) | 1.0 (Reference) | |
| 25–30 | 1.61 (1.22, 2.13) | 1.44 (1.05, 1.99) | |
| 30+ | 1.81 (1.36, 2.40) | 1.20 (0.85, 1.69) | |
| Smokers (past/current) | 1.47 (1.21, 1.78) | Not selected | 1.25 (1.00, 1.55) |
| Diabetes mellitus | 1.69 (1.31, 2.17) | Not selected | Not selected |
| Total cholesterol (per 20 units) | 1.08 (1.03, 1.13) | 1.09 (1.05, 1.14) | 1.09 (1.04, 1.14) |
| HDL cholesterol (per 10 units) | 0.85 (0.78, 0.93) | 0.88 (0.80, 0.96) | 0.88 (0.80, 0.96) |
| LDL cholesterol (per 20 units) | 1.10 (1.04, 1.17) | Not selected | Not selected |
| Family history of CAD | 1.34 (1.11, 1.62) | 1.45 (1.17, 1.79) | 1.44 (1.17, 1.78) |
| Medications | |||
| Anti-hypertension | 1.50 (1.23, 1.84) | 1.40 (1.11, 1.76) | 1.43 (1.13, 1.80) |
| Lipid lowering | 1.45 (1.06, 1.98) | Not selected | Not selected |
| Exercise parameters | |||
| Functional aerobic capacity (per 10%) | 0.84 (0.80, 0.87) | 0.88 (0.84, 0.92) | 0.88 (0.83, 0.93) |
| Positive ST changes | 1.96 (1.51, 2.54) | 2.09 (1.57, 2.78) | 1.88 (1.40, 2.53) |
| Chronotropic incompetence | 2.09 (1.72, 2.53) | 1.49 (1.18, 1.90) | 1.43 (1.12, 1.82) |
| Hypotensive response | 1.86 (1.07, 3.23) | Not selected | 1.90 (1.06, 3.41) |
| Ventricular premature beats | Not selected | Not selected | |
| None | 1.0 (Reference) | ||
| ≤5/minute | 0.84 (0.67, 1.04) | ||
| >5/minute | 0.87 (0.63, 1.20) | ||
| Typical angina chest pain | 2.31 (1.53, 3.49) | Not selected | 1.77 (1.14, 2.74) |
∗ Stepwise selection, retention criterion of p <.01 (Model 1A).
† Stepwise selection, retention criterion of p <.05 (Model 2A).
To compare the performance of our final model relative to that of the ATP III risk algorithm, we compared their accuracy in cross-validated predictions using c statistics, IDI, and net reclassification. Our model reflected a c statistic of 0.768. In contrast, the c statistic from the modeling of the ATP III risk score was substantially lesser at 0.728. Furthermore, our modeling of both clinical and ETT risk factors corresponded to an average improvement in IDI of 2.40 ± 0.46% compared with the ATP III risk score (p <0.001). Using the model-based predicted probabilities of developing a CV event within 5 years, we assessed the performance of our model compared with the ATP III model based on net reclassification for risk ( Table 3 ). Relative to the ATP III risk score, predictions from our model resulted in a different classification of risk in 29% of subjects (appropriate vs inappropriate reclassification, 58% vs 42%; p <0.001).


