Hereditary transthyretin (TTR) amyloidosis is an adult-onset disease characterized mainly by peripheral neuropathy and cardiomyopathy. Although disease progression is usually 5 to 15 years from time of diagnosis to death, no specific measurements of disease progression have been identified. The present study was designed to identify objective parameters to measure progression of hereditary TTR amyloidosis and determine if these parameters would show significant change within 1 year. Nine patients with biopsy-proved TTR amyloidosis and evidence of cardiac involvement were studied at baseline, 6 months, and 12 months by cardiac magnetic resonance imaging (MRI), electrocardiogram, and echocardiogram. Neurologic impairment score and electromyogram were determined at baseline and 12 months. Left ventricular mass determined by MRI and echocardiogram showed significant change at 12-month examination (p = 0.005 and p = 0.0009, respectively). Electrocardiogram and neurologic impairment score did not show significant change at 12 months. Measurement of left ventricular mass by MRI and echocardiographic techniques showed significant change in hereditary TTR cardiac amyloidosis within 1 year. In conclusion, these methods provide a means to clinically monitor progression of hereditary TTR amyloidosis and determine efficacy of therapeutic interventions.
The most common form of familial amyloidosis is caused by mutations in the plasma protein transthyretin (TTR). More than 100 mutations in TTR have been characterized and most are associated with systemic amyloidosis. The disease is inherited as an autosomal dominant trait and, although originally called “familial amyloidotic polyneuropathy” because neuropathy was a major clinical finding, it is currently appreciated that cardiomyopathy is often the most significant and life-threatening manifestation of the disease. Clinical phenotype and age of onset of disease vary considerably depending on the specific TTR mutation, with disease onset ranging from the third to eighth decade of life. It is well known that TTR amyloidosis usually progresses over a span of 5 to 15 years but rate of disease progression has not been studied systematically. This is a major impediment to testing possible therapeutic procedures. The present study was designed to measure cardiac and neurological parameters over a 12-month period in subjects with biopsy-proved TTR amyloidosis to determine if significant changes could be determined in this short span. Subjects with different TTR mutations were included in the study. All had biopsy-proved TTR amyloidosis and clinical evidence of cardiac involvement.
Methods
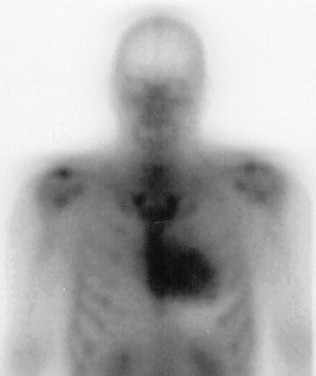
Nine subjects were entered into this study ( Table 1 ). All had ≥1 tissue biopsy (heart, nerve, abdominal fat, gastrointestinal mucosa) demonstrating amyloid deposits with Congo red staining. All had cardiac uptake of technetium-99m pyrophosphate on nuclear medicine scan and none had a history of hypertension ( Figure 1 ). Each subject was evaluated at 3 time points: (1) baseline, (2) 6 months, and (3) 12 months. Data for analysis were obtained from electrocardiogram (ECG), echocardiogram (ECHO), and cardiac magnetic resonance image (MRI) to evaluate cardiac status. Neurologic impairment score and nerve conduction studies were obtained at baseline and 12 months.
| Patient Number | Age/Sex | Mutation | Method | Baseline | 6 Months | 12 Months | Change at 12 Months |
|---|---|---|---|---|---|---|---|
| 1 | 54/M | I84S | MRI/ECHO | 333/391 | 363/555 | 407/639 | 22%/63% |
| 2 | 59/M | T60A | MRI/ECHO | 312/565 | 354/632 | 361/593 | 16%/5% |
| 3 | 53/M | I84S | MRI/ECHO | 280/523 | 307/551 | 311/579 | 11%/11% |
| 4 | 48/M | G47A | MRI/ECHO | 193/367 | 204/372 | 207/392 | 7%/7% |
| 5 | 56/F | I84S | MRI/ECHO | 153/280 | 156/344 | 172/361 | 12%/29% |
| 6 | 59/M | V30M | MRI/ECHO | 149/221 | 144/243 | 146/238 | −2%/8% |
| 7 | 76/M | V30M | MRI/ECHO | 113/189 | 116/231 | 113/247 | 0%/31% |
| 8 | 74/M | T60A | MRI/ECHO | 99/152 | 99/223 | 108/180 | 9%/18% |
| 9 | 55/F | I84S | MRI/ECHO | 92/188 | 97/212 | 90/230 | −2%/22% |
ECGs were obtained in standard 12-lead format on a Marquette MaC 5000 (Milwaukee, Wisconsin) instrument recorded at 25 mm/s, gain of 10 mm/mV, and filtered at 150 Hz. ECGs were interpreted by a single electrocardiographer using hand-held calipers and magnification as needed.
All subjects had ECGs at 3 time points (baseline and 6 and 12 months). ECGs were categorized as normal or abnormal by standard criteria used in our core electrocardiographic laboratory. ECGs were assessed for PR, QRS, and QT intervals, rhythm, conduction disturbances, chamber enlargement, ischemia, infarction, and repolarization.
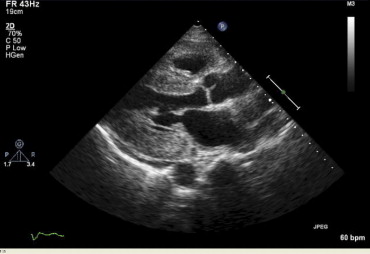
Transthoracic ECHOs were obtained with GE Vivid 7 or Phillips IE33 instruments ( Figure 2 ). All studies were analyzed by 1 echocardiographer. Left ventricular (LV) mass was calculated by the truncated ellipsoid method.
MRI was performed with a 1.5-T whole-body scanner (Magnetom Avanto, Siemens Medical Solutions, Erlangen, Germany) equipped with a 45-mT/m gradient system (quantum gradients, slew rate 200 T/m/s) using a 6-channel anterior and 6-channel posterior torso coil. All acquisitions were acquired using electrocardiographic gating and during breath-hold in inspiration.
LV volumetric assessment was performed using steady-state free precession and true fast imaging with steady-state free precession cine sequence (repetition time 29.12 ms, echocardiographic time 1.82 ms, flip angle 65° to 80°, matrix 164 × 256, slice thickness 8 to 9 mm) in standard 2-chamber and 4-chamber views followed by contiguous short-axis slices from the atrioventricular ring to the apex.
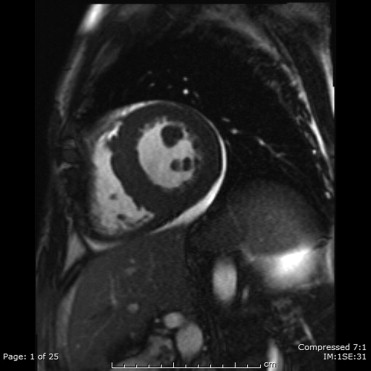
Delayed-enhancement scans were performed approximately 8 to 10 minutes after intravenous administration of Multihance (gadoterate dimeglumine; Bracco Diagnostic, Princeton, New Jersey) 0.1 mmol/kg in 2-chamber, 4-chamber, and 3 short-axis sections (basal, midventricular, and apical) of the left ventricle using a 2-dimensional inversion recovery turbo Fast Low Angle SHot (FLASH) sequence (repetition time 721 ms, echocardiographic time 4.3 ms, flip angle 30°, slice thickness 8 mm). Inversion time (nonselective inversion pulse) was adjusted from 200 to 300 ms for appropriate nulling of the normal myocardial signal using a breath-hold inversion time scout sequence. Analysis of structure, volume, and function was performed using commercially available software (Argus Viewer VE31H, Siemens Medical Solutions). LV wall thickness was measured at end-diastole. For volumetric analysis, the endocardium and epicardium of all end-diastolic and end-systolic slices were traced semi-automatically ( Figure 3 ). Major papillary muscles were included in the cavity volume. From these tracings, LV end-diastolic volume, end-systolic volume, stroke volume, ejection fraction, cardiac output, and myocardial mass values were calculated.
Results of peripheral nervous system examination were quantified by the neuropathy impairment score as defined by Dyck et al. Examination included assessment of muscle strength, muscle stretch reflexes, and sensation in 4 different procedures. Scores can range from 0 for a normal subject to 24 where severe deficits of motor, reflex, and sensory function are present.
Nerve conduction studies were performed in all subjects in standardized fashion. Goals of conduction studies were to identify polyneuropathy and median neuropathy at the wrist. One lower and 1 upper extremity were studied. Muscle and nerve responses were recorded by surface electrodes. A Nicolet Viking Select or Quest instrument (Corefusion, Madison, Wisconsin) was used for recordings. Skin temperature was maintained at ≥32°C in the hand over the first dorsal interosseus muscle and ≥29°C in the foot over the extensor digitorum brevis muscle. Limbs with temperatures below those values were warmed by immersion of the hands or feet in 40°C water for 5 minutes. Initial and follow-up recordings were done by the same nerve conduction technician and neurophysiologist. The peroneal motor nerve was studied with stimulation at the ankle and popliteal fossa and by recording from the extensor digitorum brevis. The sural sensory nerve was studied with recording just posterior to the lateral malleolus and stimulation 14 cm proximally over the lateral calf. In the upper extremity the median nerve was studied by an antidromic sensory conduction study recording over a 13-cm nerve segment. If that study produced abnormal results the ulnar antidromic sensory and median motor nerves were also tested.
A mixed-effect model for repeated measurement of 3 times (baseline, 6 months, and 12 months) was used to test for time effect on LV mass determined by MR imaging and echocardiography after adjusting for age and gender. In addition, we tested significance of LV mass change from baseline to 6 months and from baseline to 12 months (ending point).
Results
All enrolled subjects completed the 1-year study with ECG, ECHO, and cardiac MRI at each time point (baseline, 6 months, and 12 months). Neurologic evaluation was documented only for baseline and 12-month time points. Table 1 lists the calculated LV mass determined by MR imaging and by echocariodgrpahy for each subject at each time point. For MRI the average increase in LV mass for the 9 subjects over the 12-month period was 8% (range −2 to 22, p = 0.005). LV mass calculated from ECHO averaged 22% over the 12-month period (range 5 to 63, p = 0.0009). Table 2 presents overall time effects on LV mass and significant progression from baseline to 6 or 12 months.


