Magnetic resonance imaging (MRI) is considered the clinical reference standard for measuring the right ventricular (RV) volume and ejection fraction, although real-time 3-dimensional echocardiography (RT3DE) would be a preferred method owing to its convenience and availability for repetitive examinations. However, the feasibility, accuracy, and reproducibility of RT3DE have not been fully examined. The present study sought to validate the correlation of RT3DE with a 2-dimensional summation method compared to MRI for assessing the function of the right ventricle and to evaluate the RV function in patients with pulmonary hypertension (PH). Thirty patients with PH underwent both RT3DE and MRI. The right ventricle was reconstructed with RT3DE using a 2-dimensional summation method to analyze the MRI measurements. The RV end-diastolic volume, RV end-systolic volume, and RV ejection fraction were measured. Fifteen normal subjects underwent the same echocardiographic protocol for comparison. The RV end-diastolic volume index, RV end-systolic volume index, and RV ejection fraction measured using RT3DE correlated well with those measured using MRI (R = 0.96, p <0.001; R = 0.96, p <0.001; p = 0.93, and p <0.001, respectively). All inter- and intraobserver variability values for the RV end-diastolic volume, RV end-systolic volume, and RV ejection fraction were <17%. Both the RV end-diastolic volume index and the RV end-systolic volume index were significantly enlarged in those with PH compared to those in the normal subjects (RVEDVI 123 ± 42 ml/m 2 vs 74 ± 12 ml/m 2 ; RVESVI 86 ± 33 ml/m 2 vs 26 ± 5 ml/m 2 in those with PH and the normal subjects, respectively, p <0.0001). In contrast, the RV ejection fraction was significantly reduced in the patients with PH compared to that in the normal subjects (30 ± 12% vs 65 ± 6%, respectively, p <0.01). Thus, RT3DE with a 2-dimensional summation method might provide comparable and feasible measurements of the RV volume in patients with PH compared to MRI.
The present study sought to clarify the accuracy, feasibility, and reproducibility of real-time 3-dimensional echocardiography (RT3DE) with a 2-dimensional (2D) summation method for assessing the right ventricular (RV) volume and function. We compared it to the reference standard of magnetic resonance imaging (MRI) measurement. We also evaluated the RV function in patients with pulmonary hypertension (PH).
Methods
We performed a cross-sectional study that enrolled 45 subjects (14 men; mean age 51 ± 16 years). The group included 15 subjects with echocardiographically normal hearts and an estimated pulmonary artery systolic pressure <30 mm Hg using 2D echocardiography and 30 patients with pulmonary hypertension (PH). PH was defined by an estimated pulmonary artery systolic pressure >50 mm Hg, as measured using Doppler echocardiography. The patient group consisted of 7 patients with chronic pulmonary embolism and 23 with pulmonary arterial hypertension (15 patients with primary PH, 6 with autoimmune disease, and 2 with an atrial septal defect). All patients with PH underwent both RT3DE and MRI. All subjects underwent 2D echocardiography to exclude left-heart disease and to assess the presence of tricuspid insufficiency. The exclusion criteria were contraindications to MRI, the presence of arrhythmia, age <20 or >70 years, and pregnancy. The ethics committee of Keio University Hospital approved the study.
Cardiac MRI scans were obtained using a 1.5-Tesla clinical scanner (GE Healthcare, Milwaukee, Wisconsin). For the RV volume measurements, contiguous transverse images were acquired through the entire right ventricle using a 2D cine, steady-state, free precession technique with prospective electrocardiographic gating ( Figure 1 ). Each cross-section image was obtained in a single breath hold with the following parameters: repetition time 3.2 ms, echo time 1.6 ms, flip angle 45°, bandwidth 125 kHz, field of view 350 × 350 mm 2 , matrix size 224 × 192, slice thickness 10 mm without a gap, and 20 phases during one cardiac cycle. The in-plane resolution was 1.6 × 1.8 mm 2 . The cardiac MRI examination time was approximately 30 minutes and included short-axis images of the left ventricle to evaluate the left ventricular function, after transverse images of the right ventricle. Post processing was performed on a workstation (AdvantageWorkstation, GE Healthcare, Milwaukee, Wisconsin). The endocardial borders of all images at end-diastole and end-systole were manually traced by a radiologist with 10 years’ experience of cardiac MRI. The end-diastolic volume, end-systolic volume, and ejection fraction were automatically calculated using Simpson’s rule. The inclusion of the trabeculae carneae in the RV volume was the same as that used in the ultrasound methods for comparison. Fewer than 15 minutes were required for RV volume measurement.
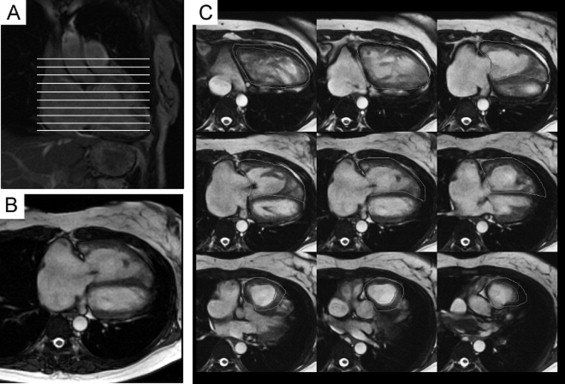
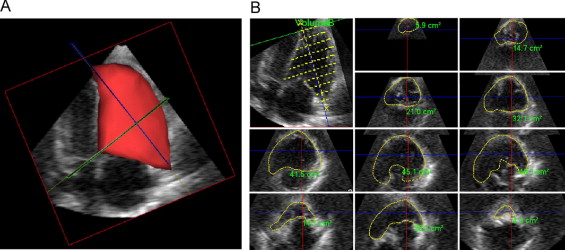
Figure 2 shows the 3D RV reconstruction using the RT3DE analysis. Using iE33 (Philips Medical Systems, Bothell, Washington), the RT3D echocardiographic images were obtained from the apical window with the patient in the same position as for 2D echocardiography. The images were also gathered for 5 cardiac cycles using a matrix array transducer. The acquisition time for RT3DE was 1 to 2 minutes. Off-line analyses were blindly performed by 2 independent observers using a General Imaging 3DQ Plug-in with the Advanced Q-Laboratory analysis software (Philips Medical Systems). The long axis from the apex to the area around the tricuspid valve was determined, and 10 cross-sections were observed at an even distance apart. The ellipse was manually traced to the endocardial borders of each cross section, just as for the MRI procedure. All the ellipses were then stacked to reconstruct the whole intracardial space of the right ventricle in 3 dimensions. The 3D representation of the right ventricle was observed from different directions and then revised with respect to the inappropriate traces to complete the analysis. The measurement time for RT3DE was approximately 10 to 30 minutes.
The pressure gradient of tricuspid regurgitation was measured using continuous wave Doppler imaging. The mean right atrial pressure was estimated from the diameter and collapsibility of the inferior vena cava, as reported previously. Next, the pulmonary arterial systolic pressure was calculated by summation of the pressure gradient of the tricuspid regurgitation and right atrial pressure.
The results for the RV end-diastolic volume, end-systolic volume, and ejection fraction are presented as the mean ± SD. Correlations were determined between the echocardiographic and MRI measurements, and agreement was expressed according to the Bland-Altman method. p Values <0.05 were considered statistically significant. The statistical analysis was performed using the Statistical Package for Social Sciences, version 10 (SPSS, Chicago, Illinois).
Results
Table 1 lists the clinical characteristics for the normal subjects and patients with PH. We first validated the measurement for RV function using RT3DE compared with that obtained using MRI analysis. Visualization of the RV free wall, tricuspid valve, RV outflow tract, and apex were feasible with both RT3DE and MRI, although poor endocardial definition in at least one view precluded a quantitative assessment. The RV parameters measured by both RT3DE and MRI included the RV end-diastolic volume, RV end-diastolic volume indexed to the body surface area (RV end-diastolic volume index), RV end-systolic volume, RV end-systolic volume indexed to body surface area (RV end-systolic volume index), RV ejection fraction, and pulmonary artery systolic pressure. The RV parameters measured with RT3DE by the 2 observers were averaged for comparison with those obtained with MRI. The 2 sets of values were close for all parameters ( Table 2 ), and Figure 3 demonstrates the strong correlation between RT3DE and MRI measurements for the RV end-diastolic volume index, RV end-systolic volume index, and RV ejection fraction.
| Variable | Normal (n = 15) | Patients With PH (n = 30) |
|---|---|---|
| Age (years) | 56 ± 19 | 50 ± 15 |
| Women (n) | 8 (53%) | 21 (70%) |
| Height (cm) | 161 ± 7 | 158 ± 9 |
| Body weight (kg) | 55 ± 9 | 55 ± 13 |
| Body surface area (m 2 ) | 1.6 ± 0.2 | 1.5 ± 0.2 |
| Left ventricular end-diastolic diameter (mm) | 43 ± 3 | 39 ± 8 |
| Left ventricular end-systolic diameter (mm) | 26 ± 3 | 23 ± 6 |
| Left ventricular ejection fraction (%) | 78 ± 5 | 77 ± 13 |
| Pulmonary artery systolic pressure (mm Hg) | 27 ± 5 | 99 ± 22 ⁎ |
| Parameter | RT3DE (n = 30) | MRI (n = 30) |
|---|---|---|
| Right ventricular end-diastolic volume (ml) | 203 ± 60 | 202 ± 63 |
| Right ventricular end-systolic volume (ml) | 139 ± 53 | 137 ± 57 |
| Right ventricular end-diastolic volume index (ml/m 2 ) | 203 ± 60 | 202 ± 63 |
| Right ventricular end-systolic volume index (ml/m 2 ) | 92 ± 36 | 90 ± 38 |
| Right ventricular ejection fraction (%) | 32 ± 13 | 33 ± 14 |
Stay updated, free articles. Join our Telegram channel

Full access? Get Clinical Tree


