Vascular complications in transcatheter aortic valve implantation using transfemoral approach are related to higher mortality. Complete percutaneous approach is currently the preferred technique for vascular access. However, some centers still perform surgical cutdown. Our purpose was to determine complications related to vascular access technique in the population of the Spanish TAVI National Registry. From January 2010 to July 2015, 3,046 patients were included in this Registry. Of them, 2,465 underwent transfemoral approach and were treated with either surgical cutdown and closure (cutdown group, n = 632) or percutaneous approach (puncture group, n = 1,833). Valve Academic Research Consortium-2 definitions were used to assess vascular and bleeding complications. Propensity matching resulted in 615 matched pairs. Overall, 30-day vascular complications were significantly higher in the puncture group (109 [18%] vs 42 [6.9%]; relative risk [RR] 2.60; 95% confidence interval [CI] 1.85 to 3.64, p <0.001) due mostly by minor vascular events (89 [15%] vs 25 [4.1%], RR 3.56, 95% CI 2.32 to 5.47, p <0.001). Bleeding rates were lower in the puncture group (18 [3%] vs 40 [6.6%], RR 0.45, 95% CI 0.26 to 0.78, p = 0.003) mainly driven by major bleeding (9 [1.5%] vs 21 [3.4%], RR 0.43, 95% CI 0.20 to 0.93, p = 0.03). At a mean follow-up of 323 days, complication rates remained significantly different between groups (minor vascular complications 90 [15%] vs 31 [5.1%], hazard ratio 2.99, 95% CI 1.99 to 4.50, p <0.001 and major bleeding 10 [1.6%] vs 21 [3.4%], hazard ratio 0.47, 95% CI 0.22 to 1.0, p = 0.04, puncture versus cutdown group, respectively). In conclusion, percutaneous approach yielded higher rates of minor vascular complications but lower rates of major bleeding compared with the surgical cutdown, both at 30-day and at mid-term follow-up in our population.
Transcatheter aortic valve implantation (TAVI) has emerged as an effective alternative to surgical replacement in selected high-risk patients. TAVI procedures usually requires the use of large sheaths, which may eventually induce vascular or bleeding complications. Major vascular complications during the TAVI procedure range from 5% to 25% and are associated with a major increase in mortality risk. A substudy of the Placement of Aortic Transcatheter Valves (PARTNER) trial reported rates of 15% major and 12% minor vascular complications. The occurrence of vascular complications might be influenced by factors, such as patient anatomy, female gender, device size, and operator experience. In clinical practice, some centers still perform TAVI procedures by surgical cutdown. However, complete percutaneous access is now the preferred technique in most centers. There is limited scientific evidence about which one of both approaches might improve clinical outcomes. The aim of this study was to determine the access-related vascular and bleeding complications of TAVI procedures relative to the vascular access technique from the population of the Spanish TAVI Registry.
Methods
The Spanish TAVI National Registry was initiated in 2010 and includes all patients treated by TAVI in a total of 41 Spanish centers. For the purpose of this study, we analyzed patient data from all TAVI procedures using a transfemoral approach (TF-TAVI) that were included in the Registry from January 2010 to July 2015. Procedures using a transapical or other accesses were excluded from the analysis.
The Spanish TAVI National Registry is a joint collaboration between the Working Group on Interventional Cardiology of the Spanish Society of Cardiology and the Spanish Society of Thoracic and Cardiovascular Surgery. The Registry complies with Spanish data protection laws and has been approved by a central ethics board. Center participation on this Registry is voluntary. All the patients signed informed consent for research use of their anonymized data from the Registry. Individual patient data were collected using an electronic case report form.
During the recruitment period, all patients were treated either with Medtronic CoreValve (Medtronic, Dublin, Ireland) or Edwards SAPIEN (Edwards Lifesciences, Irvine, California). The selection of prosthesis and vascular access were based on each center preference and experience. The procedures were usually performed under general anesthesia and were guided by transesophageal echocardiography. Surgical access and closure were performed in standard fashion. For the percutaneous approach, the “preclosure” technique was performed as described elsewhere. The selection of closure devices was at discretion of the operator.
Outcomes were classified according to the updated Valve Academic Research Consortium-2 definitions. To assess the access-related complications, we evaluated vascular complications and bleeding rates at 30 days and at mid-term follow-up. In addition, we evaluated all-cause death, stroke, Acute Kidney Injury Network (AKIN) stage 3 renal failure, and myocardial infarction rates according to the Valve Academic Research Consortium-2 definitions.
Statistical analysis was performed using SPSS 15.0 (SPSS Inc., Chicago, Illinois). Continuous variables are presented as mean ± SD and categorical variables as frequencies and percentages. Between-group comparisons were performed using Student’s t test for continuous variables and the chi-square or Fisher’s exact test for categorical variables, when appropriate. Main effect estimates are presented with their 95% confidence interval (CI).
To reduce selection bias, we used a propensity-matched score, estimated by logistic regression, selecting the covariates by clinical and statistical criteria. The model included age, gender, body mass index, peripheral artery disease, previous coronary artery bypass graft, creatinine clearance, logistic Euroscore, left ventricular ejection fraction, mean gradient, and prosthesis size and type. Participants were matched using a 1:1 nearest-neighbor approach. Computations were performed using the MatchIt package. This analysis resulted in 615 matched pairs.
Kaplan-Meier method was used for cumulative survival analysis free of vascular complications and bleeding. To compare the survival between groups during follow-up, the log-rank and Breslow exact test were used as appropriate. Hazard ratios (HRs) (95% CI) were assessed using Cox models and compared with the Wald test.
Results
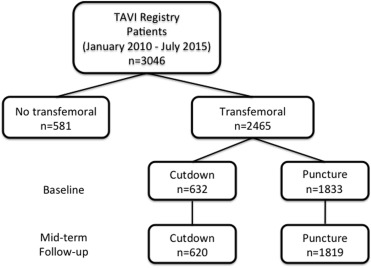
From January 2010 to July 2015, 3,046 patients were included in the Registry. Of them, 2,465 patients underwent TF-TAVR and were finally included in this analysis. Complete percutaneous approach (puncture group) was performed in 1,833 (74.3%) of them and surgical cutdown and closure (cutdown group) in the remaining 632 (25.6%). The flow chart of the study is depicted in Figure 1 . Baseline characteristics are reported in Table 1 . There were no differences in terms of gender, body mass index, and cardiovascular risk factors between groups. Patients of the cutdown group were older, had higher prevalence of smoking history, peripheral vascular disease and previous bypass surgery, compared with the puncture group. Conversely, the rate of angina pectoris was higher in the puncture group. We did not find significant differences in baseline echocardiographic data. In the propensity-matched population, the only significant differences between groups were found in the prevalence of atrial fibrillation (puncture 31% vs cutdown 25%, p = 0.03) and known coronary artery disease (puncture 56% vs cutdown 49%, p = 0.03).
| Variable | Total (N = 2465) | Before Matching | After Matching | ||||
|---|---|---|---|---|---|---|---|
| Puncture (N = 1833) | Cutdown (N = 632) | P value | Puncture (N = 615) | Cutdown (N = 615) | P value | ||
| Age (years) | 82±7 | 82±6 | 81±7 | 0.03 | 82±7 | 81±7 | 0.52 |
| Female | 1360 (55%) | 1015 (55%) | 345 (55%) | 0.73 | 343 (56%) | 334 (54%) | 0.61 |
| Body mass index (kg/m 2 ) | 29±11 | 29±11 | 29±12 | 0.85 | 28±5 | 28±5 | 0.98 |
| High blood pressure | 1198 (79%) | 1478 (81%) | 501 (79%) | 0.46 | 503 (82%) | 494 (80%) | 0.51 |
| Dyslipidemia | 1355 (55%) | 999 (55%) | 356 (56%) | 0.43 | 343 (56%) | 352 (57%) | 0.61 |
| Diabetes mellitus | 869 (35%) | 640 (35%) | 229 (36%) | 0.55 | 226 (37%) | 224 (36%) | 0.91 |
| Smoking history | 589 (24%) | 418 (23%) | 171 (27%) | 0.03 | 150 (24%) | 166 (27%) | 0.30 |
| Previous ictus | 294 (12%) | 215 (12%) | 79 (13%) | 0.61 | 82 (13%) | 78 (13%) | 0.74 |
| Peripheral vascular disease | 264 (11%) | 181 (10%) | 83 (13%) | 0.02 | 84 (14%) | 82 (13%) | 0.87 |
| Previous myocardial infarction | 312 (13%) | 232 (13%) | 80 (13%) | 0.99 | 85 (14%) | 77 (13%) | 0.50 |
| Previous percutaneous coronary intervention | 581 (24%) | 442 (24%) | 139 (22%) | 0.28 | 153 (25%) | 134 (22%) | 0.20 |
| Previous coronary artery bypass grafting | 2451 (10%) | 157 (9%) | 88 (14%) | <0.001 | 69 (11%) | 88 (14%) | 0.10 |
| Known coronary artery disease | 872 (53%) | 630 (54%) | 242 (49%) | 0.04 | 228 (56%) | 237 (49%) | 0.03 |
| Atrial fibrillation | 665 (27%) | 507 (28%) | 158 (25%) | 0.19 | 191 (31%) | 156 (25%) | 0.03 |
| Pacemaker | 196 (8%) | 143 (8%) | 53 (8%) | 0.64 | 43 (7%) | 52 (9%) | 0.34 |
| Creatinine Clearance (mL/min) | 51±22 | 51±21 | 52±24 | 0.16 | 51±21 | 52±23 | 0.51 |
| New York Heart Association class III-IV | 1763 (72%) | 1312 (72%) | 451 (71%) | 0.92 | 479 (78%) | 446 (74%) | 0.03 |
| Angina pectoris class II-IV | 925 (38%) | 726 (40%) | 199 (32%) | <0.001 | 226 (37%) | 198 (32%) | 0.09 |
| Logistic EuroSCORE (%) | 17±11 | 17±11 | 18±12 | 0.03 | 17±12 | 18±12 | 0.51 |
| Left ventricular ejection fraction (%) | 56±14 | 56±14 | 55±13 | 0.03 | 55±14 | 55±13 | 0.62 |
| Mean gradient (mmHg) | 48±15 | 48±15 | 49±15 | 0.65 | 47±15 | 49±15 | 0.47 |
| Peak gradient (mmHg) | 79±23 | 79±23 | 79±23 | 0.69 | 78±24 | 79±23 | 0.06 |
| Annulus Diameter(mm) ∗ | 22±2 | 21.8±2,3 | 21.4±2.0 | 0.004 | 21.3±2.1 | 21.4±2.0 | 0.49 |
Procedural outcomes are presented in Table 2 . Most of the transfemoral procedures were carried out in the catheterization laboratory (2,365; 96%). Edwards-SAPIEN prosthesis were used in 1,300 (53%) patients (537 [41%] cutdown vs 763 [59%] puncture) and CoreValve prosthesis in 1,150 (47%) patients with (92 [8%] cutdown vs 1,058 [92%] puncture). The puncture group received a larger prosthesis (26.2 ± 2.3 vs 25.1 ± 2.0, p <0.001) and had longer radiation time (26 ± 13 vs 20 ± 12 minutes, p <0.001) and higher amount of contrast used (177 ± 98 vs 146 ± 86 ml, p <0.001) than the cutdown group, with similar procedural time. The echocardiographic data at discharge were comparable in both groups. In the propensity-matched population, fluoroscopy time was significantly higher in the puncture group. The mean inhospital stay was 10 ± 8.9 days before matching (puncture 10.1 + 8.9 vs cutdown 10.0 + 8.8, p = 0.84) and 9.9 + 8.7 days after matching (puncture 9.8 + 8.7 vs cutdown 10.0 + 8.7 p = 0.70).
| Variable | Total N = 2465 | Before Matching | After Matching | ||||
|---|---|---|---|---|---|---|---|
| Puncture N = 1833 | Cutdown N = 632 | P value | Puncture N = 615 | Cutdown N = 615 | P value | ||
| Type of room | <0.001 | 0.79 | |||||
| Catheterization laboratory | 2365(96%) | 1776(97%) | 589(93%) | 576 (94%) | 572 (93%) | ||
| Operating room | 3(0.1%) | 1(0.1%) | 2(0.3%) | 1 (0.2%) | 2 (0.3%) | ||
| Hybrid room | 97(4%) | 56(3%) | 41(7%) | 38 (6%) | 41 (7%) | ||
| Type of prosthesis | <0.001 | 0.22 | |||||
| Edwards | 1300(53%) | 763(42%) | 537(85%) | 523 (85%) | 523 (85%) | ||
| Core-Valve | 1165(47%) | 1070(58%) | 95(15%) | 92 (15%) | 92 (15%) | ||
| Size of prosthesis | |||||||
| Mean (mm) | 25.9±2.3 | 26.2±2.3 | 25.1±2.0 | <0.001 | 25.1±2.10 | 25.1±2.06 | 0.77 |
| 20 | 3 (0.1%) | 3 (0.2%) | 0 (0) | <0.001 | 2 (0.3%) | 0 (0%) | 0.41 |
| 23 | 691 (28%) | 426 (23%) | 265 (42%) | 266 (43%) | 262 (43%) | ||
| 25 | 3 (0,1%) | 3 (0.2%) | 0 (0%) | ||||
| 26 | 1156 (47%) | 869 (47%) | 277 (45%) | 269 (44%) | 274 (45%) | ||
| 27 | 3 (0.1%) | 3 (0.2%) | 0 (0%) | ||||
| 29 | 566 (23%) | 487 (27%) | 79 (13%) | 74 (12%) | 78 (13%) | ||
| 31 | 43 (1.7%) | 42 (2.3%) | 1 (0.2%) | 4 (0.7%) | 1 (0.2%) | ||
| Procedural time (min) | 107±46 | 107±44 | 108±50 | 0.46 | 107±47 | 109±51 | 0.42 |
| Fluoroscopy time (min) | 24±13 | 26±13 | 20±12 | <0.001 | 26±13 | 20±12 | <0.001 |
| Contrast volume (mL) | 167±95 | 177±98 | 146±86 | <0.001 | 145±80 | 145±83 | 0.95 |
A total of 2,173 (88%) patients were discharged alive with the valve successfully implanted 1,006 (88%) in the puncture group versus 567 (89.7%, p = 0.24) in the cutdown group. There were no significant differences between the groups in the need for hemodynamic support, aortic regurgitation, and conversion to surgery.
At 30-day follow-up and before the propensity-matched analysis, there were more minor vascular complications in the puncture group compared with the cutdown group (relative risk [RR] 2.71, 95% CI 1.81 to 4.06, p ≤ 0.001). Conversely, bleeding was more frequent in the cutdown group (RR 0.62, 95% CI 0.43 to 0.90, p = 0.01) due to major bleedings (3.4% vs 2.1%, p = 0.08). Acute myocardial infarction (AMI) was more frequent in the cutdown group (RR 0.47; 95% CI 0.23 to 0.96, p = 0.03). There were no significant differences in the other end points.
After propensity-matched analysis ( Table 3 ), overall vascular complications remained significantly higher in the puncture group (RR 2.6, 95% CI 1.85 to 3.64, p <0.001), mainly driven by the development of minor vascular complications. Besides, overall and minor vascular complications were mostly related to the access site. In contrast, bleeding rates were higher in the cutdown group (RR 0.45, 95% CI 0.26 to 0.78, p = 0.003), principally due to major bleedings. Again, overall and major bleeding were more often related to the access site. Local wound infections were present in 16 cases (2.6%), all of them in the cutdown group. There were no differences in the frequency of other clinical end points.
| Puncture (N = 615) | Cutdown (N = 615) | P value | RR (95%CI) | |
|---|---|---|---|---|
| Death | 42 (7.2%) | 35 (6.1%) | 0.44 | 1.18 (0.76-1.83) |
| Vascular complications | 109 (18%) | 42 (6.9%) | <0.001 | 2.60 (1.85-3.64) |
| Access related | 103 (17%) | 36 (5.9%) | <0.001 | 2.86 (1.99-4.11) |
| Major | 20 (3.3%) | 17 (2.8%) | 0.26 | 1.18 (0.62-2.24) |
| Access related | 14 (2.3%) | 12 (2%) | 0.84 | 1.16 (0.54-2.50) |
| Non access related | 6 (1%) | 5 (0.8%) | 1 | 1.20 (0.37-3.91) |
| Minor | 89 (15%) | 25 (4.1%) | <0.001 | 3.56 (2.32-5.47) |
| Bleeding | 18 (3.0%) | 40 (6.6%) | 0.003 | 0.45 (0.26-0.78) |
| Access related | 10 (1.6%) | 27 (4.4%) | 0.007 | 0.37 (0.18-0.76) |
| Major | 9 (1.5%) | 21 (3.4%) | 0.03 | 0.43 (0.20-0.93) |
| Access related | 6 (1%) | 12(2%) | 0.16 | 0.51 (0.19-1.32) |
| Non access related | 3 (0.5%) | 9(1.5%) | 0.14 | 0.33 (0.09-1.23) |
| Minor | 9 (1.5%) | 19 (3.1%) | 0.06 | 0.47 (0.22-1.04) |
| Stroke | 16 (2.6%) | 8 (1.3%) | 0.10 | 2.00 (0.86-4.64) |
| Renal failure | 14 (2.3%) | 14 (2.3%) | 1 | 1.00 (0.48-2.08) |
| Acute myocardial infarction | 9 (1.5%) | 13 (2.1%) | 0.39 | 0.69 (0.30-1.61) |
Stay updated, free articles. Join our Telegram channel

Full access? Get Clinical Tree


