Pulmonary Function Testing

Chapter 9 Pulmonary Function Testing


Pulmonary function testing provides quantitative assessment of lung function and encompasses a variety of specific measurements, ranging those that can be obtained readily at the bedside or in the home to complex physiologic assessments made in a referral laboratory.


Spirometry in the office is used to screen for abnormalities of airflow or lung volume, to test bronchodilator responsiveness, and for interval assessments in patients who have asthma or chronic obstructive pulmonary disease (COPD). Screening spirometry has been recommended for middle-aged smokers and former smokers to identify airflow obstruction at an earlier stage than that typical for persons presenting with dyspnea. Although COPD often is suspected from smoking history and symptoms, the diagnosis rests on the demonstration of airflow obstruction from spirometry testing, and current measures of clinical quality require that such testing be done. COPD has now become the third leading cause of death (in U.S. statistics) yet frequently is diagnosed late in the course as it becomes disabling. Up to one half of the persons with this condition may remain undiagnosed, because the most common early symptoms, cough and exertional dyspnea, often are attributed to other causes.


Testing in the pulmonary function laboratory allows further classification and quantification of lung disease by adding data from the measurement of lung volumes and assessment of gas exchange through measurement of diffusing capacity and arterial blood gases, and from tests of gas distribution. Special testing is available for prethoracotomy evaluation, assessment of upper airway obstruction, bronchoprovocation challenge testing, and cardiopulmonary exercise response (discussed in Chapter 10). Although even comprehensive lung function testing may not provide a specific diagnosis, the pattern of physiologic derangements guides further assessment, and demonstration of the severity of impairment aids in prognosis.


Guidelines for pulmonary function equipment specifications, procedural techniques, and interpretation of results were most recently published in 2005 by a joint panel of the American Thoracic Society (ATS) and the European Respiratory Society (ERS). The multipart series of statements are included in the “Suggested Readings” listing, and the recommendations presented in this chapter are consistent with these guidelines.


Spirometry


The Forced Expiratory Volume Maneuver


Assessments of vital capacity (VC), or forced vital capacity (FVC) and airflow are based on the forced expiratory volume maneuver, in which the subject inhales maximally to total lung capacity (TLC) and then exhales forcefully and completely to residual volume (RV). The expiratory flow rate at any point during this maneuver is determined by the driving pressure for airflow and the airway resistance. During a forceful exhalation, the intrathoracic pressure that surrounds the central airways exceeds the intraluminal pressure, causing dynamic compression of the airway (see Chapter 3, Figure 3-12). As a result, the effective driving pressure becomes the difference between alveolar pressure and the pleural pressure that compresses airways. This pressure difference (PA − Ppl) is equivalent to the elastic recoil pressure of the lung tissue. Thus, even during a forceful effort, the intrinsic elastic properties of the lung are a major determinant of airflow. Airway resistance upstream from the point of compression is determined primarily by airway caliber, which varies directly with lung volume. Throughout exhalation from TLC, both recoil pressure and airway caliber progressively decrease, so that airflow rates, after an early peak, also progressively decrease. Although the peak expiratory flow rate varies with the rapidity and forcefulness of the expiratory effort, once dynamic compression begins, the flow rate during the middle to later portions of the maneuver is limited and independent of further effort beyond the threshold needed to begin compression. These flows also are independent of added resistance downstream from the point of flow limitation. This physiologic arrangement aids in making the basic measurements of spirometry quite reproducible on repeated efforts.


To obtain a satisfactory spirometric tracing, the preceding inspiration must be maximal and the forced expiratory volume maneuver must be continued to cessation of flow or, when emptying is slowed, for at least 6 to10 seconds. The resultant information commonly is displayed in one of two formats. The traditional spirogram (Figure 9-1) plots volume versus time, with flow rate indicated by the steepness of the plot. The orientation of the axes varies with equipment, with time moving to the right and exhaled volume plotted either up or down. In the flow-volume display (Figure 9-2), the instantaneous flow rate is measured continuously and directly plotted on the vertical axis with volume on the horizontal axis. Time is not shown on this plot but may be indicated by tick marks. With this display, the reproducibility of successive efforts and some patterns of abnormality may be more easily seen. It is important to recognize that both the traditional spirogram and the expiratory flow-volume display are obtained from the same maneuver but emphasize different aspects of the information thus obtained.


image

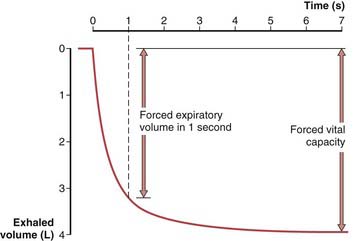
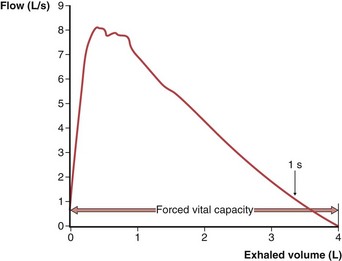
Figure 9-2 Normal expiratory flow-volume curve. The same forced expiratory volume maneuver shown in Figure 9-1 is plotted here as a flow-volume curve. The airflow rate reaches a peak early in the exhalation and then decreases progressively until flow ceases at residual volume.


(Modified from Culver BH: Pulmonary function testing. In Kelly WN, editor: Textbook of internal medicine, Philadelphia, 1988, JB Lippincott.)


Expiratory Flow Measurements


Basic measurements from the forced expiratory volume maneuver include FVC, the forced expiratory volume in 1 second (FEV1), and the ratio of FEV1 to FVC. The FVC or total volume exhaled is equivalent in normal subjects to a so-called slow VC, obtained with a complete but not forceful exhalation. Patients who have advanced obstructive airway disease often manifest exaggerated dynamic compression (narrowing airways with forceful efforts), so that the FVC is smaller than the slow VC. A reduction in VC reflects either a reduction in TLC, an increase in RV, or a combination of both. The FEV1 is readily obtained from the volume-time spirogram by observing the volume exhaled in the first 1 second of effort. This measurement cannot be seen on the flow-volume display but can be calculated by the microprocessors in the equipment that use this display. Determination of FEV1/FVC is easily performed using simple equipment; this ratio provides the best index of airflow limitation. When the slow VC also is available, and if it is larger, this may be substituted for FVC, thereby increasing the sensitivity of the ratio for detection of obstruction. This ratio is commonly expressed as a percentage and sometimes is referred to as the “percent FEV1”; however, this terminology may cause confusion, because the FEV1 itself is commonly expressed as a percentage of its predicted value. Misunderstanding is lessened if the ratio is reported and discussed as a decimal (e.g., 0.82).


An additional flow measurement widely reported from the spirogram is the average forced expiratory flow rate between 25% and 75% of the exhaled VC (FEF25–75), formerly referred to as the maximum midexpiratory flow rate. This measurement shows wider variability than that typical for FEV1 or FEV1/FVC, both within and between individual subjects. When this variability is appropriately accounted for, FEF25–75 is not more sensitive than FEV1/FVC for the detection of airflow limitation. Numerous other flow measurements can be obtained from the forced expiratory volume maneuver, but they are highly interdependent with those already described and add little new information. The FEV0.5 may be used to assess the initiation of effort but adds little diagnostic information in adults. In young children, the FEV0.5 or FEV0.75 can be a useful index of flow, because children may fully empty their lungs within the first second.


Because it may be difficult for some subjects to consistently maintain the forced expiratory maneuver to full exhalation, which may take 10 to 15 seconds when airflow obstruction is present, the forced expiratory volume in 6 seconds (FEV6) may be taken as a surrogate for FVC and used to calculate an FEV1-to-FEV6 ratio, which can be compared with appropriate reference values.


The peak expiratory flow rate achieved during the FVC maneuver cannot be accurately calculated from a spirogram display but is readily seen on the flow-volume display and can be calculated by microprocessors. It can show considerable effort-to-effort variability, even when FEV1 and FVC measurements are nearly identical. A peak flow measurement also can be obtained with simple handheld devices, which are useful for interval follow-up evaluation and for home management of patients who have reactive airway disease but are less accurate and less sensitive than spirometry for screening. Whereas spirographic flow measurements are obtained over a time interval or volume interval, measurements from the flow-volume display or current microprocessors can be reported at specific lung volumes. Maximum flow rates at 50% and 75% of exhaled volume are commonly reported, but nomenclature varies, and the latter may be designated as the flow rate at 25% of remaining VC. Routine use of these measurements is not recommended.


The maximum voluntary ventilation (MVV) is measurable on some office spirometers but is primarily a laboratory measurement. The subject is instructed to breathe deeply and rapidly, typically at 60 to 70 breaths per minute, and the total volume of ventilation over a 12- to 15-second period is extrapolated to liters per minute. Historically, this was the initial dynamic test for obstructive disease; however, it has been supplanted by the forced expiratory maneuver for the diagnosis of airflow limitation. The MVV currently is used as a global assessment of ventilatory capacity in the evaluation of dyspnea, in the interpretation of exercise limitation, in disability assessment, in some preoperative testing, and to evaluate neuromuscular disease of the chest wall and diaphragm.


Reversibility


The usefulness of spirometry in the office or laboratory often is enhanced by the assessment of bronchodilator response. Spirometry is repeated after the administration of an inhaled bronchodilator, waiting 15 minutes after a beta agonist or 30 minutes after ipratropium bromide. An increase of more than 12% in the FEV1 represents a significant response in a patient who has near-normal baseline spirometry results. With more severe obstructive disease, the magnitude of improvement also should be at least 200 mL to differentiate the pharmacologic response from test-to-test variability. FVC often improves in parallel with FEV1. An improvement in FVC by more than 12% and 200 mL, in the absence of a significant change in FEV1, may reflect either an improvement in flow rates after the first second or simply a longer duration of effort.


Although determination of the FEV1/FVC ratio is the most useful test for the diagnosis of airflow limitation, the value may remain the same or even decrease after administration of a bronchodilator, depending on the relative change in its two components, so this ratio is not a useful index of reversibility. Because of its large intraindividual variability, FEF25–75 must show an increase of 30% to 40% to represent a significant bronchodilator effect. Occasionally, this parameter changes little or even decreases despite a clear improvement in FEV1 or, particularly, FVC. This apparent paradox occurs because the bronchodilator has allowed exhalation to continue to a lower RV, so that the 25% to 75% increment is now measured at a lower lung volume, with consequent lower flow rates.


Reference Equations and Limits of Normality


Unlike many laboratory tests, lung function parameters vary greatly with body size and age, so the expected values must be determined on an individual basis. Numerous prediction equations have been derived from spirometric surveys of normal reference populations. Currently accepted studies exclude all smokers as well as persons who have any thoracic or cardiopulmonary disease. Most studies have found that lung function parameters can be predicted on the basis of gender, age, and height, and that the addition of other body size measurements does not improve the accuracy of the equations. The prediction equations give the midpoint of the normal range, which is unfortunately wide for most spirometry measurements.


The lower limit of normal (LLN) must be established from the variability among individual subjects who have the same prediction parameters. The limits of the normal range are chosen to exclude 5% of a normal population; that is, 5% will be misclassified as having disease. In screening a generally healthy population for a rare disease, a borderline-low result is more likely to reflect this misclassification than to represent true identification of disease. However, when spirometry is done for persons at risk for lung disease, or with suggestive symptoms, the probability that a borderline result reflects a true abnormality is much higher. For the spirometry measurements, only low values are considered of concern, so the LLN is set at the 5th percentile of the reference sample. Because the distribution of values in the reference population is adequately symmetric above and below the mean, the 5th percentile LLN often is taken as the predicted value minus 1.645 times the standard error of the estimate (SEE) of the regression equation. The predicted value and the LLN both are readily calculated from the reference data programmed into the spirometry equipment, and both should be reported for comparison against the actual measured value.


Spirometry reference data from a large, systematic survey of the U.S. population (the Third National Health and Nutrition Examination Survey [NHANES III]) are recommended for use in North America. Equations are provided for Caucasians, African Americans, and Mexican Americans ranging in age from 8 to 80 years. No single reference source currently is recommended for use in Europe, but an international effort is under way to merge the NHANES data with those for many reference populations from throughout Europe and elsewhere, to generate a new, widely applicable reference dataset.


The use of a percentage of the predicted value as a lower limit is convenient but less accurate than the 5th percentile, because it causes the normal range to vary with the magnitude of the predicted value, whereas the true variance is similar around small and large values. A lower limit value equal to 80% of the predicted value has been widely used in spirometric interpretation. Although this is a reasonable approximation of the LLN for FEV1 and FVC at the midrange of age and height, it creates an overly broad normal range for younger, taller persons (in whom the true LLN is approximately 82% to 83%), and it is overly sensitive for older or smaller subjects (in whom the LLN may be as low as 73% to 75%). An 80% lower limit is quite inappropriate for FEF25–75, because the normal range extends to 65% of the predicted value in the young and below 50% of predicted in older persons. The normal value for FEV1/FVC varies little with height but does decline progressively with age (e.g., from 0.87 at age 20 to 0.77 at age 70 in females, and from 0.84 to 0.74 in males). The LNN is approximately 0.10 below the predicted ratio. Because the ratio often is expressed as a percentage, reporting this value as a percent of the predicted value is potentially confusing.


Interpretation of Spirometric Abnormalities


Obstructive Impairment


A decrease in airflow is the hallmark of the obstructive diseases; this physiologic diagnosis rests primarily on the demonstration of an FEV1/FVC (or FEV1/VC) value below the age-appropriate LLN. When the FEV1/FVC value is low, even persons with an FEV1 itself as high as 100% of the predicted value (and, necessarily, with a high-normal FVC) are considered to have mild airflow obstruction, which has been shown to be associated with increased morbidity over time. Typically, FVC is normal early in the course of airflow obstruction but is reduced in more severe disease as the RV is increased because of trapped air. The severity of obstructive impairment is best quantified by the decrement in FEV1 as a percent of predicted, because progressive loss of FVC with advanced severity and air trapping limits the reduction in FEV1/FVC. Varying recommendations for categories of severity have been made by different groups, although an apparent consensus suggests that an FEV1 below 50% of the predicted value reflects a “severe” impairment. A simple schema that represents a compromise between one included in the ATS-ERS guidelines and that used in the Global Initiative for Chronic Obstructive Lung Disease (GOLD) guidelines is shown in Table 9-1.


Table 9-1 Suggested Categories of Ventilatory Impairment


Based on FEV1 expressed as a percent of the predicted value. Applicable to obstructive, restrictive, or mixed impairments after diagnosis of airflow obstruction by FEV1/FVC and/or restriction by TLC.


Only gold members can continue reading. Log In or Register to continue

Stay updated, free articles. Join our Telegram channel

Jun 12, 2016 | Posted by in RESPIRATORY | Comments Off on Pulmonary Function Testing

Full access? Get Clinical Tree

Get Clinical Tree app for offline access
Degree of Impairment % Pred FEV1
Mild