LEARNING OBJECTIVES
Learning Objectives
The student will be able to identify the static and dynamic pulmonary function tests (PFTs) commonly performed to establish obstructive and/or restrictive patterns.
The student will be able to describe the operating principle of a whole-body plethysmograph and the measurements obtained from such an apparatus.
The student will be able to explain the use of carbon monoxide to estimate pulmonary diffusing capacity and diseases in which diffusion is altered.
This chapter examines the many practical applications of pulmonary function testing (PFT) for evaluating lung function and disease progression in individual patients, as well as identifying broader public health concerns across populations. The full range of PFT procedures can assess airway resistance, functional residual capacity (FRC) and residual volume, pulmonary diffusing capacity, arterial blood gases (ABGs), exercise capacity, and even energy expenditure. While spirometry was introduced in Chaps. 4 and 6, the more detailed descriptions here include specific diagnostic criteria for grading the severities of obstructive and restrictive lung disease types, as developed by the American Thoracic Society and European Respiratory Society (ATS/ERS) (Table 16.1).
| Confirming a Diagnosis of Primary or Secondary Lung Disease | |
| To evaluate: | New signs of diminished breath sounds, crackles, clubbing, hyperinflation; Symptoms of dyspnea, wheezing, orthopnea, cough, sputum production, chest pain; Abnormal imaging studies and arterial blood gases (hypoxemia, hypercapnia). |
| To measure: | Effects of new systemic diseases on pulmonary function. |
| To screen: | Past and present smokers, and those exposed to second-hand smoke; Individuals with occupational, domestic, or social risk factors. |
| To assess: | Preoperative risk and/or prognosis for lung transplantation, cystic fibrosis (CF), etc. |
| Sequential Monitoring during Management of Known Lung Disease | |
| To assess: | Therapeutic interventions for asthma with bronchodilators, corticosteroids, etc; Complications from systemic disorders (congestive heart failure, sarcoidosis, etc); Adequacy of antibiotics for CF, antiarrhythmics that affect DLCO, etc. |
| To define: | Pulmonary complications from cardiovascular and neuromuscular diseases. |
| To monitor: | Adverse drug reactions when pulmonary toxicity is known or suspected; Mitigation efficacy against occupational or domestic risk factors for lung disease. |
| Evaluating Known or Suspected Disabilities and Impairments | |
| To assess: | Patient suitability for medical, industrial, or vocational rehabilitation programs. |
| To confirm: | Eligibility for insurance or worker’s compensation, and personal injury lawsuits; Compliance with behavioral, pharmacological, or other prescribed activities. |
| Establishing Public Health Policies, Regional Action Plans, and Legislative Agendas | |
| To survey: | Identified or suspected populations at risk for pulmonary disease. |
| To validate: | Subjective complaints of occupational, environmental, or industrial risk or injury; Reference equations derived to predict any related feature of lung function. |
SPIROMETRY AS THE ENTRY POINT TO PULMONARY FUNCTION TESTING
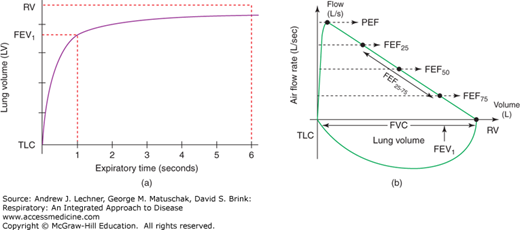
Spirometry is non-invasive, dynamic pulmonary function testing that indirectly assesses airway resistance, notably in medium-sized bronchi. Among the lung volumes estimated by spirometry to distinguish obstructive and restrictive disorders are: vital capacity (VC), forced vital capacity (FVC), forced expiratory volume in one second (FEV1), peak expiratory flow (PEF) rate, and forced expiratory volume over the middle half of expiration (FEF25-75). There are three distinct steps to obtaining a reliable FVC. First, maximal inspiration is measured by the subject inhaling as deeply as possible toward TLC before pausing for 1 second at that volume. Second, the subject exhales maximally as quickly as possible toward RV, continuing for at least 6 seconds, yielding an expiratory flow volume curve or loop [Fig. 16.1 (a)]. Third, the subject immediately inhales again toward TLC to obtain an inspiratory flow volume loop. At least three such efforts, but not more than eight, are performed in a given PFT session, with brief resting intervals using a normal VT between efforts if needed.
FIGURE 16.1
(a) A typical expiratory volume curve plotted against time since starting exhalation. (b) A normal complete flow-volume loop, plotted with flow rate as a function of lung volume from TLC to RV. Note that the expiratory flow-volume curve is plotted above the x-axis and the inspiratory flow-volume loop plotted below it.
With these data, the subject’s largest FVC and FEV1 from any of the attempts are recorded, even if the highest values for FVC and FEV1 do not occur in the same expiratory effort. However, the highest two estimates of FVC and FEV1 should not differ by more than 150 mL to assure an appropriate degree of repeatability. If the patient’s best results differ by more than 150 mL, it is usually recommended that another full test be conducted. Similarly, once the expiratory flow-volume loops have been plotted, the patient’s PEF results should be evaluated to ensure that peak rates (usually near the start of expiration) do not vary by more than 5% between the highest two values. If patient variance exceeds this benchmark, another full test should be completed.
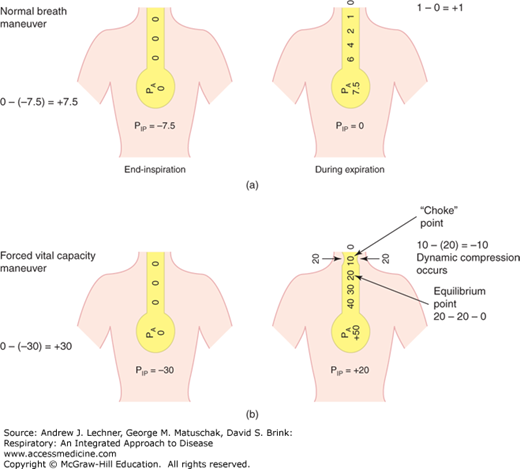
The shape of the flow-volume loop during expiration [Fig. 16.1 (b)] is modified by dynamic airway compression that is effort-independent during expiration (Chap. 6). A “choke point” may exist throughout expiratory flow, so that whenever PIP exceeds PAW, airway collapse can occur (Fig. 16.2), making expiratory flow-volume loops concave. Dynamic compression of airways does not occur during inspiration because PIP < PAW throughout that phase of breathing, stenting the airways and alveoli open.
Comparing a subject’s measured spirometry results and subsequent PFT data (eg, lung volumes and DLCO described below) to appropriate reference values is essential to proper interpretation. Reference values are derived from studies of large, well-defined healthy populations of children and nonsmoking adults, expressed as normal intervals or frequency distributions representing 95% of the sample population. The most common method of analysis is to compare the observed data to the mean reference value, with results expressed both as absolute numeric values and as the percent of predicted value. The lower limit of normal (LLN) describes the lowest 5th percentile according to reference equations based on age, gender, and height, and sometimes ethnicity. Any value below the LLN is deemed clinically abnormal. To determine the severity of obstruction, the FEV1 expressed as percentage predicted is often used (Table 16.2).
CLINICAL CORRELATION 16.1
An FEV1/FVC ratio that is less than normal when FEV1
Stay updated, free articles. Join our Telegram channel

Full access? Get Clinical Tree


