Pulmonary Function Testing
GENERAL PRINCIPLES
• Pulmonary function tests (PFTs) are an integral part of a pulmonary evaluation and management.
• PFTs can be divided into spirometry (measurement of air movement in and out of the lungs), diffusing capacity (measure of gas exchange within the lungs), and plethysmography (measurement of lung volumes).
• The availability of user-friendly pulmonary function testing devices has resulted in widespread use of on-site PFTs by community physicians and an increased need for formal training in collecting and interpreting valid pulmonary function measurements.
• PFTs are best interpreted in relation to an individual’s clinical presentation and not in isolation. All parts of the PFTs should be used when evaluating a patient.
• It is important to remember that PFTs do not make pathologic diagnoses such as emphysema or pulmonary fibrosis. They provide physiologic measurements identifying ventilatory defects and, in doing so, support the existence of the relevant disease process and aid in the evaluation of its treatment.
• This text assists with evaluation of basic spirometry, diffusing capacity, and lung volumes and will allow the reader to identify common ventilatory defects using the data provided by PFTs.
NORMAL VALUES AND REFERENCE RANGES
• The results of PFTs are interpreted by comparing them to reference values representing normal healthy subjects.
• These normal or predicted values take into account many variables, most importantly age, height, gender, race/ethnicity, and to a lesser extent, weight.
• However, they neglect other influencing variables that may have effects, including air pollution, socioeconomic status, and others.
Percent Predicted Method
• Traditionally, but without scientific basis, pulmonary function labs have arbitrarily set normal ranges for each predicted value.
• The lower and upper limits of normal for each predicted value are set as 80% and 120% of the predicted value, respectively.
• The measured values for each pulmonary function variable are compared with the predicted values of each variable and expressed as “percent of predicted.”
• Measured values that fall within the 80–120% range of predicted values are considered normal.
• This method is used in this text because it permits easy instruction and is still in widespread use.
Fifth Percentile Method
• An alternative method for defining normal range of each predicted (normal) value uses a percentile-based approach.
• Using this method, measured values less than the 5th percentile or greater than the 95th percentile within a healthy population are considered abnormal.
• The percentile method can lead to more precise diagnoses of chronic obstructive pulmonary disease (COPD), especially in the elderly.1 The percent predicted method may over-diagnose COPD in elderly patients.2
STANDARDIZATION OF PULMONARY FUNCTION TESTS
• To obtain useful information from PFTs, the adequacy of both the testing equipment and the test results needs to be scrutinized.
• The American Thoracic Society (ATS) publishes guidelines for the standardization of spirometry, including recommendations on equipment calibration, validation of results, measurement of parameters, and acceptability and reproducibility criteria for the data obtained.3,4
• Because most PFTs are obtained from dedicated PFT labs, this text describes the standardized criteria for interpretation of PFT data and excludes details on equipment setup and testing techniques.
• Only when all the acceptability and reproducibility criteria are met can PFTs be interpreted with confidence.
• If acceptability and reproducibility criteria are not met, further testing needs to be performed to assess maximum function.
• Up to eight patient efforts may be performed; after this, patient fatigue affects the data obtained.
• The best results are always used for interpretation.
Acceptability Criteria
PFTs should initially be assessed for acceptability that is best determined by studying the flow-volume loops. Acceptability criteria for PFTs include the following:
• Freedom from artifacts (coughing, glottic closure, early termination leak, variable effort)
• Good starts (i.e., the initial portion of the curve that is most dependent on patient effort is free from artifact)
• Satisfactory expiratory time (at least 6 seconds of expiration on the volume–time curve, or at least 1-second plateau in the volume–time curve)
Reproducibility Criteria
Once the minimum of three acceptable flow-volume loops has been obtained, the reproducibility of the PFTs should be assessed. Reproducibility criteria for PFTs include the following:
• The two largest forced vital capacity (FVC) measurements should be within 0.2 L of each other.
• The two largest forced expiratory volumes in 1 second (FEV1) measurements should be within 0.2 L of each other.
NORMAL PULMONARY FUNCTION TESTS
Flow-Volume Loops
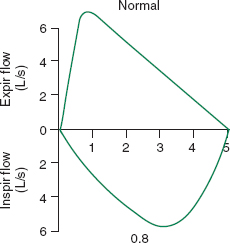
• Normal PFTs are defined by a normal-shaped flow-volume loop (Fig. 3-1).5
• The flow-volume loop is the plot of the FVC maneuver.

FIGURE 3-1. Normal flow-volume loop. (From Hyatt RE, Scanlon PD, Nakamura M. Interpretation of Pulmonary Function Tests. 4th ed. Philadelphia, PA: Lippincott Williams & Wilkins; 2014. © Mayo Foundation for Medical Education and Research.)
• The FVC maneuver involves the patient taking a maximum inspiration followed by a maximum and forceful expiration.
• The flow-volume loop portion of pulmonary function testing is also known as spirometry.
• The expiratory limb of a normal flow-volume loop has a rapid peak and a gradual decline in flow back to zero.
• The inspiratory limb should have a rounded shape.
FEV1 and FVC
• Normal pulmonary function is also defined by the measured values for the FVC and the FEV1.
• FVC is defined as the maximum volume of air that is forcefully exhaled after a maximum inspiration.
• FEV1 is defined as the maximum volume of air exhaled during the first second of the FVC.
• The measured values for FEV1 and FVC are compared to the predicted values for FEV1 and FVC as a percent of predicted. Values of 80–120% are considered normal.
Lung Volumes
• Lung volumes are measured separately from the flow-volume loop.
• Like the FEV1 and FVC, measured lung volumes are compared to the predicted values for that volume as a percent predicted.
• Lung volumes between 80% and 120% are considered normal.
• The most important lung volumes for this discussion are total lung capacity (TLC), residual volume (RV), and slow vital capacity (SVC).
 TLC is defined as the volume of air in the lung after complete maximal inspiration and a value of 80–120% of predicted is normal.
 RV is defined as the volume of air left in the lungs after complete maximal expiration and a value of 80–120% of predicted is normal.
 SVC is defined as the maximal volume of air that can be exhaled with normal effort after a maximum inspiration. (It is similar to the FVC except performed without full force.) A value of 80–120% of predicted is normal.
EVALUATING PULMONARY FUNCTION TEST PATTERNS
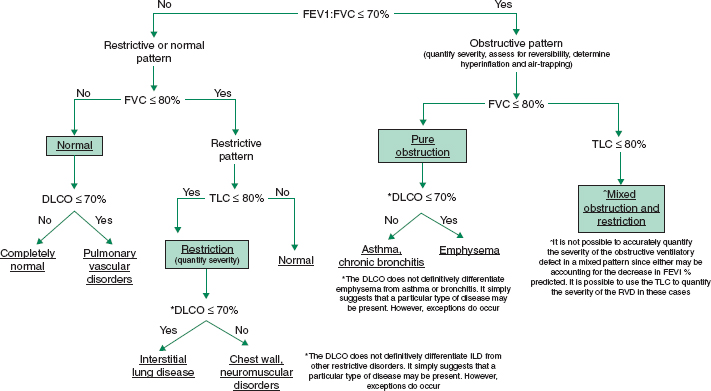
There are normal, obstructive, and restrictive patterns observed on PFTs, which will be discussed in detail. The following algorithm will allow for characterization of the disease pattern (Fig. 3-2).6,7
OBSTRUCTIVE VENTILATORY DEFECTS
• An obstructive ventilatory defect (OVD) exists when there is a disproportionate decrease in the FEV1 when compared to the FVC. An FEV1:FVC ratio of <70% defines an OVD.
• The FVC may be reduced in an OVD, but the FEV1 is always reduced to an even greater degree.
• The ATS cautions against diagnosing an OVD in individuals who have a decreased FEV1:FVC ratio but normal measured FEV1 and FVC, because this pattern can on occasion be seen in healthy subjects.
• OVDs indicate airflow limitation and imply airway narrowing.
• In emphysema, for example, the narrowing is believed to be the result of decreased elastic support of smaller airways owing to alveolar septal destruction, whereas in chronic bronchitis, mucosal inflammation and excess mucus production are the etiologies.
• Once the diagnosis of an OVD has been made, the defect needs to be fully characterized by performing the following:
 Quantifying the severity of the OVD
 Assessing the reversibility of the obstruction
 Determining whether there is hyperinflation
 Determining whether there is air trapping
Quantifying an Obstructive Ventilatory Defect
Quantifying the severity of the OVD is done by comparing the measured FEV1 to the predicted FEV1 as a percent (Table 3-1).
Assessing for Bronchodilator Reversibility
• Assessing for reversibility of an obstruction requires spirometry be performed both before and after bronchodilator administration.
• An increase in the postbronchodilator FEV1 or FVC (calculated from prebronchodilator values) of both ≥12% and ≥200 mL defines a positive bronchodilator response and indicates reversibility of an airway obstruction.
• Thus, reversibility is said to be present when, compared with prebronchodilator values:
 Postbronchodilator FEV1 improves by both 12% and 200 mL, OR
 Postbronchodilator FVC improves by both 12% and 200 mL
• These criteria are best applied when active therapy is not present (e.g., no albuterol for 4 hours).
• The lack of reversibility during a PFT does not prohibit a clinical response to bronchodilator therapy.
• Although asthma is typically a reversible OVD, bronchodilator responsiveness during a PFT is not pathognomonic for asthma.

FIGURE 3-2. Evaluation of pulmonary function tests. DLCO, diffusing capacity for carbon monoxide; FVC, forced vital capacity; TLC, total lung capacity. (Data from Pellegrino R, Viegi G, Brusasco V, et al. Interpretive strategies for lung function tests. Eur Respir J. 2005;26:948–68; and Al-Ashkar F, Mehra R, Mazzone PJ, et al. Interpreting pulmonary function tests: recognize the pattern and the diagnosis will follow. Cleve Clin J Med. 2003;70(10):866, 868, 871–73.)
Stay updated, free articles. Join our Telegram channel

Full access? Get Clinical Tree


