LEARNING OBJECTIVES
Learning Objectives
The student will be able to quantify and contrast the pulmonary and systemic circulations with respect to pressures, flow rates, and vascular resistances.
The student will be able to describe the several vascular perfusion zones of lungs and the forces affecting flow in each.
The student will be able to use Starling’s law of the capillary to explain how interstitial and alveolar edemas occur.
The student will be able to distinguish features and mechanisms underlying cardiogenic, noncardiogenic, and high altitude forms of pulmonary edema.
The rate at which the right ventricle pumps blood, its cardiac output (Q̇) (L/min), must equal that of the left ventricle to avoid an imbalanced distribution of blood volume within the systemic and pulmonary circulations. However, normal pulmonary arterial blood pressure (PPA) averages just 12-16 mm Hg, or about one-eighth of the average blood pressure in the dorsal aorta. Because Ohm’s law states that flow = ΔP/R (Chap. 6), total pulmonary vascular resistance (PVR) normally is also a small fraction of vascular resistance in the much larger systemic circulation. (Diseases for which PVR is significantly increased will be presented elsewhere in this book.) This chapter will focus on factors that affect PVR and thus PPA, realizing that increases in PPA will increase the work required of the right ventricle and the gradient for fluid constituents of the blood to leak out of alveolar capillaries into the surrounding interstitium and airspaces.
PRESSURES AND RESISTANCES TO FLOW IN THE PULMONARY VASCULATURE
The basic features of the adult pulmonary circulation are shown in Fig. 7.1, which emphasizes its parallel nature to systemic flow patterns. A subject’s average PPA is most usually equated to their diastolic pressure (DP) plus one-third of the difference between systolic pressure (SP) and the DP:
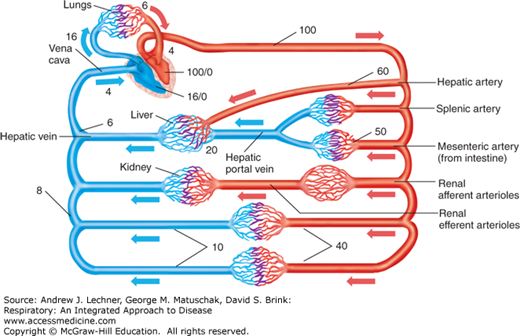
Pulmonary arterial blood flows through the alveolar microvasculature to drain as pulmonary venous blood into the left heart at a left atrial filling pressure = 4-6 mm Hg. Assuming a resting value for Q̇ = 6 L/min and re-arranging Ohm’s law (Q̇ = ΔP/R), normal resting PVR = (16 mm Hg – 4 mm Hg)/6 L, or about 2 mm Hg/L of blood flow. Contrast this value for PVR of 2 mm Hg/L in the low-resistance pulmonary circulation with a resting value for systemic vascular resistance (SVR). This SVR is calculated using the same resting Q̇ and rearrangement of Ohm’s law while estimating mean arterial and venous pressures to be 100 and 4 mm Hg, respectively: SVR = (100 mm Hg – 4 mm Hg)/6 L, or about 16 mm Hg/L of blood flow.
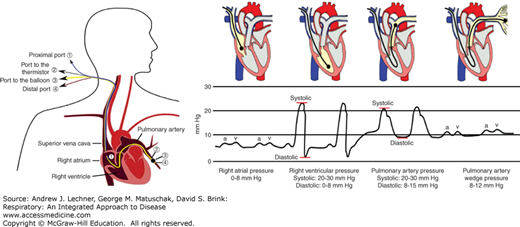
Development of the pulmonary artery catheter (PAC) provided the first direct measure of pulmonary vascular pressures. The standard PAC is 110 cm long and when used for an adult patient is about 2 mm in external diameter. Once the NS-filled PAC is inserted percutaneously through a jugular, femoral, or brachial vein, it is advanced through the right atrium and ventricle until the distal tip rests in a primary branch of the pulmonary artery, while monitoring blood pressure as a guide to tip location (Fig. 7.2). A properly positioned PAC directly measures PPA and, if fitted with a thermistor at the distal tip, estimates Q̇ by the principle of thermal dilution when saline boluses of known volume and temperature are infused through the proximal port. A small circumferential balloon located 1-2 cm from the distal tip can be inflated with about 1.5 mL of air to wedge the PAC tip in the pulmonary arterial branch. Since newly arriving arterial blood cannot flow past a properly wedged PAC, any blood within the arterial segment that is beyond the balloon will flow toward the left heart until its pressure equals that in the draining pulmonary vein. Within 1-2 seconds, the wedged catheter tip measures the pressure in the larger pulmonary veins. Hence, pulmonary wedge pressure (PPW) is equal to pulmonary venous pressure (PPV) which also can be defined functionally as the left atrial filling pressure that was mentioned above.
FIGURE 7.2
Blood pressure measured as a function of anatomic location using a pulmonary artery catheter (PAC). Specific pressure waveforms exist for the right atrium (RA), right ventricle (RV), and main pulmonary artery (PA), as well as for the pulmonary veins (PVs) when the catheter’s balloon is inflated to wedge the PAC tip. Left drawing from Wikipedia open access site; right drawing is from ScribD Web site, also open access.
CLINICAL CORRELATION 7.1
PPW represents left ventricular preload, and is a sensitive diagnostic tool to assess left ventricular decompensation in patients with congestive heart failure. As will be discussed in Chap. 28, a PPW >15-18 mm Hg indicates a low left ventricular stroke volume, causing pulmonary venous blood to stagnate in the left atrium. The previously healthy lung also is affected by elevations in left atrial filling pressure, since increased back pressure in the pulmonary capillaries leads to interstitial swelling and edema within the alveolar compartment.
PULMONARY CAPILLARY RESPONSES TO CARDIAC OUTPUT AND GRAVITY
Systemic perfusion pressures and flow rates through specific organs fluctuate to meet changing needs in work output (muscle), digestion (gut), temperature (skin), or filtration (kidney). Through auto-regulation, these tissues rarely maintain their blood flow as a constant percentage of Q̇ which might range from 5 to 20 L/min. However, such a response is not feasible for the lung, which must accept the entire output of the right ventricle regardless of factors that cause Q̇ to rise or fall. As required by Ohm’s law (Q̇ = ΔP/PVR), the resistance of pulmonary blood vessels must decrease as Q̇ increases if pulmonary hypertension is to be avoided. Studies show that when Q̇ rises, PVR decreases by further distension of previously open arterioles and capillaries, and by recruitment of vessels that are collapsed when Q̇ is lower. Such changes reflect the exceptional compliance of the thin-walled pulmonary vasculature. Thus when Q̇ is low, many pulmonary arterioles and alveolar capillaries either are closed or are flowing at less than maximal diameters. To appreciate this effect requires understanding transmural pressure, the difference between air or fluid forces directed inwardly and outwardly that will attempt to collapse or open a vessel, respectively. Because alveolar capillaries are surrounded mostly by airspace, changes in PA during ventilation will strongly affect this transmural pressure balance and resulting blood flow.
The real-time distribution of lung blood flow has been estimated by a technique similar to that using 133Xenon (133Xe) in airways (Chap. 6). In this case 133Xe dissolved in saline is infused as a bolus via a PAC in the upright subject. When the bolus of dissolved 133Xe reaches alveolar capillaries, labeled Xe rapidly escapes into alveolar air due to its low tissue solubility. Scintillation counters placed at various chest heights detect the 133
Stay updated, free articles. Join our Telegram channel

Full access? Get Clinical Tree


