10 Pulmonary arterial pressures
Echocardiography coupled with Doppler constitutes a validated, non-invasive and easily accessible method for evaluating the pulmonary arterial pressures (PAPs). The pitfalls of using echo Doppler in this scenario relate to:
DETECTION AND QUANTIFICATION OF PULMONARY ARTERIAL HYPERTENSION
Echocardiographic signs
The presence of PAHT may entail a certain number of morphological modifications of the right chambers, which can be identified using echocardiography (Fig. 10.1):
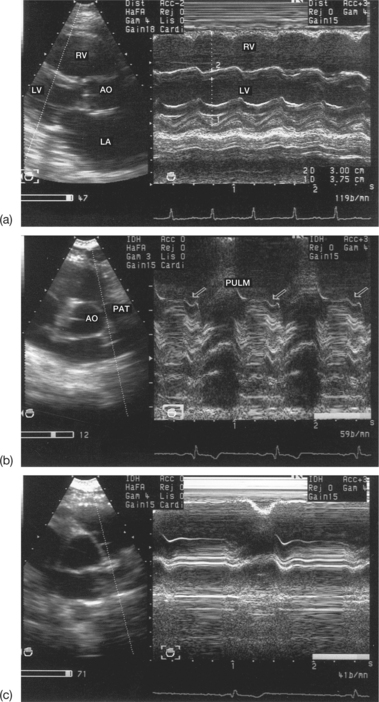
In sinus rhythm, the reduction in, or even the absence of, the pulmonary ‘a’ wave may indicate an increase in the diastolic PAP. In the case of right ventricular failure associated with PAHT, the ‘a’ wave may reappear, due to the increase in the right ventricular filling pressures. Finally, continuous arrhythmia due to atrial fibrillation leads to a disappearance of the pulmonary ‘a’ wave. The partial mid-systolic closure of the pulmonary sigmoid valves observed in PAHT is equivalent to the mid-systolic notch of the pulmonary ejection flow recorded using pulsed Doppler (see page 203). In reality, the pulmonary M-mode signs are only present in frank PAHT (systolic PAP > 50 mmHg and/or average PAP > 20 mmHg).
Doppler signs
The study of the TR and PR flows are unquestionably the two most commonly used methods.
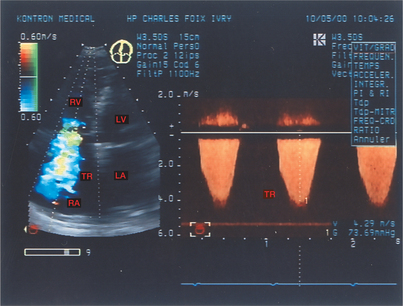
Study of the tricuspid regurgitant flow
On the basis of the TR flow recorded using continuous Doppler, it is possible to evaluate the systolic PAP, using the maximum TR velocity (Box 10.1 and Fig. 10.2).
Pulmonary ejection flow
PAPm > 20 mmHg if acceleration time < 100 ms
Interventricular communication flow (IVC)
The advantage of the TR method is its reliability, as demonstrated by the excellent correlation between the values of the systolic PAP estimated using Doppler and the catheter method. Nevertheless, the TR method does involve errors and has limitations. The pitfalls that arise when using echo Doppler in this situation are technical and/or diagnostic in nature (Box 10.2).
Technical pitfalls
Confusion between a TR flow and a mitral regurgitation flow may occur when using continuous Doppler blind. In this situation, it is necessary to carry out a careful sweep from the mitral flow to the tricuspid flow via the aortic flow. In practice, continuous Doppler guided by 2D colour Doppler is used, making it possible to detect the TR visually.
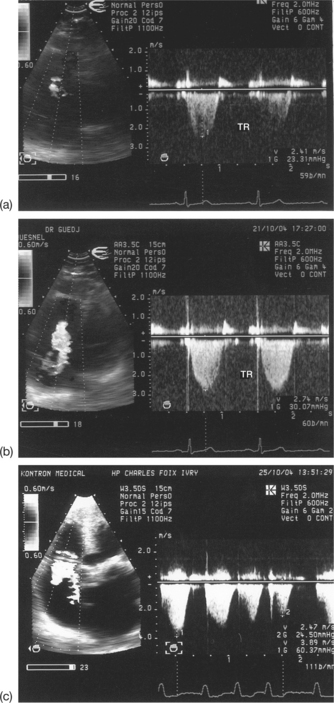
Another technical pitfall arises from poor alignment of the ultrasound beam with the TR jet, leading to an underestimation of the maximum TR velocity, and therefore of the systolic PAP (Fig. 10.3). The ideal solution is to detect the origin of the TR jet by the high velocities in 2D colour Doppler, and then to align the Doppler line of sight over this jet. However, it is still recommended that continuous Doppler be used blind, in order to use as many projections as possible (apical, low parasternal, subcostal) and thus to obtain the highest possible values of the TR velocity. Errors in the measurement of the TR may also arise from a weak Doppler signal due to:
Another cause of errors is linked to a lack of averaging of the maximum TR velocities, in cases where atrial fibrillation causes these velocities to vary, or in cases of major respiratory variations in the TR velocity. These respiratory variations are partly due to the variations in the pulmonary pressures, and partly to the changes in the angle between the ultrasound beam and the TR jet during respiratory movements. In these situations, the TR values should be averaged over 5 to 10 consecutive cardiac cycles.


