Pulmonary Arterial Disease
Normal Anatomy
The main pulmonary artery arises at the base of the right ventricle and extends superiorly for a distance of approximately 5 cm before dividing into the right and left pulmonary arteries. The main, right, and left pulmonary arteries are intrapericardial, with the right pulmonary artery having a longer course and dividing into two lobar branches at the root of the lung (Fig. 3-1).
On computed tomography (CT), the main pulmonary artery is recognizable as the most anterior vascular structure arising from the heart and is characteristically retrosternal at its point of origin. Ranges in the size of the pulmonary arteries in both normal individuals and in patients with pulmonary hypertension have been long established. Kuriyama et al. (1), for example, measured pulmonary artery diameters in both anatomically normal individuals and patients with pulmonary hypertension and showed that in normal persons the main pulmonary artery averaged 24.2 ± 2.2 mm in diameter at a level near its bifurcation. Based on these data, the authors concluded that 28.6 mm [mean ± 2 standard deviations (SD)] should be considered the upper limit of normal for main pulmonary artery diameter. These measurements are best made at a right angle to the long axis of the main pulmonary artery, lateral to the ascending aorta and at the level of its bifurcation (Fig. 3-1). The finding of a dilated main pulmonary artery should raise the suspicion of pulmonary hypertension with a sensitivity of 87% and a specificity of 89% (2). The right and left pulmonary arteries should be of approximately equal size, although the left pulmonary artery appears slightly larger in most persons. In the same study by Kuriyama et al. (1) mentioned previously, the proximal right pulmonary artery measured 18.7 ±2.8 mm in diameter in normal individuals, and the left pulmonary artery measured 21.0 ±3.5 mm. Similar findings have been reported by Ackman-Haimovici et al. (3): In their study of patients undergoing organ transplantation, the left pulmonary artery averaged 21 ±5 mm in those with normal pulmonary artery pressure.
The right main pulmonary artery usually divides into an ascending trunk (truncus anterior) and a descending trunk (interlobar branch) posterior to the superior vena cava (SVC) and anterior to the right main bronchus (Fig. 3-1). The truncus anterior originates from within the pericardium and supplies the right upper lobe, primarily the apical and anterior segments. Although the right interlobar branch largely supplies the middle and right lower lobes, in about 90% of persons, a branch of the interlobar artery supplies the posterior segment of the right upper lobe (4). The interlobar branch of the right pulmonary artery largely lies within the major fissure, thus accounting for its name.
The left pulmonary artery, after passing over the left main bronchus, usually continues as the descending
or interlobar left pulmonary artery, which gives rise to segmental branches of the left upper and lower lobes (Fig. 3-1). On occasion, the left pulmonary artery gives rise to a short ascending branch that divides into segmental branches supplying the upper lobe.
or interlobar left pulmonary artery, which gives rise to segmental branches of the left upper and lower lobes (Fig. 3-1). On occasion, the left pulmonary artery gives rise to a short ascending branch that divides into segmental branches supplying the upper lobe.
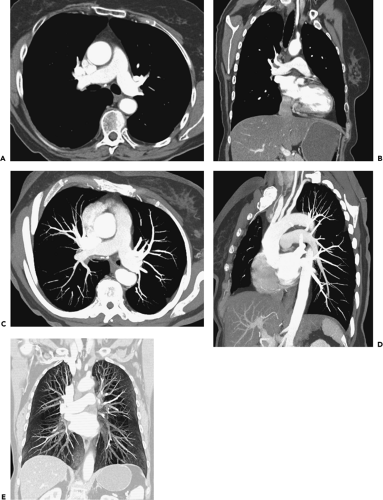 Figure 3-1 Normal pulmonary artery anatomy: visualization techniques. A: Routine contrast-enhanced axial image through the main right and left pulmonary arteries. B: Coronal multiplanar reconstruction (MPR). C: Slightly oblique maximum intensity projection (MIP) image. D: Parasagittal MIP. E: Volume-rendered coronal image. Although standard axial images are generally sufficient to make most diagnoses, in select cases the ability to reconstruct data using a variety of methods may be preferential, as illustrated throughout this chapter. |
Pulmonary arteries divide by dichotomous branching: The two branches may be of approximately equal size, or one branch may be significantly larger than the other. The pulmonary artery has approximately 17 divisions from its bifurcation, with peripheral branches having a diameter of 0.1 to 1.5 mm (5). Pulmonary arteries are divided into two broad categories: those with diameters greater than 0.5 mm (typically including arteries at the subsegmental level), referred to as “elastic” arteries serving as a reservoir for blood ejected by the right ventricle, and those smaller than 0.5 mm in diameter, referred to as “muscular” arteries, which accompany peripheral airways to the level of the terminal bronchioles.
The branching patterns of lobar, segmental, and subsegmental pulmonary artery branches show considerable variation. Although it is typical for the lobar, segmental, and subsegmental bronchi to be paired with a pulmonary artery branch, the origins of these branches are variable, and supernumerary or accessory artery branches supplying a lobe or segment are often present. Variation is more common in the upper lobes than in the lower lobes. To identify a specific lobar or segmental artery branch, it is usually necessary to identify its associated bronchus.
When less than 0.15 mm in size, pulmonary arteries are properly labeled arterioles (6). In fact, pulmonary arterioles as small as 300 mm in diameter can be seen on high-resolution CT (7); these vessels roughly correspond to acinar arteries, being the 16th generation of branches at the level of the terminal and most proximal respiratory bronchioles. However, these vessels are visible only as soft tissue attenuation structures on lung window scans, and their opacification is not visible after contrast administration. An increase or a decrease in the size of small peripheral pulmonary arteries is sometimes seen in patients with pulmonary vascular disease associated with increased or decreased blood flow.
Acute Pulmonary Embolism
The diagnosis of few entities has been as markedly affected by advances in imaging technology as pulmonary thromboembolic disease. Over the past decade CT has evolved as the imaging modality of choice in most institutions for the initial evaluation of patients with suspected pulmonary emboli (PE). An estimated 500,000 cases of acute pulmonary embolism occur in the United States annually, associated with an overall mortality of 5% to 10%. Autopsy data suggest that although the antemortem detection rate of PE has been steadily increasing in every decade since the 1950s, as late as the 1990s the rate of antemortem detection was still less than 50% (8). Nonetheless, although the likelihood of diagnosing PE has been significantly improved by the widespread availability of CT pulmonary angiography (CTPA), initially with single-detector and now, more commonly, multidetector CT (MDCT), it remains probable that a large number of cases still go undetected prior to death (9,10). This is of particular importance, as, compared with the overall case fatality rate for pulmonary embolism, the mortality of untreated pulmonary embolic disease approximates 30%, similar to the mortality in those patients with massive pulmonary embolism (8,9,10,11,12,13,14).
Clinical Evaluation
Only approximately one half of patients with thromboembolism present with one of the cardinal signs of PE—namely chest pain, dyspnea, or hemoptysis (11). Additionally, although laboratory evidence of hypoxia, a widened alveolar–arterial gradient, hypocapnia, or electrocardiographic (ECG) abnormalities are insufficiently specific to establish the diagnosis, neither do normal values preclude the diagnosis (15,16,17,18). Although the Wells criteria (Table 3-1) (19,20) combining clinical and laboratory tests into low, medium, or high clinical probability for establishing PE have been shown to correlate with ventilation/perfusion (V/Q) scans, these remain suboptimal for diagnosis in individual cases. In view of the high mortality of both late or missed diagnosis, it is imperative that a combination of high clinical suspicion, particularly in patients predisposed to thromboembolism, and timely use of appropriate testing remain necessary to exclude the diagnosis (21).
D-Dimer Evaluation
The D-dimer test evaluates the presence of fibrinolytic degradation products produced at the site of venous thrombosis (22). The traditional enzyme-linked immunosorbent
assay (ELISA) and new quantitative tests, including both rapid ELISA and turbidimetric latex examinations, have proved more accurate and sensitive for the detection of thromboembolic disease than prior qualitative and semiquantitative tests such as earlier rapid ELISA, latex, and whole blood agglutination techniques and should preferentially be obtained when available.
assay (ELISA) and new quantitative tests, including both rapid ELISA and turbidimetric latex examinations, have proved more accurate and sensitive for the detection of thromboembolic disease than prior qualitative and semiquantitative tests such as earlier rapid ELISA, latex, and whole blood agglutination techniques and should preferentially be obtained when available.
Table 3-1 Clinical Prediction Rules: Wells Criteria | ||||||||||||||||||
|---|---|---|---|---|---|---|---|---|---|---|---|---|---|---|---|---|---|---|
| ||||||||||||||||||
Although thresholds for quantitative D-dimer assays vary among published reports, as documented in a meta-analysis of 41 studies involving more than 6,000 patients, a threshold of greater than 500 ng/mL has gained widespread acceptance with a demonstrated sensitivity of 90% to 95% (22a). Unfortunately, low specificities, averaging between 40% and 45% in the same analysis, reflect the fact that D-dimer levels may be elevated in numerous other diseases (Table 3-2). Although a positive D-dimer test in the absence of clinical suspicion should not be a cause for further investigation to exclude pulmonary embolism, not surprisingly in clinical practice routine performance of D-dimer testing has been documented to actually increase the number of studies performed to exclude PE (23,24,25).
In our experience, the most appropriate clinical use of D-dimer testing is to exclude pulmonary thromboembolic disease given the high negative predictive values reported, in most studies ranging between 92% and 100% (26,27). However, it is important to recognize that there are occasional causes of a false-negative D-dimer test (Table 3-2). It is also worth emphasizing that the utility of D-dimer testing has largely been established in outpatients and that the use of this test to exclude thromboembolic disease in inpatients is not as well validated (28,29).
Use of D-dimer testing is especially problematic during pregnancy as there is normally a progressive increase in D-dimer levels. In fact, in a series of normal pregnant patients, 75% still had normal D-dimer levels by 14 weeks and 50% had normal levels at 19 weeks (30,31,32). D-dimer evaluation, therefore, may still prove useful in excluding embolism during the early stages of pregnancy.
Several retrospective studies have suggested that negative D-dimer tests may significantly reduce the number of negative CTPAs performed, with estimates ranging between 36% and 60% (33,34). For example, in a study of 247 patients with D-dimer values less than 1,000 ng/mL, Abcarian et al. (33) demonstrated that all had negative CTPAs and normal 3-month follow-up. Similarly, Dunn et al. (35) reported a negative predictive value of 99.6% for negative D-dimer evaluation alone in more than 1,000 emergency department patients presenting with a suspicion of PE.
Table 3-2 Thromboembolism Exclusion by D-Dimer: False- and True-Positives | ||||||||||||||
|---|---|---|---|---|---|---|---|---|---|---|---|---|---|---|
| ||||||||||||||
More recently, Kelly and Hunt (36) reviewed several prospective clinical outcome studies in a predominantly outpatient population and demonstrated that a combination of low-intermediate clinical suspicion and a negative D-dimer test safely obviated further testing in 47% to 51% of patients, with rates of subsequently documented thromboembolic disease at 3 months occurring in only 0.2% to 0.4% of cases.
Based on these data, in our judgment there is now sufficiently strong evidence to support the utility of routine D-dimer testing to reduce the number of unnecessary CTPA studies with their associated radiation exposure (37). However, appropriate imaging studies to exclude pulmonary embolism should still be obtained when there is high clinical suspicion of disease, particularly in elderly or inpatient populations.
Imaging Evaluation
Choice of Modality
Chest radiographs may demonstrate several classic signs such as regional oligemia (Westermark sign), peripheral basilar pleural-based wedge-shaped areas of opacity (Hampton hump), or enlargement of the central pulmonary arteries (Fleischner sign). However, these features are neither sensitive nor specific for the diagnosis of PE (38,39). The use of chest radiographs, however, remains important in the determination of other alternative diagnoses such as pneumothorax, lobar collapse, congestive cardiac failure, or rib fractures that may cause similar symptoms on presentation.
Currently, CTPA, especially with the widespread availability of MDCT scanners, has evolved in most institutions into the definitive diagnostic modality for the evaluation of both acute and chronic PE. MDCT is noninvasive, easily scheduled, rapidly performed, and highly accurate. Its major advantage compared with V/Q imaging, the most often used alternative imaging modality, is that unlike V/Q scans that provide only indirect evidence of pulmonary embolism, MDCT allows direct visualization of intra-arterial clot. Compared with pulmonary angiography, MDCT is less invasive and provides a global assessment of the entire thorax (40,41,42). In a study of 510 patients reported by van Strijen et al. (41), although CT demonstrated PE in 24% of patients, it also proved of value by establishing alternative diagnoses in an additional 26% (Fig. 3-2).
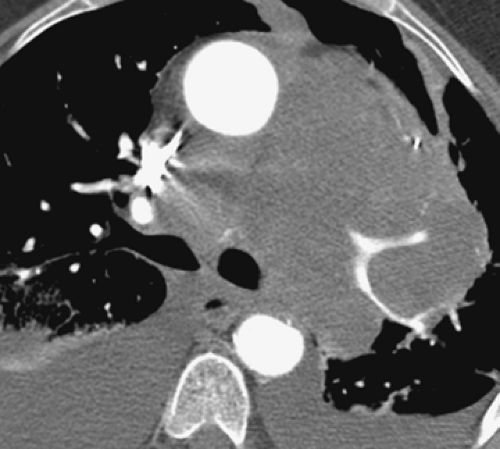 Figure 3-2 Tumor infiltration of the pulmonary arteries. CT pulmonary angiogram (CTPA) in a patient presenting with acute dyspnea and suspected pulmonary embolism demonstrates the presence of extensive tumor infiltration into the left hilum and mediastinum, encasing and severely narrowing the left main pulmonary artery due to documented small cell carcinoma of the lung. Note the presence of bilateral pleural effusions, as well. |
Computed Tomography of Pulmonary Emboli
Computed Tomography Pulmonary Angiography Versus Ventilation/Perfusion Imaging and Angiography
CT Versus V/Q Imaging
V/Q perfusion imaging is considered a sensitive but nonspecific examination for the evaluation of PE. In the original Prospective Investigation on Pulmonary Embolism Diagnosis (PIOPED) I study (43), an abnormal study was associated with a 98% sensitivity for the detection of pulmonary embolism; however, as only 14% had a normal or near normal study, specificity proved exceedingly low (10%). Indeed, in this study the identification either of a high probability (87% incidence of PE) or normal/near normal studies (4% incidence of PE) occurred in only 27% of cases. Only 13% of patients with PE had a high probability study. In a total of 73% of cases, studies were interpreted as either of low or intermediate probability (14% and 30% PE risk, respectively) and therefore deemed clinically inconclusive, requiring further diagnostic evaluation (44). Although the introduction of revised PIOPED criteria (45) has reduced the number of intermediate examinations by approximately 15% (46), the number of residual nondiagnostic studies coupled with only a 70% to 75% interobserver agreement for intermediate probability studies remains a significant limitation of this technique (43).
Several comparative studies have demonstrated the diagnostic superiority of CT over V/Q imaging (47,48,49,50). CT directly identifies pulmonary arterial filling defects, whereas V/Q imaging provides only indirect evidence of clot without precise anatomic correlation. In one study of 68 patients, of 185 perfusion defects identified on perfusion imaging, only 16% were found to positively correlate with angiographic findings (51). Although only 10 of 35 segmental or larger mismatches proved to be due to angiographically identified emboli, 43 segmental mismatches proved to have no angiographic correlate at all.
The advantage of CT versus V/Q imaging was established early, even in the era of single-detector CT (SDCT). In one representative comparison, SDCT demonstrated improved sensitivity, specificity, negative predictive value (NPV) and positive predictive value (PPV) (with all test measurements ranging between 94% and 97%) when compared with V/Q imaging (with corresponding measurements ranging between 74% and 82%). Additionally, the interobserver agreement of CTPA (κ = 0.72) was significantly higher than that of V/Q imaging (κ = 0.22) (48). In a similar study van Rossum et al. (47) evaluated 123 patients undergoing both V/Q and CTPA imaging, separately evaluating these tests in association with both clinical and chest radiographic findings. Compared with V/Q imaging, CT resulted in fewer inconclusive studies (8% vs. 28%), higher sensitivity (75% to 49%), higher specificity (90% to 74%), and a near doubling of established alternative diagnoses (93% to 51%). As important, of 35 indeterminate V/Q studies, CT definitively identified 5 normal patients and 13 with PE, and provided alternative diagnoses in an additional 11 patients.
CT Versus Pulmonary Angiography.
Conventional pulmonary angiography has long been considered the “gold standard” for the evaluation of PE (52,53). However, in the era of easily acquired MDCT exams, this is no longer considered axiomatic. In comparison to SDCT in an animal model of artificially injected subsegmental PE, no significant difference in sensitivity was identified (both 87%) between CT and angiography (54). As noted previously, in comparison angiography CT has the advantage of being noninvasive and, more importantly, in a large percentage of cases, providing alternative diagnoses. Despite these advantages, it is worth emphasizing that, although invasive, the significant complication rate of pulmonary angiography is often overestimated by clinicians, in most studies on the order of only 1% to 2% (44,55). As a consequence, pulmonary angiography is underutilized in most institutions. In fact, loss of operator experience will likely contribute to the already well established poor interobserver agreement for angiography. Although agreement among observers is acceptable for emboli within large central vessels (81% to 90%), there is poor two-reader agreement at the subsegmental level (45% to 66%), further diminishing to 16% when three readers’ interpretations are compared (43,56,57). Not surprisingly, the traditional role of pulmonary angiography as a “gold
standard” is evolving, now typically acquired only in select cases in which all other imaging studies remain equivocal, usually in the setting of a high clinical probability of pulmonary embolism. In this context, selective angiography in particular should be considered to clarify indeterminate CT findings involving single vessels, with the advantage of lessening interobserver variability while likely reducing the complication rate of the procedure.
standard” is evolving, now typically acquired only in select cases in which all other imaging studies remain equivocal, usually in the setting of a high clinical probability of pulmonary embolism. In this context, selective angiography in particular should be considered to clarify indeterminate CT findings involving single vessels, with the advantage of lessening interobserver variability while likely reducing the complication rate of the procedure.
Diagnostic Accuracy of Single-Detector Computed Tomography Pulmonary Angiography
Several meta-analyses have been conducted on the performance of SDCT for the detection of PE. Many of these are limited by their incorporation of both early and newer single-detector hardware and the utilization of differing imaging protocols and gold standards for establishing the diagnosis of pulmonary embolism. Nevertheless, these studies demonstrate that, even allowing for these differences, the sensitivity and specificity for detecting main, lobar, or segmental PE range between 80% and 100% (58,59,60). In distinction, the sensitivity of SD CTPA for the detection of subsegmental PE, although variable, is consistently low (25% to 75%) (59,61). In a meta-analysis of published data from 1986 to 1999, Rathbun et al. (60), incorporating both subsegmental data as well as data from earlier studies performed with suboptimal 5-mm sections, documented sensitivities and specificities ranging between 53% and 100% and 81% and 100%, respectively (60). Based on these data, both the American College of Chest Physicians and the American Thoracic Society concluded that SD CTPA was an insufficient clinical test to exclude pulmonary embolism, particularly when there was high clinical suspicion (62,63), leading to the recommendation that pulmonary angiography still be performed in equivocal or indeterminate cases.
Diagnostic Accuracy of Multidetector Computed Tomography Pulmonary Angiography
Compared with SDCT, MDCT provides markedly improved temporal and spatial resolution, resulting in more consistent demonstration of subsegmental vascular anatomy. This is due both to the ability to scan a larger volume of the lungs with thinner collimation and to improved resolution of individual sections. As documented in two separate studies, Remy-Jardin et al. demonstrated that even with SDCT, a reduction of collimation from 3 to 2 mm increased the percentage of subsegmental arteries adequately visualized from 37% to 43% to 61% to 65%, respectively (64,65) (Fig. 3-3). Raptopoulos and Boiselle (66) demonstrated that the increased speed of MDCT using 2.5-mm sections compared with SDCT using 3-mm sections resulted in improved visualization of subsegmental arteries. In a comparison of SD CTPA using 3-mm sections and MD CTPA using both 2.5-mm and 1.25-mm sections, Patel et al. (61) demonstrated significant improvement in reader sensitivity for the evaluation of subsegmental PE (between 37% and 39%, 53% and 56%, and 71% and 76%, respectively). The same authors also documented improved interobserver agreement using thinner reconstructions (3 mm vs. 1.25 mm) at both the segmental (κ = 0.79–0.80 vs. 0.47–0.75) and subsegmental (κ = 0.71–0.76 vs. 0.28–0.54) levels. In a similar study comparing different reconstruction thicknesses in multidetector PE, Schoepf et al. (67) demonstrated a 40% increase in sensitivity for subsegmental PE detection as the slice thickness was reduced from 3 mm to
1 mm with concomitant improvement of interobserver agreement.
1 mm with concomitant improvement of interobserver agreement.
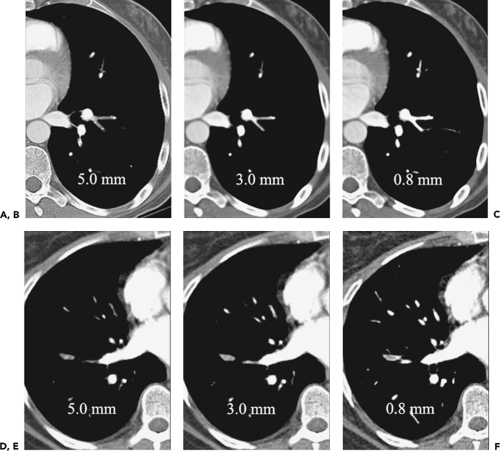 Figure 3-3 Pulmonary emboli (PE) diagnosis: role of thin collimation. Two different patients with suspected PE in vessels oriented in the axial plane reconstructed at 5 mm (A and D), 3 mm (B and E), and 0.8 mm thickness (C and F), respectively. Note that the use of thinner sections not only improves the detection of small PE (E and F) but also reduces the incidence of false-positive studies by eliminating partial volume averaging (A–C). |
To date, numerous studies have corroborated significantly improved detection of subsegmental emboli (75% to 95%) using MDCT, with overall sensitivities and specificities ranging between 90% and 100%, respectively (50,68,69). It is worth emphasizing, however, that most of these involve only relatively small numbers of patients. Nor do they incorporate advanced image processing techniques, such as multiplanar reconstruction (MPR) or maximum intensity projection (MIP) images, now easily reconstructed from isotropic volumetric datasets obtained with state-of-the-art CT scanners (Fig. 3-4).
Isolated Subsegmental Pulmonary Emboli
The detection of small subsegmental PE will largely be immaterial in a patient treated for concomitantly detected central PE. Therefore, suboptimal detection of subsegmental PE by either SDCT or MDCT will be of potential clinical significance only when embolic disease is limited to vessels of this caliber. In fact, the incidence of isolated subsegmental PE is unknown, variously reported as occurring in between 6% and 36% of cases (43,70,71) (Fig. 3-5). It has been suggested that some small emboli may be normally filtered physiologically by the lung capillary bed to prevent systemic embolization (72) (Fig. 3-6).
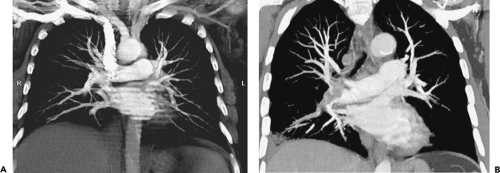 Figure 3-4 Pulmonary emboli (PE) diagnosis: role of maximum intensity projection images (MIPs). A: Coronal MIP reconstruction from a contrast-enhanced PE study performed on a 4-detector CT scanner demonstrates the appearance of normal vascular anatomy. B: Coronal MIP reconstruction in a different patient than in A from a contrast-enhanced PE study on a 16-detector CT scanner demonstrates improved MIP reconstruction quality with improved visualization of peripheral subsegmental pulmonary arteries (compare with A). Note that in this case there is an embolus in the right main pulmonary artery associated with an infarct in the right lower lobe, the CT equivalent of a Hampton hump. |
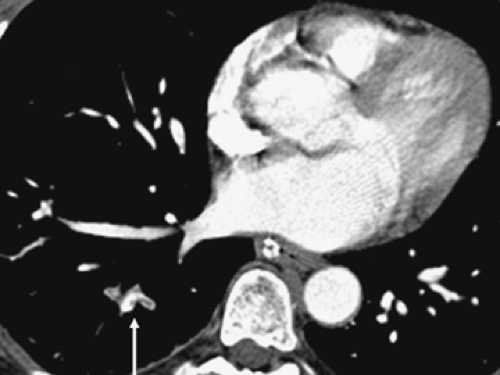 Figure 3-5 Pulmonary emboli diagnosis: use of thin collimation. Two-millimeter axial reconstruction shows to good advantage a small isolated subsegmental pulmonary embolus in the posterior segment of the right lower lobe (arrow). Note that in this case thrombus straddles an arterial bifurcation. Points at which arteries divide are especially worth close scrutiny, as they are frequent sites in which emboli lodge. |
What has yet to be established is whether there is clinical benefit to treating patients in whom isolated small emboli are identified, specifically to lessen the otherwise increased risk for hemodynamic compromise or progression to chronic thromboembolic disease (73). In this regard, it should be noted that in the original PIOPED study, 20 patients with isolated subsegmental emboli diagnosed by the expert review panel had initially been viewed as normal: Of these patients, only 2 had subsequent PE documented, only 1 of which proved fatal (74). In another study designed to address these issues using CT, 25 of 61 patients with isolated subsegmental PE received no further treatment, with no long-term adverse effect. At present, the decision to treat small subsegmental PE varies among clinicians, depending on the individual patient’s cardiovascular reserve and associated comorbid conditions. Although still controversial, the finding of an isolated subsegmental pulmonary embolus on CT at the least should prompt a thorough investigation to identify potential sources of thrombus that, left untreated, might result in subsequent emboli (68,69,73).
Negative Computed Tomography Pulmonary Angiography Studies
As important as determining the sensitivity of CT is evaluating the clinical importance of a negative CTPA study. Numerous studies to date have concluded that adequately performed CTPA is sufficient for the exclusion of PE, with negative predictive values of greater than 98%, comparable to or better than a negative pulmonary angiogram or normal V/Q studies, respectively (75,76,77,78). This is so, despite the fact that adequate visualization of all subsegmental pulmonary arteries is rarely accomplished even using state-of-the-art multidetector scanners. It is worth emphasizing, however, that these studies typically involved only a relatively small number of cases, limiting interpretation of these data.
That identification of isolated subsegmental emboli with CT may not be of great clinical importance is further supported by studies comparing the clinical outcome of
patients evaluated with single versus multidetector CT scanners. In one comparative study of SD CTPA versus MD CTPA, Remy-Jardin et al. (79) evaluated two consecutive groups of patients with suspected PE. Using a single-detector scanner, subsegmental vessels could be adequately visualized in only 13% of 125 patients, compared with 57% of subsegmental vessels identified in a separate but clinically similar cohort of 134 patients evaluated by MDCT. In both series, patients with a negative CTPA examination were not treated but closely monitored with follow-up clinical evaluations in 3 months to exclude potentially recurrent PE. Surprisingly, the NPV for both SDCT and MDCT approached 100%, suggesting that although MDCT improves visualization of subsegmental arteries, allowing more isolated subsegmental PE to be identified, these are unlikely to be clinically significant, especially in patients in whom cardiopulmonary reserve is well maintained.
patients evaluated with single versus multidetector CT scanners. In one comparative study of SD CTPA versus MD CTPA, Remy-Jardin et al. (79) evaluated two consecutive groups of patients with suspected PE. Using a single-detector scanner, subsegmental vessels could be adequately visualized in only 13% of 125 patients, compared with 57% of subsegmental vessels identified in a separate but clinically similar cohort of 134 patients evaluated by MDCT. In both series, patients with a negative CTPA examination were not treated but closely monitored with follow-up clinical evaluations in 3 months to exclude potentially recurrent PE. Surprisingly, the NPV for both SDCT and MDCT approached 100%, suggesting that although MDCT improves visualization of subsegmental arteries, allowing more isolated subsegmental PE to be identified, these are unlikely to be clinically significant, especially in patients in whom cardiopulmonary reserve is well maintained.
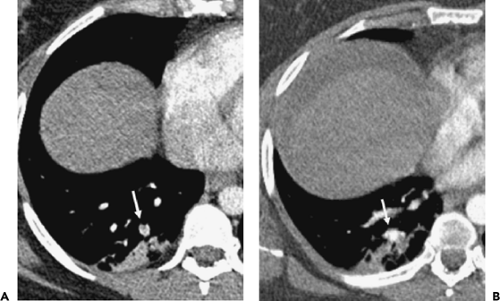 Figure 3-6 Pulmonary emboli diagnosis: subsegmental pulmonary emboli. A: Enlargement of an axial section through the right lower lobe shows a small isolated subsegmental embolus (arrow) associated with peripheral atelectasis. In this case, anticoagulation was withheld. B: Enlargement of an axial image at the same level as shown in A, obtained 48 hours later, shows spontaneous resolution of the suspected embolus. Apparent spontaneous resolution of this embolus may reflect normal filtration of small emboli by the lung. |
Prospective Investigation on Pulmonary Embolism Diagnosis Study
To address issues relating to the relatively small sample size of prior CT studies, the Prospective Investigation on Pulmonary Embolism Diagnosis II (PIOPED II) study evaluated the value of MDCT in diagnosing pulmonary thromboembolic disease in a total of 825 patients with suspected PE, using a variety of 4-, 8-, and 16-detector CT scanners supplemented by CT venography (CTV) (80). The accuracy of CT was established using composite standards for both diagnosing and excluding pulmonary embolism. A positive diagnosis required one of the following: a high probability V/Q lung scan in a patient with no prior history of PE, a positive digital subtraction angiogram (DSA), or a positive venous ultrasound without a history of prior deep venous thrombosis (DVT) at that site and a nondiagnostic V/Q scan. In distinction, exclusion of PE required one of the following: a negative DSA, a normal V/Q scan, or a low or very low probability V/Q scan accompanied by a clinical score using the Wells criteria <2 (Table 3-1) and a negative venous ultrasound.
In 51 (6%) of 825 cases, CT studies were interpreted by a panel of two certified expert readers as inconclusive, usually due to a combination of suboptimal contrast enhancement and motion artifacts. Of the remainder, CT sensitivity was 83% (95%, CI 76 to 92), and specificity was 96% (95%, CI 93 to 97). The likelihood ratio for a positive study was 19.6 (95%, CI 13.3 to 29.0) and the likelihood ratio for a negative study was 0.18 (95%, CI 0.13 to 0.24). CT had a positive predictive value (PPV) of 86% (95%, CI 79 to 90) and a negative predictive value (NPV) of 95% (95%, CI 92 to 96). When assessed by the size of involved pulmonary arteries, the PPV was 97% for emboli in main and lobar arteries, 68% for segmental arteries, and 25% for subsegmental arteries, although in the latter group only eight subsegmental emboli altogether were diagnosed. When CTV was added to the evaluation, CT sensitivity improved to 90%, with a specificity of 95%, a PPV of 85%, and a NPV of 97%, respectively. Of 105 patients with a positive CTV, only 3% involved the inferior vena cava (IVC) or pelvic veins. Overall, CT had both positive and negative predictive values of 96% when paired with concordantly high or low clinical probability, decreasing to 92% with an intermediate clinical assessment of PE.
Based on these data, the following conclusions were reached: (a) that the PPV and NPV of CT are high when there is clinical concordance regarding the probability of PE but that the false-negative rate of 17% for MD CTA alone indicates the need for additional testing, especially when there is a high clinical suspicion of PE, and (b) that the addition of CTV is warranted, given a statistically significant improvement in sensitivity when compared with MD CTA alone. Surprisingly, these conclusions are not dissimilar to those obtained from reviews of studies using single-detector scanners in recommending that, in cases with discordant CT and clinical findings, additional imaging studies remain necessary.
A number of limitations should be noted regarding PIOPED II. In addition to the need to rely on composite reference standards given ethical concerns regarding requiring DSA in all cases, most studies were performed on four-detector CT scanners without requiring the use of bolus tracking. Similarly, there was no requirement for routinely obtaining D-dimers. Perhaps most important, no data were provided regarding the utility of CT for establishing alternative diagnoses. In this regard, most studies were performed on outpatients, presumably with less extensive pulmonary and parenchymal diseases that might otherwise have limited the utility of V/Q imaging. Although it is likely that these data and recommendations will set the standard for the use of MDCT for diagnosing PE for the foreseeable future, it is also likely that these conclusions will prove controversial, particularly the significance of a well-performed negative CT study and the need to perform concomitant CTV (81).
Computed Tomography Technique
It cannot be overstated that accurate evaluation of patients with suspected pulmonary embolism requires meticulous scan technique. In addition to choice of scanner, factors that affect visualization of the pulmonary arterial tree include, in particular, choice of scan protocol, method and rate of contrast administration, and image reconstruction algorithm (82,83). Proposed scan protocols for different types of scanners are summarized in Table 3-3.
Scan Protocols
Key to optimizing scan quality is the acquisition of the thinnest possible sections allowable during the short period of peak opacification of the pulmonary arterial
vasculature (64). With single-detector scanners it is necessary to reduce z-axis coverage to the central vasculature to permit thin collimation to be utilized during a reasonable breath-hold. A second acquisition, therefore, is typically necessary to complete the examination with additional images obtained through the apices and lung bases. In this setting, it has been suggested that images be acquired in a caudocranial direction to minimize respiratory motion artifacts, which are generally greatest through the lower lobes.
vasculature (64). With single-detector scanners it is necessary to reduce z-axis coverage to the central vasculature to permit thin collimation to be utilized during a reasonable breath-hold. A second acquisition, therefore, is typically necessary to complete the examination with additional images obtained through the apices and lung bases. In this setting, it has been suggested that images be acquired in a caudocranial direction to minimize respiratory motion artifacts, which are generally greatest through the lower lobes.
Table 3-3 Computed Tomography Pulmonary Embolism Protocols | |||||||||||||||||||||||||||||||||||||||||||||||||||||||||||||||||||||||||||||||||||||||||||||||||
|---|---|---|---|---|---|---|---|---|---|---|---|---|---|---|---|---|---|---|---|---|---|---|---|---|---|---|---|---|---|---|---|---|---|---|---|---|---|---|---|---|---|---|---|---|---|---|---|---|---|---|---|---|---|---|---|---|---|---|---|---|---|---|---|---|---|---|---|---|---|---|---|---|---|---|---|---|---|---|---|---|---|---|---|---|---|---|---|---|---|---|---|---|---|---|---|---|---|
| |||||||||||||||||||||||||||||||||||||||||||||||||||||||||||||||||||||||||||||||||||||||||||||||||
In distinction, with newer generation multidetector scanners neither partitioning of data acquisition nor scanning in a caudocranial direction is required, as the entire chest can be evaluated using thin collimation during a single breath-hold acquisition. Although the use of ECG gating is technically feasible, this has not been shown to confer any diagnostic advantage (84).
CTPA can be combined with CT leg venography, as recommended by PIOPED II, especially in patients in whom ultrasound is impractical (85,86). Unfortunately, at present there is no consensus regarding the optimal method for performing CTV. One approach that has been advocated involves obtaining contiguous 5-mm sections, starting 2 to 3 minutes following contrast administration, beginning at the superior aspect of the calf and proceeding in a caudocranial direction through the proximal IVC (87). The utility of this approach—in particular, the need to obtain images through the pelvis with resultant added radiation exposure—remains uncertain (88). The finding of DVT in a patient with PE is unlikely to alter management unless there is an isolated subsegmental pulmonary embolus for which anticoagulation might not otherwise be initiated. In distinction, in patients evaluated for potential pulmonary embolism with negative CTPA examinations, the additional finding of asymptomatic lower extremity clot results in higher CT sensitivity, usually leading to alteration of patient management, including, in select cases, insertion of an IVC filter (89).
Contrast Media Administration
Choice of iodinated contrast media concentrations in the range of 300 to 370 mg I/mL has little effect on diagnostic image quality. It should be noted that in patients in whom iodinated contrast media is contraindicated, one alternative is administration of gadolinium contrast media at a dose of 0.4 mmol/kg (90). There is, however, some ongoing debate about the nephrotoxicity of such high gadolinium dosages in patients with impaired renal function (90a).
Both the volume and rate of administration of intravenous iodinated contrast media is increased when compared to routine thoracic CT examinations. Administration
by pressure injector at 3.5 to 5.0 mL/second necessitates the use of an 18 G or greater peripheral venous catheter and precludes the use of both indwelling peripherally inserted central catheter (PICC)/Mediport catheters or wider bore central venous access catheters. The former may be damaged by rapid contrast administration, whereas the latter may induce an intracardiac catheter “whip” or fluid “jet” effect, potentially damaging the cardiac endothelium or valves. Typically, 150 mL of intravenous contrast media is administered for studies performed with single-detector or earlier four-slice scanners; however, this volume may be reduced to 120 mL or less for newer generation MDCT scanners owing to their faster data acquisition. It is important to note that by suspending the injection as soon as the scanner has completed scanning the central vasculature, the volume of injected contrast may be significantly reduced. If a dual injector is available, a saline chaser may be utilized to significantly reduce the volume of contrast required to perform the examination (91,92,93,94). This is because intravenous contrast administered later in the injection does not contribute to vascular arterial enhancement but is required merely to maintain both the forward motion of the previously administered contrast and the compact nature of the bolus, maximizing the enhancement peak. Clearance of dense contrast media from the central veins may also reduce artifacts (91).
by pressure injector at 3.5 to 5.0 mL/second necessitates the use of an 18 G or greater peripheral venous catheter and precludes the use of both indwelling peripherally inserted central catheter (PICC)/Mediport catheters or wider bore central venous access catheters. The former may be damaged by rapid contrast administration, whereas the latter may induce an intracardiac catheter “whip” or fluid “jet” effect, potentially damaging the cardiac endothelium or valves. Typically, 150 mL of intravenous contrast media is administered for studies performed with single-detector or earlier four-slice scanners; however, this volume may be reduced to 120 mL or less for newer generation MDCT scanners owing to their faster data acquisition. It is important to note that by suspending the injection as soon as the scanner has completed scanning the central vasculature, the volume of injected contrast may be significantly reduced. If a dual injector is available, a saline chaser may be utilized to significantly reduce the volume of contrast required to perform the examination (91,92,93,94). This is because intravenous contrast administered later in the injection does not contribute to vascular arterial enhancement but is required merely to maintain both the forward motion of the previously administered contrast and the compact nature of the bolus, maximizing the enhancement peak. Clearance of dense contrast media from the central veins may also reduce artifacts (91).
Contrast Media Administration: Scan Delay
Timing of the scan acquisition is the single most critical factor in optimizing CTPA. Estimating a fixed delay based on the patient’s age or heart rate is unreliable and likely to yield a high number of suboptimal examinations (95,96). A test injection of 20 mL of intravenous contrast may be used with dynamic acquisition of a single slice through the central pulmonary arteries every 3 to 5 seconds for 20 to 25 seconds. An appropriate triggering delay may then be determined by identifying the time point corresponding to the slice with the densest contrast opacification and adding 3 to 5 seconds to permit opacification of the more peripheral vasculature (82). This technique, although a significant improvement over a best guess approach, is still limited principally by the fact that the 20-mL bolus may not accurately predict the manner in which the larger bolus will behave and, in addition, that the available volume of intravenous contrast remaining for the examination is consequently reduced.
Bolus tracking, available on newer scanners, eliminates the need for a test dose with its associated limitations and, when available, should be used for all studies. During the main contrast injection, a dynamic enhancement curve obtained from a preselected region of interest typically positioned over the main pulmonary artery is generated, and at a predetermined threshold the scan acquisition is commenced. Although there is currently no consensus regarding optimal choice of a triggering threshold, as this will vary according to the speed of the scanner and the time required for the gantry to move into position, in our experience a minimum of 130 to 150 Hounsfield units (HU) should be selected to ensure optimal contrast enhancement (Fig. 3-7).
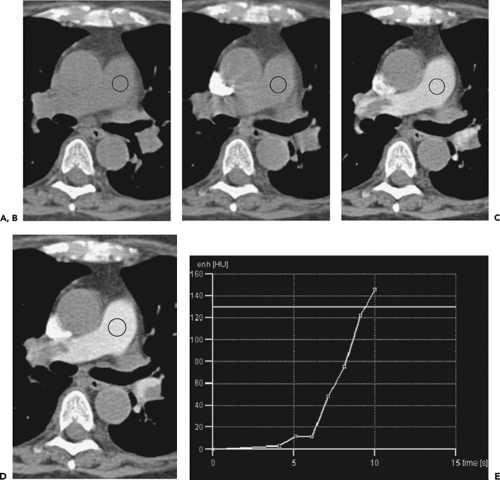 Figure 3-7 Pulmonary emboli diagnosis: bolus tracking. A–D: Coned-down views of axial images sequentially obtained at the same exact level following a bolus of intravenous contrast media, with a region-of-interest cursor placed over the main pulmonary artery in each image. With bolus tracking, automatic densitometry measurements are made every second, allowing precise triggering of scan acquisition to match a preselected density threshold. E: A real-time graph demonstrating the level of contrast enhancement within the main pulmonary artery as a function of time. In this case, a threshold of 130 HU was utilized to initiate the CT pulmonary angiography study. Note that in this case monitoring images demonstrate an incidentally identified right main pulmonary artery embolus. |
Dose Modulation
In larger patients the use of dose reduction techniques during scanning may materially reduce the quality of the studies and hence should not be considered standard. In an attempt to reduce the radiation dose, many scanners now employ a proportional dynamic reduction of tube current output when the tube is directed along the patient’s thinner anteroposterior (AP) and posteroanterior (PA) axis. Unfortunately, when the tube is operating at its limits, as occurs in larger patients or typically in patients undergoing CTPA, the tube current may be insufficient in the PA or AP axis, with the subsequent reduction in dose resulting in noisy images. With the advent of advanced dose-limiting techniques, permitting additional real-time modulation of the mAs in the z-axis as well as in the xy-plane during scan acquisition, tailoring the CT dose index to acceptable image quality is essential for optimizing scan technique.
Image Reconstruction and Interpretation
Overlapping 1- to 3-mm images should always be reconstructed using a “mediastinal” or “soft” algorithm to reduce the edge-enhancing artifacts that may mimic emboli when “sharp” or “bone” algorithms are utilized. As previously noted, the use of thinner collimation significantly improves visualization of peripheral subsegmental arteries. Even with four-detector scanners, a reduction of collimation from 3 mm to 1.25 mm improves visualization of opacified subsegmental vessels from 37% to 39% to 71% to 76%, respectively (61), as well as improving visualization of the next two orders of magnitude of vessel size from 47% to 74% and 16% to 35%, respectively (97).
It cannot be overemphasized that optimal evaluation of CTPA examinations requires interactive dynamic evaluation of images either on stand-alone workstation or on a Picture-Archiving and Communications System (PACS). The use of cine-viewing, in particular, is of inestimable value, in one study increasing the number of patients identified as having PE by 25% (98). The ability to scroll through contiguous or overlapping images not only improves the tracking of individual vessels and detection of intraluminal filling defects but also permits the dynamic alteration of window levels and widths. Dense contrast may obscure even large underlying PE, especially when standard mediastinal window settings are used. It cannot be overemphasized that in the interpretation of CTPA examinations, the pulmonary arteries should not appear “bone white,” as this will lead to emboli being overlooked. The use of a higher centering point and wider window width (e.g., 200/1000) may assist in visualizing emboli despite dense contrast enhancement. For smaller vessels, or those with less dense contrast enhancement, these settings may require dynamic, interactive alteration (Fig. 3-8). Brink et al. (99) have suggested that, optimally, windowing should be centered at the mean density of the right or left pulmonary artery, with a window width then set at twice the SD. In altering window width, readers should be aware that visualization of image noise, the appearance of laminar contrast flow, and motion-related artifacts may increase, requiring mental adjustment of the thresholds for determining when indeterminate low-density foci truly represent emboli (82).
The American College of Radiology recommends that official CTPA interpretation reports should include a description of the quality of pulmonary arterial opacification to guide the level of interpretative confidence. In cases in which contrast opacification is suboptimal, it is still of value to provide a partial interpretation limited to those arteries sufficiently well visualized to allow diagnosis. In
these situations, we believe it is more useful to describe at which specific level of anatomic vascular subdivision it is possible to exclude embolic disease (main, lobar, segmental, subsegmental), rather than to state the absence of “central” pulmonary embolism or of PE in vessels up to the nth order. This is because there is no universally accepted definition of “central” PE and, as important, considerable variation in radiologists’ and clinicians’ assessment of the order of pulmonary arterial branching with obvious potential for confusion or misinterpretation.
these situations, we believe it is more useful to describe at which specific level of anatomic vascular subdivision it is possible to exclude embolic disease (main, lobar, segmental, subsegmental), rather than to state the absence of “central” pulmonary embolism or of PE in vessels up to the nth order. This is because there is no universally accepted definition of “central” PE and, as important, considerable variation in radiologists’ and clinicians’ assessment of the order of pulmonary arterial branching with obvious potential for confusion or misinterpretation.
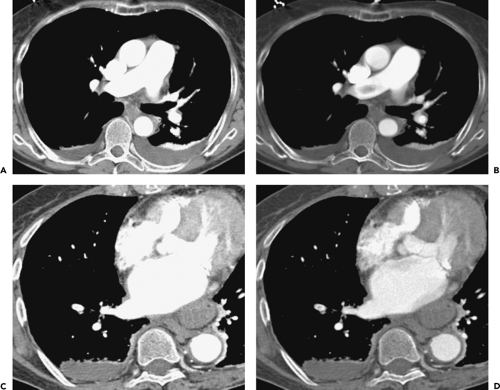 Figure 3-8 Pulmonary emboli diagnosis: effects of image windowing. A, B: Identical contrast-enhanced axial sections through the right main pulmonary artery imaged with window widths of 400 HU (A) and 1,000 HU (B), respectively, with corresponding window widths of 40 HU (A) and 150 HU (B). Note that in A, the pulmonary arteries appear “bone” white. It is only when appropriate window levels and widths are applied that an otherwise unsuspected embolus becomes apparent (B). C, D: Identical coned-down sections through the inferior portion of the right hilum, in a different patient than shown in A and B, again show to good advantage the use of appropriate windows and levels for identifying emboli. In this case, note the presence of a filing defect in the anterobasilar segmental artery in D, otherwise obscured in C. |
Advanced Image Processing
The use of MPRs may be of assistance by improving diagnostic certainty in cases in which routine axial images may be indeterminate, as well simplifying visualization of potentially complex three-dimensional (3D) structures (100,101,102,103). A sliding stack of axial or coronal MIPs may be especially useful as a screening tool to quickly review large datasets resulting from use of thin collimation (104) (Fig. 3-9). Although paddlewheel reconstructions also have been advocated by some authors as an additional mechanism to enhance visualization of vessels along their entire length, this technique has not gained widespread acceptance, likely because of its nonintuitive format (105,106,107) (Fig. 3-10). Despite the advantages that may result from advanced image processing techniques, it should be emphasized that these do not replace the need to review axial source images (Fig. 3-11).
Computer-aided diagnosis (CAD) represents another set of techniques currently being evaluated as a method for enhancing the detection of PE. Potentially useful computer-aided tools include, among others, interactive 3D
surface renderings of the pulmonary arteries with automatic surface shading of vessels suspected of containing emboli and interactive vessel aligned techniques that permit real-time MPR images to be generated along the long-axis of vessels in which a filling defect is suspected. Early generation automated second-reader detection systems are also under evaluation; these automatically identify candidate emboli as low-density intra-arterial foci for observer review. Although these techniques hold considerable promise for improving the detection especially of easily overlooked subsegmental emboli, their general acceptance remains to be validated. To date, the sensitivity and specificity of currently available CAD algorithms have not been adequately tested. It is likely that the true potential of CAD systems for detecting emboli will not emerge until techniques that allow reliable automated segmentation of the pulmonary arteries from the pulmonary veins have been developed (Figs. 3-12 and 3-13).
surface renderings of the pulmonary arteries with automatic surface shading of vessels suspected of containing emboli and interactive vessel aligned techniques that permit real-time MPR images to be generated along the long-axis of vessels in which a filling defect is suspected. Early generation automated second-reader detection systems are also under evaluation; these automatically identify candidate emboli as low-density intra-arterial foci for observer review. Although these techniques hold considerable promise for improving the detection especially of easily overlooked subsegmental emboli, their general acceptance remains to be validated. To date, the sensitivity and specificity of currently available CAD algorithms have not been adequately tested. It is likely that the true potential of CAD systems for detecting emboli will not emerge until techniques that allow reliable automated segmentation of the pulmonary arteries from the pulmonary veins have been developed (Figs. 3-12 and 3-13).
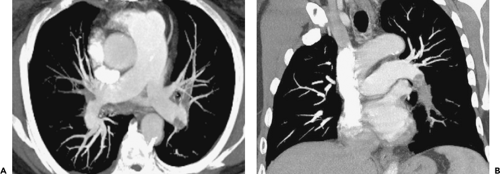 Figure 3-9 Pulmonary emboli (PE) diagnosis: use of maximum intensity projections (MIPs). A: Axial 10-mm maximum MIP image demonstrates multiple left-sided PE. B: A 7-mm off-axis coronal MIP in the same patient as shown in A, oriented along the length of the left main pulmonary artery again demonstrates extensive central PE. In select cases, a stack of overlapping sliding MIP images may be used as an initial means for screening for PE. |
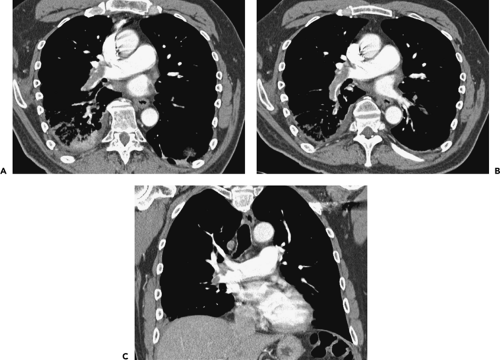 Figure 3-10 Pulmonary emboli (PE) diagnosis: paddlewheel reconstructions. A–C: Three 1-mm multiplanar reconstruction images selected from a set of images obtained using a 360-degree paddlewheel reconstruction algorithm. This approach, enabling images to be viewed as a scrolled image dataset, purposefully elongates central vessels, making PE more apparent. |
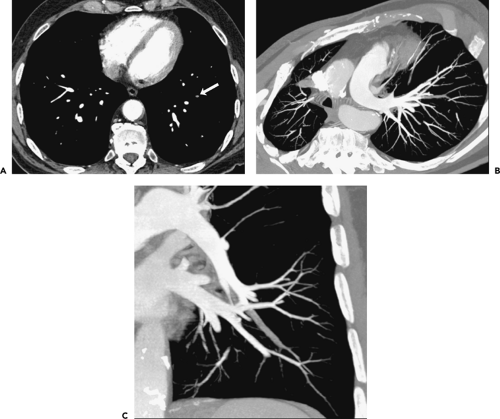 Figure 3-11 Pulmonary emboli diagnosis: use of multiplanar reconstructions (MPRs). A: A 2-mm axial image demonstrates an easily overlooked, completely occluded subsegmental pulmonary artery (arrow). B, C: Off-axis axial and coronal 5-mm maximum intensity projection reconstructions, respectively, demonstrate to better advantage the presence of an obstructing subsegmental pulmonary embolus. In select cases, use of MPRs may enhance diagnostic certainty by identifying otherwise overlooked emboli in cases with a high clinical index of suspicion or by more definitively establishing emboli in patients with equivocal findings on routine axial images. |
Pulmonary Emboli in Pregnancy
Women are at increased risk of thromboembolism throughout the entire duration of their pregnancy as well as during the puerperium (108). Although there is no absolute contraindication for performing CT during pregnancy, it is clearly advantageous to restrict unnecessary radiation exposure, particularly during the first trimester, when fetuses are most susceptible to defective organogenesis
or death. In fact, the risks of complications occurring secondary to fetal radiation exposure—including childhood malignancy and growth or mental retardation—typically require doses at least 100 times higher than those encountered during routine CTPA (0.1 to 0.5 mGy). At present, termination of pregnancy should not be considered to be justified below 100 mGy (109,110). Fetal radiation doses comparable to or less than those resulting from a V/Q scan can be achieved with the additional benefit of a reduction in the number of otherwise inconclusive studies. A survey of the clinical practice of members of the Society of Thoracic Radiology confirms that 75% of respondents perform CTPA for suspected PE during pregnancy, and of these just over half prefer CTPA as the initial method of investigation. Eighty percent of practitioners acquired a PA chest radiograph prior to the examination, a practice we concur with, considering the extremely low radiation dose resulting from a single frontal chest radiograph. Also in keeping with our practice, approximately half of the respondents modified their studies to reduce radiation exposure by reducing z-axis coverage while increasing slice width and decreasing mAs (Table 3-4) (111).
or death. In fact, the risks of complications occurring secondary to fetal radiation exposure—including childhood malignancy and growth or mental retardation—typically require doses at least 100 times higher than those encountered during routine CTPA (0.1 to 0.5 mGy). At present, termination of pregnancy should not be considered to be justified below 100 mGy (109,110). Fetal radiation doses comparable to or less than those resulting from a V/Q scan can be achieved with the additional benefit of a reduction in the number of otherwise inconclusive studies. A survey of the clinical practice of members of the Society of Thoracic Radiology confirms that 75% of respondents perform CTPA for suspected PE during pregnancy, and of these just over half prefer CTPA as the initial method of investigation. Eighty percent of practitioners acquired a PA chest radiograph prior to the examination, a practice we concur with, considering the extremely low radiation dose resulting from a single frontal chest radiograph. Also in keeping with our practice, approximately half of the respondents modified their studies to reduce radiation exposure by reducing z-axis coverage while increasing slice width and decreasing mAs (Table 3-4) (111).
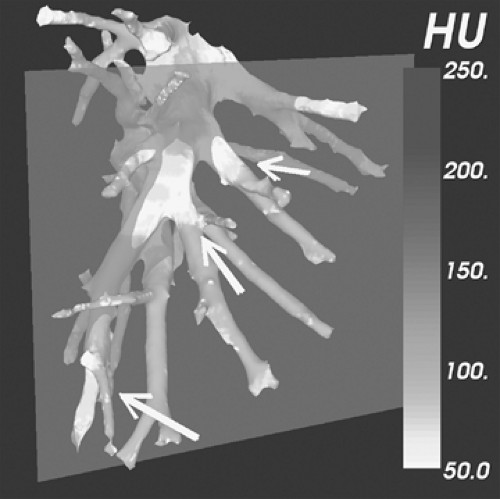 Figure 3-12 Computer-assisted diagnosis (CAD). See Color Figure 3-12. Image depicting an experimental method for providing automated three-dimensional surface shaded renderings of the pulmonary vasculature. Using this technique, intraluminal areas of low density suspicious for pulmonary emboli are automatically highlighted for inspection. The output is designed to be freely manipulated in three dimensions on a standalone workstation. Renderings may be grayscale or color-coded while clicking on candidate emboli results in visualization of three orthogonal planes through the vessel of interest. Although the use of various CAD methods to diagnose pulmonary emboli is of interest, validation of these techniques remains to be established (see Fig. 3-13 as well). (Case courtesy of Carol Novak, PhD, Siemens Corporate Research, Inc., Princeton, New Jersey.) |
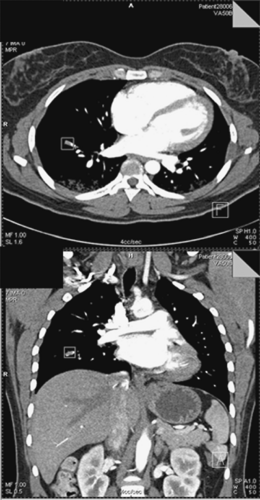 Figure 3-13 Computer-assisted diagnosis (CAD). Axial (top) and coronal images (bottom), as viewed using an experimental CAD device different from that illustrated in Figure 3-12. Using this approach, axial volumetric datasets are first reviewed by readers, with subsequent CAD-identified regions of interest automatically placed around suspected pulmonary emboli for reader’s evaluation. Simultaneous automatic generation of three orthogonal multiplanar reconstructions further simplifies interpretation. (Case courtesy of Marcos Salganikoff, PhD, Siemens Medical Solutions, Malvern, Pennsylvania.) |
Magnetic Resonance Imaging of Pulmonary Emboli
The utility of magnetic resonance imaging (MRI) in the evaluation of acute pulmonary embolism is in constant evolution due to continual advances in scanning hardware and imaging sequences. Although MRI for PE detection remains a predominantly research application performed almost
exclusively in academic institutions, recent improvements in image quality suggest that MRI will likely find increasing clinical utilization outside the small group of patients for whom it is currently advantageous—patients in whom the administration of iodinated contrast media or ionizing radiation is contraindicated or undesirable. In particular, as breath-hold sequences become shorter, overall imaging times are reduced, and medical monitoring devices become more MR compliant, the MR suite has become a progressively less inhospitable environment for acutely dyspneic patients. Varying MR techniques offer the ability not only to identify PE but also to evaluate pulmonary parenchymal perfusion and ventilation, moving toward a global physiologic assessment of the dyspneic patient.
exclusively in academic institutions, recent improvements in image quality suggest that MRI will likely find increasing clinical utilization outside the small group of patients for whom it is currently advantageous—patients in whom the administration of iodinated contrast media or ionizing radiation is contraindicated or undesirable. In particular, as breath-hold sequences become shorter, overall imaging times are reduced, and medical monitoring devices become more MR compliant, the MR suite has become a progressively less inhospitable environment for acutely dyspneic patients. Varying MR techniques offer the ability not only to identify PE but also to evaluate pulmonary parenchymal perfusion and ventilation, moving toward a global physiologic assessment of the dyspneic patient.
Table 3-4 Pulmonary Embolism Protocols in Pregnancy | ||||||||||||||||||||||||||||||||||||||||||||||||||||||||||||||||||||||||||||||||||||||||||||||||
|---|---|---|---|---|---|---|---|---|---|---|---|---|---|---|---|---|---|---|---|---|---|---|---|---|---|---|---|---|---|---|---|---|---|---|---|---|---|---|---|---|---|---|---|---|---|---|---|---|---|---|---|---|---|---|---|---|---|---|---|---|---|---|---|---|---|---|---|---|---|---|---|---|---|---|---|---|---|---|---|---|---|---|---|---|---|---|---|---|---|---|---|---|---|---|---|---|
| ||||||||||||||||||||||||||||||||||||||||||||||||||||||||||||||||||||||||||||||||||||||||||||||||
Magnetic Resonance Imaging Techniques and Comparative Performance
Initial attempts to employ MR for detecting PE employed cine gradient-echo (112,113,114,115), two-dimensional (2D) (114,116,117,118) and 3D time-of-flight magnetic resonance angiography (MRA) (119,120). These provided only limited spatial resolution because of respiratory and cardiac motion and hence were predominantly limited to the evaluation of the central pulmonary arteries. Modifications of time-of-flight techniques such as variable-angle uniform signal excitation (VUSE) have improved visualization of the pulmonary arterial vasculature by progressively increasing the radiofrequency (RF) pulse flip angle for blood exiting the imaging volume slab, counteracting the saturation effects of flowing blood. In volunteers, this free breathing technique allows generation of MIP images to sixth-order vessels but has proved time consuming and has never been clinically validated (121,122).
Image quality and diagnostic accuracy have further improved with the development of gadolinium-enhanced 2D, time-of-flight MRA (123,124) and early breath-hold sequences (125,126,127) but still remained a predominantly research application until the introduction of current high-performance gradient systems (>20 mT/m). These systems permit the use of short time to repetition (TR) 3D gradient-echo sequences that allow the acquisition of high spatial resolution volumetric datasets in a single breath-hold. The reduction of respiratory motion permits visualization of peripheral vessels that would otherwise be obscured by blurring (128,129,130,131,132,133,134). Signal averaging from multiple excitations of the 3D slab also minimizes cardiac motion, and short echo times (1 to 3 ms) result in reduction of signal loss from flow-related dephasing and susceptibility artifacts at air-tissue interfaces (129). Additionally, the utilization of specialized surface phase array body coils improves signal-to-noise ratio compared with routine body coils, also contributing to improved visualization of the peripheral pulmonary arteries (135,136) (Table 3-5).
Monophasic 3D gradient-echo protocols require a 20- to 30-second breath-hold, achieving higher resolution by
utilizing more partitions during this period. The performance of these techniques has been evaluated by several authors. Hatabu et al. (135) demonstrated that vessels as small as the sixth to seventh order could be reliably depicted. Meaney et al. (133), in a study comparing classic angiography with a single-acquisition coronal 3D gradient-echo sequence [27-second acquisition, TR/time to echo TE 6.5/1.8 ms; flip angle 45 degrees, slab 8.4 to 11.2 cm, 32 partitions, 30- to 36-cm field of view (FOV), 40 to 60 mL Gd at 2 mL/second followed by a saline chaser] identified 5 of 6 lobar PE and 16 of 17 segmental emboli with sensitivities of 75% to 100% and specificities of 95% to 100%, respectively. Similarly, in a larger study of 118 patients undergoing both DSA and MRA [1 breath-hold acquisition/lung, 15 to 17 seconds, 3D fast low-angle shot (FLASH), TR/TE 3.6/1.6 ms; flip angle 25 degrees, slab 12.5 cm, 44 partitions, 20- to 32-cm FOV, 44 mL Gd at 2 mL/second], readers demonstrated high interobserver agreement (k = 0.75) with sensitivities for central/lobar and segmental pulmonary arteries of 100% and 84%, respectively, although sensitivities were low for subsegmental (72%) and isolated subsegmental (40%) PE (137). Gupta et al. (138) reported similar sensitivities (85%) and specificities (96%), detecting 11 of 13 emboli that were predominantly segmental or larger while missing two isolated subsegmental emboli. Loubeyre et al. (123) identified all the central but none of the peripheral PE identified angiographically using subsecond MRI gradient sequences (Figs. 3-14 and 3-15).
utilizing more partitions during this period. The performance of these techniques has been evaluated by several authors. Hatabu et al. (135) demonstrated that vessels as small as the sixth to seventh order could be reliably depicted. Meaney et al. (133), in a study comparing classic angiography with a single-acquisition coronal 3D gradient-echo sequence [27-second acquisition, TR/time to echo TE 6.5/1.8 ms; flip angle 45 degrees, slab 8.4 to 11.2 cm, 32 partitions, 30- to 36-cm field of view (FOV), 40 to 60 mL Gd at 2 mL/second followed by a saline chaser] identified 5 of 6 lobar PE and 16 of 17 segmental emboli with sensitivities of 75% to 100% and specificities of 95% to 100%, respectively. Similarly, in a larger study of 118 patients undergoing both DSA and MRA [1 breath-hold acquisition/lung, 15 to 17 seconds, 3D fast low-angle shot (FLASH), TR/TE 3.6/1.6 ms; flip angle 25 degrees, slab 12.5 cm, 44 partitions, 20- to 32-cm FOV, 44 mL Gd at 2 mL/second], readers demonstrated high interobserver agreement (k = 0.75) with sensitivities for central/lobar and segmental pulmonary arteries of 100% and 84%, respectively, although sensitivities were low for subsegmental (72%) and isolated subsegmental (40%) PE (137). Gupta et al. (138) reported similar sensitivities (85%) and specificities (96%), detecting 11 of 13 emboli that were predominantly segmental or larger while missing two isolated subsegmental emboli. Loubeyre et al. (123) identified all the central but none of the peripheral PE identified angiographically using subsecond MRI gradient sequences (Figs. 3-14 and 3-15).
Table 3-5 Magnetic Resonance Pulmonary Embolism Protocol | |||||||||||||||||||||||||||||||||
|---|---|---|---|---|---|---|---|---|---|---|---|---|---|---|---|---|---|---|---|---|---|---|---|---|---|---|---|---|---|---|---|---|---|
| |||||||||||||||||||||||||||||||||
To date, there are only a few published studies comparing the relative performance of optimum MR technique with state-of-the-art CT for detecting PE. In one early study, MR and CTPA performed with 5-mm collimation demonstrated comparable sensitivities (71% vs. 73%) when interpreted by experts (139). In a more recent study (140), the low sensitivity of the utilized CT technique (70% to 72%) rather than the superior sensitivity of MRA (79% to 81%) proved the likely explanation for the apparent superiority of MR in detecting central emboli. It is likely that in comparing optimal techniques for both modalities, the sensitivities for central PE would be comparable (141,142), whereas MR performance at the subsegmental level would at best be comparable to results
obtained using SDCT scanners (123,137,138). Animal model studies of subsegmental PE have recently provided equivalent (143) or higher (144) mean reader sensitivities (82% to 92%) for the combined interpretation of MRA and MR perfusion defects when compared with either expiratory MDCT (144) or single-detector spiral CT (143). However, in one of these studies (144), the MRI technique utilized an impractical 43-second breath-hold sequence.
obtained using SDCT scanners (123,137,138). Animal model studies of subsegmental PE have recently provided equivalent (143) or higher (144) mean reader sensitivities (82% to 92%) for the combined interpretation of MRA and MR perfusion defects when compared with either expiratory MDCT (144) or single-detector spiral CT (143). However, in one of these studies (144), the MRI technique utilized an impractical 43-second breath-hold sequence.
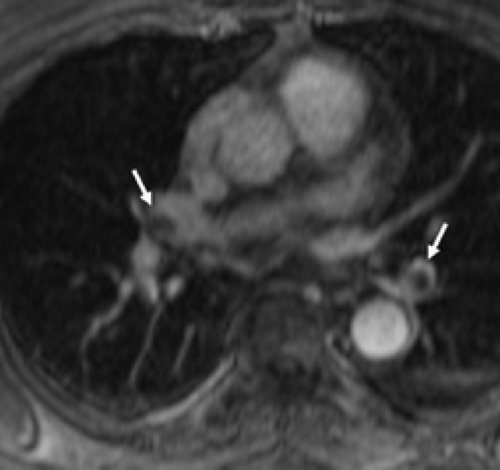 Figure 3-14 Acute pulmonary embolism: magnetic resonance imaging (MRI). Five-millimeter axial T1-weighted, fat-saturated spoiled gradient-echo sequence, obtained following intravenous gadolinium administration, demonstrates bilateral pulmonary emboli (arrows). Although visualization of the central pulmonary arteries is adequate using this early technique, note that there are extensive motion artifacts, rendering visualization of segmental and subsegmental pulmonary arteries suboptimal or impossible. |
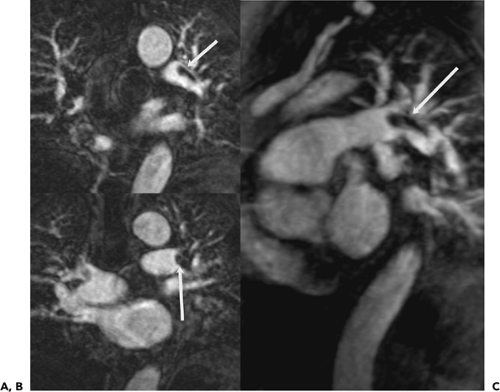 Figure 3-15 Acute pulmonary embolism: magnetic resonance angiography (MRA). A–C: Coronal 3D gradient-echo, electrocardiographic-gated, gadolinium-enhanced MRA (TR/TE 3.2/1.4 ms, 20-second breath-hold) demonstrates improved visualization of the central pulmonary arteries on both source coronal images (arrows in A and B) as well as oblique multiplanar reconstruction projections (arrow in C). Although this approach provides improved visualization of peripheral arteries, resolution is still suboptimal compared with multidetector CT pulmonary angiography. |
Fast Techniques
The use of longer breath-hold sequences requires greater accuracy in the timing of contrast administration because of rapid vascular transit through the lung parenchyma. Moreover, because saturation pulses are ineffective at nulling gadolinium-enhanced vessels, it remains impossible to achieve pulmonary arterial enhancement without overlapping venous enhancement. Despite the use of supplemental oxygen via nasal cannulas, not all patients, particularly those who are dyspneic or in pain, are able to comply with the required breath-hold period, a significant factor countering the widespread use of MRI for PE.
As an alternative to monophasic sequences, 2D or 3D rapid (5 to 10 second) time-resolved sequences may be performed to differentiate between pulmonary arterial and venous phases (145,146). Although these sequences have sufficient temporal resolution to identify pulmonary arterial perfusion, they offer limited spatial resolution as well as poor depiction of the peripheral pulmonary arteries (147,148,149). The use of partial Fourier imaging, in combination with 3D time-resolved sequences that share the central lines of k-space data, can offset this inherent decrease in spatial resolution (150). With recent further advances in gradient strength (40 mT/m) and a slew rate of 200 mT/m/ms, Goyen et al. (145) achieved anatomic demonstration of emboli and normal anatomy in eight patients at the subsegmental level using only a 4-second sequence (TR/TE 1.64/0.6 ms). In a study of 39 patients, Kluge et al. (151) demonstrated that real-time MR evaluation with true fast imaging with steady-state precession (True FISP) resulted in an increased yield of diagnostic studies for evaluating the central pulmonary vasculature.
Parallel processing techniques such as SENSE (sensitivity encoding for fast MRI) and SMASH (simultaneous acquisitions of spatial harmonics) offer an alternative mechanism to reduce breath-hold duration (152,153,154). These techniques utilize the spatial information inherent in the geometry of the surface coils to reduce the number of phase encoding steps and hence acquisition time. This advantage may be utilized either to reduce the time of the examination
with preserved spatial resolution or to increase spatial resolution while maintaining a constant breath-hold duration (155). Both techniques, either by reduction of motion or improvement of spatial resolution, result in significant improvement of visualization of the central and peripheral vessels (156). Although promising, validation in larger studies is still required to assess the sensitivity for diagnosing subsegmental emboli (Fig. 3-16).
with preserved spatial resolution or to increase spatial resolution while maintaining a constant breath-hold duration (155). Both techniques, either by reduction of motion or improvement of spatial resolution, result in significant improvement of visualization of the central and peripheral vessels (156). Although promising, validation in larger studies is still required to assess the sensitivity for diagnosing subsegmental emboli (Fig. 3-16).
Scan Performance and Interpretation
Successful performance of MRA for detecting PE depends not only on successful optimization of scan parameters but also on optimization of contrast delivery as well as appropriate utilization of advanced image processing techniques. Most examinations utilize gadolinium at a dose of 0.2 mmol/kg administered at a rate of 2 mL/second with a saline flush to maintain a compact contrast profile. The use of significantly higher doses likely yields little additional benefit (157). If a monophasic examination is performed, a timing run is usually required; however, with ultrafast or time-resolved sequences the examination is started 5 seconds after contrast administration (158). The use of agents restricted to the blood pool (e.g., Gadomer) offer the intriguing possibility of evaluating the pulmonary vasculature without timing restrictions (159), including evaluation of peripheral venous thromboembolism (160).
The disadvantage of this approach is the inevitable overlap of venous and arterial anatomy.
The disadvantage of this approach is the inevitable overlap of venous and arterial anatomy.
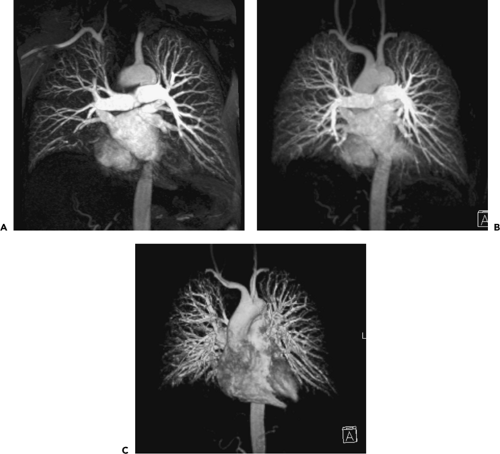 Figure 3-16 Acute pulmonary embolism: magnetic resonance angiography (MRA). A–C: Coronal images obtained in a normal subject using parallel processing fast imaging technique (TR/TE 3.2/1.4 ms, 20-second breath-hold) maintaining the same duration of breath holding and sequence length as the case illustrated in Figure 3-15, demonstrating improved spatial resolution and visualization of peripheral pulmonary arteries with progressively thicker maximum intensity projections (MIPs) (A through C, respectively). Thicker MIPs approximate angiographic appearances but unfortunately may conceal thrombus. Superimposition of venous anatomy remains an additional problem to date, limiting the routine use of this technique. |
As with CTPA, pulmonary arterial MRA requires dynamic workstation evaluation. Although MIPs may render aesthetically pleasing images that mimic classic angiography, the use of these techniques may conceal a low signal intensity embolus (Fig. 3-16). The best depiction of low signal intensity filling defects is achieved by review of the axial source images or of thin section MPRs (138,155,158,161). The clinical utility of surface-rendered images and virtual endoluminal projections has yet to be demonstrated (141,162).
Emerging and Future Developments
Evolving applications of MRI include direct thrombus imaging by utilizing the high T1 signal intensity of methemoglobin present in subacute thrombi. A T1-weighted magnetization-prepared 3D gradient-echo sequence may be used following a water-only RF excitation pulse with an inversion time selected to nullify blood (155). This technique has been used successfully in lower limb venography (163,164,165,166) and in early studies to evaluate PE (164,167). Arterial spin labeling is a noncontrast technique using tagging pulses that employ plasma as an endogenous tracer by subtracting the signal from flowing blood from that of stationary background tissue. One such sequence named FAIRER (flow-sensitive alternating inversion recovery with an extra radiofrequency pulse) has been successfully used in animal models of PE (168) and has now been evaluated in early human studies (169).
Stay updated, free articles. Join our Telegram channel

Full access? Get Clinical Tree


