The objective of this study was to compare the diagnostic accuracy of quantitative coronary angiography (QCA), coronary computed tomography angiography (CTA), and intravascular ultrasound (IVUS) with fractional flow reserve (FFR) measurements. Eighty-five lesions (40% to 99% diameter stenosis) in 85 patients were prospectively interrogated by QCA, CTA, IVUS, and FFR. Minimal lumen diameter (MLD), percent diameter stenosis (%DS), minimal lumen area (MLA), and percent area stenosis (%AS) were measured. Correlation, receiver operating characteristic analysis, kappa statistics, and multivariable logistic regression was used to assess relation between anatomic measurements and FFR. Average age was 61.3 ± 7.8; 62% were men. QCA-derived mean %DS was 55.3% ± 19.5%; mean FFR 0.81 ± 0.17; 27% had FFR ≤0.75. QCA had the strongest correlation, followed by CTA and then IVUS for MLD (r = 0.67, 0.47, and 0.29, respectively) and for %DS (r = −0.63, −0.52, and −0.22, respectively); QCA-derived MLD had area under the curve of 0.96, with 95% sensitivity and 82% specificity. Cut-point, area under the curve, sensitivity, and specificity for CTA-MLA and IVUS-MLA were 3.11 mm 2 , 0.86, 81%, and 81% and 2.68 mm 2 , 0.75, 70%, and 80%. In multivariable analysis for each modality, MLD on QCA (odds ratio [OR]: 0.002), %AS on CTA (OR: 1.09) and MLA on IVUS (OR: 0.28) remained independent predictors. In conclusion, in intermediate-to-severe lesions, QCA-, CTA-, and IVUS-derived quantitative anatomic measurements correlated with FFR. CTA-derived cut-points were similar to respective measurements on QCA and IVUS and had similar or better diagnostic performance compared with IVUS.
Progressively increasing atherosclerotic plaque burden leads to increasing luminal stenosis and thus to hemodynamic compromise across lesions. Anatomic features of atherosclerotic plaque can be imaged with intravascular ultrasound (IVUS) and coronary computed tomography angiography (CTA), whereas luminal stenosis can be quantified by quantitative coronary angiography (QCA), CTA, and IVUS. Previous studies have shown that anatomic measurements by QCA, CTA, and IVUS have relatively poor accuracy for the prediction of hemodynamically significant stenosis as measured by fractional flow reserve (FFR). QCA-, CTA- and IVUS-derived luminal measurements have not previously been compared head-to-head for the prediction of FFR.
Methods
The ATLANTA (Assessment of Tissue characteristics, Lesion morphology and hemodynamics by Angiography with fractional flow reserve, intravascular ultrasound and virtual histology and Non-invasive computed Tomography in Atherosclerotic plaques; clinicaltrials.gov identifier NCT #00817102 ) I-II study was an investigator-initiated, prospective, single-center study, approved by the Institutional Review Board of Piedmont Healthcare. Patients with signs and symptoms of myocardial ischemia were included and prospectively CTA, x-ray angiography (XRA), IVUS/virtual histology (VH), and FFR measurements were performed in a prespecified study lesion with 40% to 99% luminal diameter stenosis. One prespecified, isolated, nontandem study lesion was prospectively identified in each patient based on either a clinically performed XRA or CTA, and this lesion underwent IVUS and FFR, as well as the other imaging modality. If the clinically indicated invasive angiography was performed first, the patient then underwent research CTA; if the clinically indicated CTA was performed first, the patient was then referred for invasive angiography, IVUS, and FFR. In Phase I, we enrolled patients with intermediate lesions (40% to 70%) and obstructive lesions (>70%) in Phase II. The initial 60 patients were scanned on a 32 × 2 multidetector computed tomography scanner system (Siemens Somatom 64, Forscheim, Germany), and 25 patients were scanned on a 320-detector row system (Toshiba America Medical Systems, Otawara, Japan). Contrast-enhanced CTA on a 32 × 2 scanner system was performed using retrospective electrocardiogram gating as previously described. Coronary image acquisition on the 320-slice platform was performed using intravenous contrast (Visipaque, GE Amersham Health, Little Chalfont, Buckinghamshire, United Kingdom). We used a prospectively triggered, volumetric image acquisition method. Gantry rotation was 350 milliseconds, tube voltage 120 kV, tube current 122 to 500 mA. Images were reconstructed at 0.5-mm intervals. Deidentified data sets were transferred to a workstation (Vitrea 2.0; Vital Images; Minnetonka, Minnesota) and were analyzed using our 3-dimensional approach by a single interpreter. In each study lesion, we quantitatively measured minimal lumen diameter (MLD), percent diameter stenosis (%DS), minimal lumen area (MLA), and percent area stenosis (%AS) in a 3-dimensional fashion.
Invasive XRA was performed based on standard institutional protocols, with 5 views of the left coronary, 2 views of the right coronary, and 2 orthogonal views of the target lesion. Deidentified angiographic data sets were analyzed by a single interpreter, as previously published (Encompass, version 2.0, B17, HeartLab, Westerly, Rhode Island). MLD was measured in the view with the greatest degree of stenosis. Proximal and distal reference diameters were measured and averaged to calculate %DS.
After intracoronary injection of nitroglycerin (mean total dose per case: 561.5 mcg) and placing a guiding catheter, a 3.2F 20-mHz ultrasound catheter (Eagle Eye; Volcano Inc.; Rancho Cordova, California), was advanced in the target lesion. Automated pullback was performed at a rate of 0.5 mm/s (R-100; Volcano Inc.). De-identified IVUS data sets were analyzed using a dedicated software (pcVH 3.0.394, Volcano Inc.) as previously validated. We measured MLD, %DS, MLA, and %AS; percent stenosis was calculated based on a proximal and distal reference segment defined as <40% plaque burden.
After obtaining aortic pressure measurements as the proximal reference, a pressure wire (Volcano Prime Wire, Volcano Inc.) was advanced 2 cm distal to the lesion. Intracoronary adenosine (mean total dose per case: 441 mcg) was injected and the lowest pressure was recorded. Measurements were repeated 3 times, and the mean FFR was calculated.
Normally distributed continuous variables are expressed as mean ± SD; non-normally distributed variables as median (interquartile range). The primary end point was the correlation between anatomic measurements (MLD, %DS, MLA, and %AS) and FFR, each expressed as a continuous variable. Accordingly, the primary statistical procedure for the analysis was correlation analysis. The secondary end points were the diagnostic accuracy of anatomic measurements to predict obstructive FFR, defined as FFR ≤0.75. Accordingly, the secondary statistical procedure was receiver operating characteristics (ROC) analysis to determine optimal cut-point and diagnostic performance for each parameter and to compare the area under the ROC curve (AUC) among QCA-, IVUS-, and CTA-derived parameters. Finally, we performed multivariable, stepwise logistic regression analysis for each modality (QCA: MLD, %DS, lesion length; CTA: MLD, %DS, MLA, %AS, lesion length; and IVUS: MLD, %DS, MLA, %AS, lesion length, and plaque burden) to predict obstructive FFR.
Results
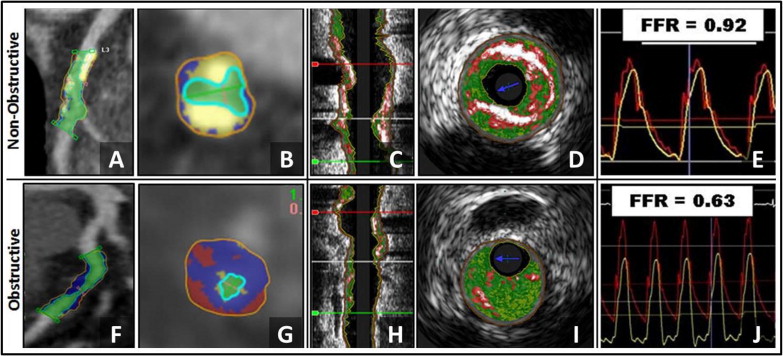
General demographic features of the population are listed in Table 1 . In the 85 patients enrolled, the mean age was 61.3 ± 7.8 years; 62% were men. Interpretable QCA, CTA, IVUS, and FFR data were available in 84, 83, 70, and 82 patients. The distribution of the coronary lesions in the 85 patients is listed in Table 2 . Average %DS by QCA, CTA, and IVUS was 55.3% ± 19.5%, 54.4% ± 19.3%, and 30.3% ± 11.0%. In the entire cohort, mean FFR was 0.81 ± 0.17, and 23 patients (27%) had an FFR ≤0.75. Example of a hemodynamically nonobstructive and obstructive lesion of CTA and IVUS are shown in Figure 1 .
| Characteristics | Frequency or Value |
|---|---|
| Subjects (n) | 85 |
| Age (yrs), mean ± SD | 61.3 ± 7.8 |
| Men | 53 (62%) |
| Caucasian | 79 (93%) |
| African-American | 6 (7%) |
| Hypertension | 66 (78%) |
| Dyslipidemia | 77 (91%) |
| Tobacco use (former or current) | 17 (20%) |
| Diabetes mellitus | 18 (21%) |
| Framingham Risk Score (10-yr risk; mean ± SD) | 8.7 ± 6.3 |
| Angina pectoris | 43 (50.6%) |
| Dyspnea | 22 (25.9%) |
| Medications | |
| Aspirin | 69 (81%) |
| β blocker | 40 (47%) |
| Angiotensin converting enzyme inhibitor | 28 (33%) |
| Angiotensin receptor blocker | 8 (9%) |
| Nitrate | 7 (8%) |
| Statin | 59 (69%) |
| Ezetimibe | 15 (18%) |
| Niacin | 13 (15%) |
| Fibric acid derivative | 9 (1%) |
| Total cholesterol (mg/dl) | 153.4 ± 40.5 |
| Low-density lipoprotein (mg/dl) | 86.9 ± 34.3 |
| High-density lipoprotein (mg/dl) | 38.3 ± 11.7 |
| MLD lesion (mm) | Mean Reference Diameter (mm) | %DS | MLA lesion (mm 2 ) | Mean Reference Area (mm 2 ) | Area Stenosis (%) | |
|---|---|---|---|---|---|---|
| QCA | 1.45 ± 0.71 | 3.23 ± 0.78 | 55.3 ± 19.5 | N/A | N/A | N/A |
| CTA | 1.40 ± 0.68 | 3.03 ± 0.75 | 54.4 ± 19.3 | 4.53 ± 2.8 | 10.68 ± 4.81 | 59.01 ± 21.95 |
| IVUS | 1.86 ± 0.46 | 2.55 ± 0.53 | 30.6 ± 10.9 | 3.69 ± 1.91 | 6.41 ± 2.67 | 47.6 ± 14.9 |

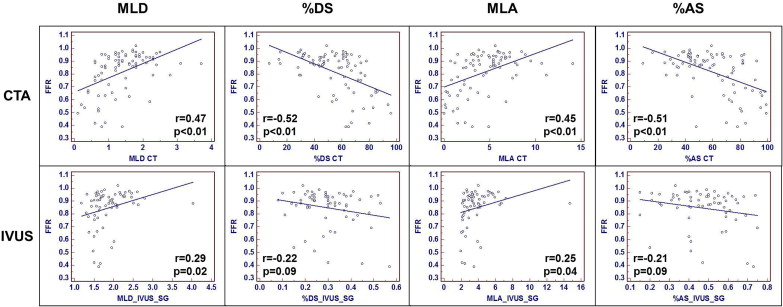
Results of correlation analysis among QCA-, CTA-, and IVUS-derived anatomic measurements and FFR are listed in Table 3 and shown Figures 2 and 3 . For MLD and %DS, QCA had the strongest correlation to FFR, followed by CTA- and IVUS-derived MLD and %DS. For MLA and %AS, CTA had stronger correlation to FFR, compared with IVUS.
| n = 85 | MLD (mm) | %DS | MLA (mm 2 ) | %AS | ||||
|---|---|---|---|---|---|---|---|---|
| r Value | p Value | r Value | p Value | r Value | p Value | r Value | p Value | |
| QCA | 0.67 | <0.01 | −0.63 | <0.01 | N/A | N/A | N/A | N/A |
| CTA | 0.47 | <0.01 | −0.52 | <0.01 | 0.45 | <0.01 | −0.51 | <0.01 |
| IVUS | 0.29 | 0.02 | −0.22 | 0.09 | 0.25 | 0.04 | −0.21 | 0.09 |


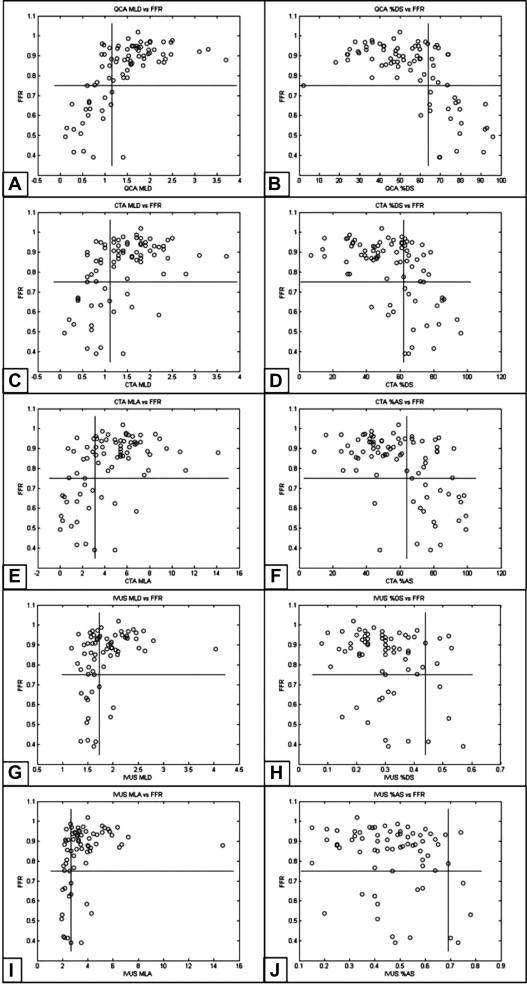
Results of the ROC analysis of CTA-, QCA-, and IVUS-derived anatomic parameters to predict obstructive FFR are listed in Table 4 and shown Figure 4 .
| Cut-point | AUC | Sensitivity | Specificity | PPV | NPV | Accuracy | Kappa | LR+ | LR− | |
|---|---|---|---|---|---|---|---|---|---|---|
| MLD (mm) | ||||||||||
| QCA | 1.15 | 0.96 | 95% (86%–100%) | 82% (72%–91%) | 64% (48%–81%) | 98% (94%–100%) | 85% | 0.67 | 5.19 | 0.06 |
| CTA | 1.11 | 0.83 | 76% (58%–94%) | 78% (67%–89%) | 55% (37%–73%) | 90% (82%–98%) | 78% | 0.48 | 3.46 | 0.31 |
| IVUS | 1.73 | 0.71 | 80% (55%–100%) | 57% (44%–71%) | 26% (10%–41%) | 94% (86%–100%) | 61% | 0.2 | 1.88 | 0.35 |
| %DS | ||||||||||
| QCA | 64% | 0.91 | 90% (78%–100%) | 83% (74%–93%) | 66% (48%–83%) | 96% (91%–100%) | 85% | 0.66 | 5.43 | 0.11 |
| CTA | 62% | 0.85 | 81% (64%–98%) | 75% (63%–86%) | 53% (36%–70%) | 92% (84%–99%) | 76% | 0.48 | 3.18 | 0.26 |
| IVUS | 44% | 0.58 | 30% (1.6%–58%) | 93% (86%–100%) | 43% (62%–80%) | 88% (79%–96%) | 83% | 0.26 | 4.05 | 0.76 |
| MLA (mm 2 ) | ||||||||||
| CTA | 3.11 | 0.86 | 81% (64%–98%) | 81% (71%–91%) | 61% (43%–79%) | 92% (85%–100%) | 81% | 0.56 | 4.34 | 0.23 |
| IVUS | 2.68 | 0.75 | 70% (42%–98%) | 80% (69%–90%) | 39% (16%–61%) | 93% (86%–100%) | 78% | 0.37 | 3.44 | 0.38 |
| %AS | ||||||||||
| CTA | 64% | 0.86 | 90% (78%–100%) | 75% (63%–86%) | 56% (39%–73%) | 96% (90%–100%) | 79% | 0.54 | 3.56 | 0.13 |
| IVUS | 69% | 0.62 | 30% (1.6%–58%) | 98% (95%–100%) | 75% (33%–100%) | 88% (80%–96%) | 88% | 0.37 | 16.2 | 0.71 |
Stay updated, free articles. Join our Telegram channel

Full access? Get Clinical Tree


