Few simple and effective tools are available for determining the prognosis of 30-day survivors after acute myocardial infarction. We aimed to assess whether the simple age, creatinine, and ejection fraction (ACEF) score could predict 1-year mortality of 12,000 post–myocardial infarction 30-day survivors who underwent percutaneous coronary intervention. The ACEF score was computed as follows: (age/ejection fraction) + 1, if the serum creatinine was >2 mg/dl. Accuracy was defined through receiver-operating characteristics analysis and area under the curve (AUC) evaluation. Twelve risk factors were selected and ranked according to their AUC value. Age, ejection fraction, and serum creatinine levels indicated the best AUC value. The ACEF score was significantly higher in the nonsurvivors (1.95 ± 0.82 vs 1.28 ± 0.50; p <0.001) and was an independent predictor of 1-year mortality (adjusted hazard ratio 2.26; p <0.001). The best accuracy was achieved by a prediction model including 12 risk factors (AUC = 0.80), but this did not significantly differ compared with the AUC (0.79) of the ACEF score (p = ns). Adjusted hazard ratios for 1-year mortality were 1 (reference), 3.11 (p <0.001), and 10.38 (p <0.001) for the ACEF LOW (ACEF score <1.0), ACEF MID (ACEF score 1.0 to 1.39), and ACEF HIGH (ACEF score ≥1.4) groups, respectively. The ACEF score may be a novel valid model to stratify the 1-year mortality risk in 30-day survivors who underwent percutaneous coronary intervention after acute myocardial infarction.
Risk stratification is a relevant issue in patients who underwent percutaneous coronary intervention (PCI) after acute myocardial infarction (AMI). However, few simple and effective tools are available for determining the prognosis of 30-day survivors after AMI. The age, creatinine, and ejection fraction (ACEF) score has been proposed and tested in patients who underwent coronary artery bypass grafting and incorporates age, creatinine, and left ventricular ejection fraction (LVEF). This simple score also has been validated in the “all-comers” patient population who underwent PCI. However, the performance of the ACEF score in the prediction of 1-year mortality has not been tested in 30-day survivors who underwent PCI after AMI. In the present study, we aimed to assess whether the simple ACEF score could predict the 1-year mortality in patients who survived for >30 days after AMI.
Methods
The Korean AMI Registry (KAMIR) is a Korean, prospective, open, observational, multicenter online registry of AMI with the support of Korean Society of Cardiology since November 2005. Details of the KAMIR have been previously published.
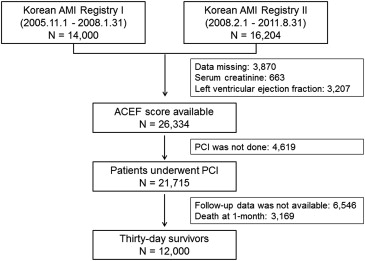
The flow diagram of the study is shown in Figure 1 . From November 2005 to August 2011, 30,204 patients with AMI were recruited in the KAMIR. The baseline clinical data including age, gender, serum creatinine levels, and LVEF were available in 26,334 patients, and PCI was performed in 21,715 during index hospitalization. Of these patients, 15,159 patients who had 1-year follow-up data and 12,000 patients who survived for >30 days after the index AMI were finally analyzed in the present study.
AMI was diagnosed based on a characteristic clinical presentation, serial changes on the electrocardiogram indicating infarction or injury, and increase in cardiac enzyme levels. We analyzed the baseline clinical characteristics, angiographic findings, procedural data, and discharge medications in hospital survivors.
The ACEF score was calculated according to the following formula: ACEF = age/LVEF + 1 (if creatinine was >2.0 mg/dl). The LVEF was determined using 2-dimensional echocardiography at the index AMI.
The clinical outcome of the present study was mortality at the 1-year follow-up. During the follow-up period, follow-up data were obtained by reviewing medical records and through a telephone interview with patients. All data were entered into an electronic Web-based case report form. The protocol was approved by the ethics committee of each participating institution.
Data are expressed as mean ± SD for continuous variables and percentages for categorical variables. All comparisons between the baseline variables were assessed using the Student’s t test for continuous variables and the Pearson’s chi-square test for categorical variables. Univariate analyses were performed to determine the predictors for 1-year mortality. The accuracy of each variable in predicting mortality was tested using receiver-operating characteristics (ROC) curve analysis. The values of area under the curve (AUC) were used to rank the variables according to their predictive accuracy. Cox proportional hazards model was used to determine the independent predictors of 1-year mortality. Twelve risk factors with p values <0.05 on univariate analysis, including age; gender; body mass index; current smoking status; history of coronary heart disease, hypertension, and diabetes mellitus; LVEF; total cholesterol levels; serum creatinine levels; multivessel disease; and optimal medical treatment, were selected and entered into Cox proportional hazards analyses to estimate the hazard ratios (HRs) and 95% confidence intervals (CIs) of 1-year mortality. The Hosmer-Lemeshow chi-square—a measure of deviation between observed and predicted outcomes in deciles of predicted risk—was used to evaluate the calibration of the model.
Different risk models were tested by progressively adding the 12 risk factors, one by one, in the order defined by the individual accuracy ranking (from the best to the worst). Each model was tested for accuracy, whether the higher AUC, the better the accuracy. Through ROC curve analysis, we identified the optimum cut-off value of the ACEF score at the point where the sum of sensitivity and specificity was the highest according to the Youden index: (sensitivity + specificity) − 1. We estimated the ROC curves and compared the AUC with 95% CI of the ACEF score and the conventional models, including the 12 earlier mentioned established risk factors, in corresponding logistic models.
Moreover, patients were categorized into 3 groups according to the tertiles of the ACEF score: ACEF LOW (ACEF score <1.0; n = 3,755), ACEF MID (ACEF score, 1.0 to 1.39; n = 4,470), and ACEF HIGH (ACEF score ≥1.4; n = 3,775). The cumulative incidence rates of 1-year mortality according to the ACEF score tertiles were estimated using the Kaplan-Meier method and compared using the log-rank test. Cox proportional hazards model analyses were performed to estimate the HRs and 95% CIs of 1-year mortality for increasing ACEF score tertiles, where the lowest tertile was used as the reference. The multivariate model included ACEF score tertiles and the earlier mentioned risk factors. For all analyses, a 2-sided p value of <0.05 was considered statistically significant. Statistical analysis was performed using the SAS software (version 9.3, SAS institute, Cary, NC).
Results
The baseline characteristics of the study subjects are listed in Table 1 . The mean age was 62.2 ± 12.4 years, and 8,760 (73.0%) were men. The mean ACEF score was 1.30 ± 0.53 (median, 1.18; range, 0.17 to 7.45).
| Variable | Entire patients (n=12,000) | Death | p value | |
|---|---|---|---|---|
| No (N=11,688) | Yes (N=312) | |||
| ACEF score | 1.30±0.53 | 1.28±0.50 | 1.95±0.82 | <0.001 |
| Age (year) | 62.2±12.4 | 61.9±12.3 | 70.9±10.7 | <0.001 |
| Male | 8,760 (73.0%) | 8,566 (73.3%) | 194 (62.2%) | <0.001 |
| Body mass index (kg/m 2 ) | 24.1±3.2 | 24.2±3.2 | 22.7±3.4 | <0.001 |
| Initial presentation | ||||
| Typical chest pain | 9,638 (81.7%) | 9,434 (81.9%) | 204 (71.6%) | <0.001 |
| Dyspnea | 2,389 (20.7%) | 2,286 (20.3%) | 103 (35.4%) | <0.001 |
| Systolic blood pressure (mmHg) | 129.8±29.8 | 129.9±29.7 | 125.2±32.9 | 0.014 |
| Diastolic blood pressure (mmHg) | 79.6±24.0 | 79.7±24.1 | 76.2±20.0 | 0.013 |
| Heart rate (beats/min) | 76.8±23.7 | 76.6±23.6 | 83.6±25.3 | <0.001 |
| Preinfarct angina pectoris | 5,268 (44.3%) | 5,133 (44.3%) | 135 (43.7%) | 0.831 |
| Killip class >1 | 2,799 (24.2%) | 2,639 (23.4%) | 160 (53.5%) | <0.001 |
| Electrocardiogram on admission | ||||
| ST-segment elevation | 7,351 (61.3%) | 7,160 (61.3%) | 191 (61.4%) | 0.977 |
| Anterior myocardial infarction | 5,378 (47.1%) | 5,219 (47.0%) | 159 (52.5%) | 0.059 |
| Inferior myocardial infarction | 4,274 (37.5%) | 4,164 (37.5%) | 110 (36.3%) | 0.674 |
| Left ventricular ejection fraction | 52.6±11.7 | 52.8±11.6 | 44.2±12.8 | <0.001 |
| Past history | ||||
| Coronary heart disease | 1,642 (13.8%) | 1,579 (13.6%) | 63 (20.4%) | 0.001 |
| Hypertension ∗ | 5,734 (48.4%) | 5,550 (48.0%) | 184 (60.5%) | <0.001 |
| Diabetes mellitus | 3,125 (26.4%) | 2,998 (26.0%) | 127 (41.8%) | <0.001 |
| Hyperlipidemia † | 1,347 (12.4%) | 1,319 (12.5%) | 28 (10.2%) | 0.268 |
| Current smoker | 5,376 (45.2%) | 5,267 (45.5%) | 109 (35.6%) | 0.001 |
| Laboratory findings | ||||
| Peak creatine-kinase MB (ng/mL) | 136.0±250.9 | 136.1±252.2 | 131.0±194.5 | 0.723 |
| Glucose (mg/dL) | 167.0±76.1 | 166.1±75.0 | 200.9±104.7 | <0.001 |
| Serum creatinine (mg/dL) | 1.13±1.09 | 1.12±1.07 | 1.63±1.51 | <0.001 |
| Total cholesterol (mg/dL) | 184.6±43.8 | 185.0±43.5 | 171.2±50.3 | <0.001 |
| Triglyceride (mg/dL) | 130.1±105.0 | 130.6±105.7 | 109.5±66.8 | <0.001 |
| HDL-cholesterol (mg/dL) | 44.6±18.9 | 44.7±19.0 | 43.2±15.0 | 0.185 |
| LDL-cholesterol (mg/dL) | 118.5±38.9 | 118.8±38.7 | 106.0±42.7 | <0.001 |
| Medication at discharge | ||||
| Antiplatelet agents | 11,810 (99.7%) | 11,560 (99.7%) | 250 (98.8%) | 0.008 |
| Beta-blockers | 9,438 (80.0%) | 9,258 (80.2%) | 180 (71.7%) | 0.001 |
| ACE-Is/ARBs | 10,023 (84.9%) | 9,827 (85.1%) | 196 (77.2%) | <0.001 |
| Statins | 9,336 (79.0%) | 9,155 (79.2%) | 181 (71.3%) | 0.002 |
| Nitrates | 7,304 (62.3%) | 7,148 (62.4%) | 156 (62.2%) | 0.948 |
| Calcium channel blockers | 1,038 (8.9%) | 1,008 (8.8%) | 30 (12.0%) | 0.082 |
| Optimal medical treatment ‡ | 6,697 (57.0%) | 6,583 (57.3%) | 114 (45.4%) | <0.001 |
∗ Defined as previously diagnosed by a physician, receiving medication to lower blood pressure.
† Defined as previously diagnosed by a physician, receiving lipid lowering drugs.
‡ Defined as the use of all 4 indicated medications (antiplatelet agents, beta-blockers, ACE-Is/ARBs, and statins).
Of the 12,000 30-day survivors, 312 (2.6%) died between 1 month and 1 year after the index AMI. The ACEF score was significantly higher in the nonsurvivors than in the survivors (1.95 ± 0.82 vs 1.28 ± 0.50; p <0.001). Of the nonsurvivors, the mean age was significantly higher, whereas male sex and current smoker status were significantly less frequent, and body mass index and LVEF were significantly lower compared with the survivors. A history of coronary heart disease, hypertension, and diabetes mellitus were more common in the nonsurvivors than in the survivors. Laboratory data indicated that the serum creatinine level was significantly higher, whereas the total cholesterol level was significantly lower in the nonsurvivors than in the survivors. The prescription rates of antiplatelet agents, β blockers, angiotensin-converting enzyme inhibitors/angiotensin type II receptor blockers, statins, and optimal medical treatment were significantly lower in the nonsurvivors than in the survivors. With regard to the angiographic and procedural characteristics, multivessel disease was significantly associated with 1-year mortality ( Table 2 ).
| Variable | Entire patients (n=12,000) | Death | p value | |
|---|---|---|---|---|
| No (n=11,638) | Yes (n=312) | |||
| Coronary angiography findings | ||||
| Coronary artery disease | 0.692 | |||
| Left main, isolated | 45 (0.4%) | 42 (0.4%) | 3 (1.0%) | |
| Left main, complex | 305 (2.5%) | 291 (2.5%) | 14 (4.5%) | |
| No. of coronary arteries narrowed | ||||
| 1 | 5,257 (43.9%) | 5,167 (44.3%) | 90 (29.0%) | |
| 2 | 3,726 (31.1%) | 3,635 (31.2%) | 91 (29.4%) | |
| 3 | 2,633 (22.0%) | 2,521 (21.6%) | 112 (36.1%) | |
| Multivessel disease | 6,709 (56.1%) | 6,489 (55.7%) | 220 (71.0%) | <0.001 |
| Infarct related coronary artery | 0.141 | |||
| Left main | 199 (1.7%) | 189 (1.6%) | 10 (3.2%) | |
| Left anterior descending | 5,683 (47.5%) | 5,531 (47.4%) | 152 (48.7%) | |
| Left circumflex | 2,065 (17.3%) | 2,011 (17.2%) | 54 (17.3%) | |
| Right | 4,024 (33.6%) | 3,928 (33.7%) | 96 (30.8%) | |
| ACC/AHA lesion B2/C | 8,536 (77.3%) | 8,297 (77.2%) | 239 (81.6%) | 0.077 |
| Pre TIMI flow 0/1 | 5,199 (45.4%) | 5,073 (45.5%) | 126 (42.3%) | 0.269 |
| Stent type | 0.535 | |||
| Bare-metal stent | 1,107 (9.9%) | 1,056 (9.7%) | 51 (18.9%) | |
| Sirolimus-eluting stent | 3,782 (33.8%) | 3,717 (34.1%) | 65 (24.1%) | |
| Paclitaxel-eluting stent | 2,904 (26.0%) | 2,840 (26.0%) | 64 (23.7%) | |
| Zotarolimus-eluting stent | 1,573 (14.1%) | 1,527 (14.0%) | 46 (17.0%) | |
| Everolimus-eluting stent | 1,101 (9.9%) | 1,074 (9.8%) | 27 (10.0%) | |
| Other drug-eluting stent | 708 (6.3%) | 691 (6.3%) | 17 (6.3%) | |
Twelve risk factors were selected and ranked according to their accuracy for predicting 1-year mortality. Of the 12 risk factors, age (AUC = 0.72), LVEF (AUC = 0.70), and serum creatinine levels (AUC = 0.66) showed the best accuracy. These 3 factors were subsequently entered into a Cox proportional hazards model as the ACEF score, which was found to be an independent predictor of 1-year mortality (HR 2.48; 95% CI 2.22 to 2.76; p <0.001), after adjusting for other risk factors ( Table 3 ).
| Variable | HR | 95% CI | p value |
|---|---|---|---|
| ACEF score | 2.48 | 2.22 – 2.76 | <0.001 |
| Male | 0.75 | 0.56 – 0.99 | 0.049 |
| Body mass index ≥25 kg/m 2 | 0.58 | 0.43 – 0.80 | 0.001 |
| Current smoking | 1.33 | 0.99 – 1.79 | 0.057 |
| Previous coronary heart disease | 1.32 | 0.97 – 1.81 | 0.082 |
| Hypertension | 1.29 | 0.99 – 1.70 | 0.063 |
| Diabetes mellitus | 1.26 | 0.96 – 1.66 | 0.091 |
| Total cholesterol ≥200 mg/dL | 0.72 | 0.53 – 0.98 | 0.034 |
| Multivessel disease | 1.62 | 1.21 – 2.17 | 0.001 |
| Optimal medical treatment | 0.74 | 0.57 – 0.95 | 0.019 |
Stay updated, free articles. Join our Telegram channel

Full access? Get Clinical Tree


