The purpose of this study was to determine the prognostic value of late gadolinium enhancement seen on cardiac magnetic resonance (CMR) imaging in patients with nonischemic cardiomyopathy (NICMP). Patients with NICMP are at increased risk for cardiovascular events and death. The presence of late gadolinium enhancement (LGE) in CMR may be associated with a poor prognosis, but its significance is still under investigation. We retrospectively studied 105 consecutive patients with NICMP and left ventricular ejection fraction (LVEF) ≤40% referred for CMR. The cohort was analyzed for the presence of LGE and left and right ventricular functional parameters. Patients were followed for the composite end point of hospitalization for congestive heart failure, appropriate implantable cardioverter-defibrillator therapy, or all-cause mortality. LGE was observed in 68% (n = 71) of the cohort. Both groups were similar in age, LVEF and LV end-diastolic volume. The LGE+ patients were more often men and had larger right ventricular volumes. At a mean follow-up of 806 ± 582 days, there were 26 patients (23 in the LGE+ group) who reached the primary end point. Event-free survival was significantly worse for the LGE+ patients. After adjusting for traditional risk factors (age, gender, and LVEF), patients with LGE had an increased risk of experiencing the primary end point (hazard ratio 4.47, 95% CIs 1.27 to 15.74, p = 0.02). The presence of LGE in patients with NICMP strongly predicts the occurrence of adverse events. In conclusion, this may be important in risk stratification and management.
In this study, we sought to determine whether late gadolinium enhancement (LGE) was an independent predictor of adverse cardiac events, namely death, hospitalization for heart failure, and appropriate implantable cardioverter defibrillator (ICD) therapy, in patients with nonischemic cardiomyopathy (NICM) with reduced left ventricular ejection fraction (LVEF).
Methods
This was a retrospective study of all patients referred to the Mount Sinai Medical Center in New York for evaluation of NICM by cardiac magnetic resonance (CMR) from February 2005 to May 2011. Consecutive patients with nonischemic cardiomyopathy and LVEF ≤40% were included in the study. Patients were excluded if they had (1) significant coronary artery disease (>70% diameter luminal stenosis in >1 epicardial vessels, or left main (>50%) or proximal left anterior descending disease, or a history of coronary revascularization, or myocardial infarction, or an abnormal myocardial stress test); (2) congenital heart disease; (3) ≥ moderate/severe valvular regurgitation; (4) infiltrative cardiomyopathy (amyloid or hemochromatosis); or (5) hypertrophic cardiomyopathy.
The cohort was analyzed for the presence or absence of LGE, amount of LGE, pattern of LGE, and standard left and right ventricular (RV) function parameters, and then followed for the primary composite end point of death, appropriate ICD therapy (antitachycardia pacing and defibrillation) for ventricular tachycardia/ventricular fibrillation or congestive heart failure (CHF) hospitalizations. Patients who had multiple outcomes were only counted for their first event. Death information was obtained from the National Social Security Death Index. CHF hospitalization and appropriate ICD therapy information was obtained from review of hospital records and outpatient charts. The study was approved by an institutional review board.
All patients underwent CMR using either a 1.5-T clinical magnet (Magnetom Sonata; Siemens Medical Solutions, Erlangen, Germany) or a 3.0-T clinical magnet (Achieva; Philips, Amsterdam, the Netherlands). Patients were scanned using a phased-array surface coil and electrocardiographic gating. Images were acquired at end-expiratory breath-holds. Following standard localizers, a stack of short-axis cine views which included both ventricles from base to apex were acquired using a standard steady-state free-precession cine sequence (1.5 T [3.0 T], repetion time (TR) 3.2 ms [3.5 ms], echo time (TE) 1.6 ms [1.7 ms], α 60° to 90° [45°], slice thickness 6 mm [8 mm], slice gap 4 mm [2 mm], bandwidth 930 Hz/px [1,953 hz∖px], temporal resolution 30-50 ms) with retrospective gating. Patients then were given an average intravenous dose of 0.2 mmol/Kg of gadopentetate dimeglumine (Magnevist; Berlex, New Jersey), followed by 20 ml of saline solution. After 5 to 10 minutes, contiguous short-axis views which matched the positions of the cine images were acquired using either an inversion-recovery gradient echo sequence (1.5 T [3.0 T]; TR 8.4 ms [5.4 ms]; TE 4.2 ms [2.7 ms]; α 25° [15°]; slice thickness 6 mm [8 mm]; slice gap 4 mm [2 mm]; bandwidth 130 Hz/px [306 Hz/px]; temporal resolution 200 to 250 ms), or, in the presence of arrhythmias or inability to perform apnea, a single-shot inversion-recovery steady-state free-precession sequence during free breathing (TR 2.5 ms, TE 1.1 ms, α 50°, slice thickness 6 mm, bandwidth 1,180 Hz/px, temporal resolution 270 ms).
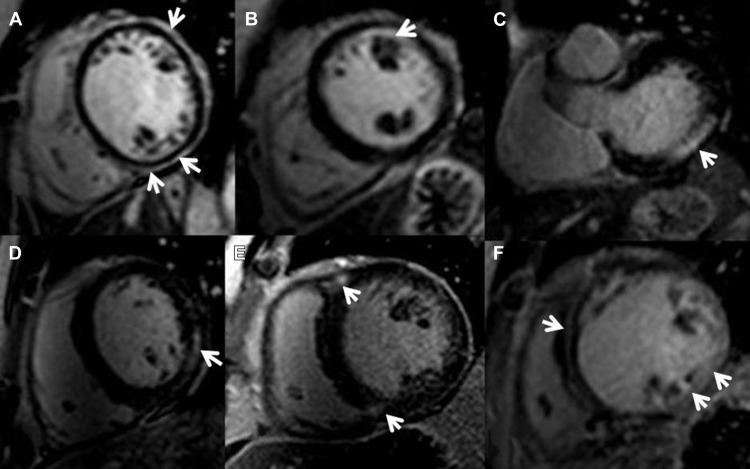
Ventricular functional and myocardial analysis were performed on commercially available workstations (Philips Workspace, Amsterdam The Netherlands and Argus, Erlanger, Germany) equipped with semiautomated software for volumetric analysis. Ventricular volumes, ejection fraction, and left ventricular (LV) myocardial mass were derived from short-axis slices after manual tracing of epicardial and endocardial borders, excluding papillary muscles from the myocardium. To exclude artifact, LGE was deemed present only if visible in 2 orthogonal views. The pattern of LGE was characterized as subepicardial, subendocardial, patchy intramyocardial, linear midwall, RV insertion points, or diffuse (combination of two or more patterns) Figure 1 . Extent of LGE was expressed as percent fibrosis of total myocardial mass (%LGE) and was analyzed using specialized software (VPT; Siemens Medical Solutions). The endocardial and epicardial borders were manually traced in all short-axis slices by a level 3 Society of Cardiac Magnetic Resonance-trained operator blinded to the patients’ clinical characteristics and outcomes, and a region of interest as large as possible was placed in remote, noninfarcted myocardium. Any enhancement that had a value of >2 SDs of that of noninfarcted myocardium was included as abnormal. Manual correction was used to eliminate bright signal from adjacent fat or blood containing voxels.
Continuous data are expressed as mean (SD) and categorical data as proportions. The baseline characteristics of the 2 groups (patients with and without LGE) were compared with the independent sample t test for continuous normally distributed variables. Wilcoxon rank-sum test was used for the variables that are not normally distributed. The chi-square or Fisher’s exact tests were used for categorical variables. Survival estimates and cumulative event rates were compared by the Kaplan–Meier method using the time to first event for the composite end point. The log-rank test was used to compare the Kaplan–Meier survival curves. The hazard ratios (HRs) with 95% CIs were calculated using Cox proportional model. A multivariable model was developed using all the covariates known to affect the end points. Ties in failure times were handled by Breslow’s method. The proportionality assumption was tested using all time-dependent variables in a model to make sure that the assumption is met. A time-dependent receiver-operating characteristic (ROC) analysis was performed to evaluate ability of %LGE to predict outcome. R “survival ROC” package was used to perform time-dependent ROC analysis.
All calculations were performed using SAS 9.3 (SAS Institute, Cary, North Carolina) for windows and R 3.0.1, and results were considered statistically significant when p <0.05.
Results
The study population comprised 105 patients who were followed for a mean of 806 ± 582 days. Seventy-one patients (68%) were LGE+. Table 1 outlines basic clinical and demographic characteristics of both groups. The LGE+ patients were more often men and had larger RV volumes. RV ejection fraction was also lower in this group although it did not reach statistical significance (p = 0.08). The groups were similar in terms of age, baseline risk factors, medical treatment, and LV functional parameters. In many cases, these patients were diagnosed at the time of the CMR and were not on optimal CHF medications at the time of the scan.
| Variable | Late Gadolinium Enhancement + (n = 71) | Late Gadolinium Enhancement – (n = 34) | p-Value ∗ |
|---|---|---|---|
| AGE (Years) | 49 ± 15 | 53 ± 13 | 0.113 |
| Men | 45 (63%) | 14 (41%) | 0.038 |
| Hypertension | 27 (40%) | 13 (42%) | 1.00 |
| Diabetes Mellitus | 13 (19%) | 8 (26%) | 0.597 |
| Smoker | 7 (10%) | 4 (14%) | 0.726 |
| Beta Blocker | 46 (68%) | 22 (79%) | 0.332 |
| Angiotensin-Converting Enzyme/Angiotensin Receptor Blocker | 50 (74%) | 24 (86%) | 0.286 |
| Diuretic | 38 (56%) | 12 (43%) | 0.269 |
| Cardiac Magnetic Resonance dimensions and functions (Standard Deviation) | |||
| Left Ventricular Ejection Fraction | 25 ±9 | 26 ±9 | 0.451 |
| Right Ventricular Ejection Fraction | 38 ±14 | 44 ±15 | 0.079 |
| Left Ventricular End-Diastolic Volume (milliliters) | 298 ±106 | 271 ±104 | 0.187 |
| Left Ventricular End-Systolic Volume (milliliters) | 227 ±99 | 204 ±95 | 0.202 |
| Right Ventricular End Diastolic Volume (milliliters) | 200 ±81 | 161 ±67 | 0.012 |
| Right Ventricular End-Systolic Volume (milliliters) | 131 ±75 | 95 ±58 | 0.009 |
∗ p Values are from Wilcoxon rank-sum test for continuous variable and Fisher’s exact test for categorical variables.
LGE patterns, in decreasing order of frequency, were diffuse (n = 33 [44%]), RV insertion points (n = 18 [25%]), linear midwall (n = 11 [15%]), subepicardial (n = 5 [7%]), patchy intramyocardial (n = 4 [6%]), and subendocardial (n = 2 [35]). Patients with the diffuse pattern had the highest mean LGE% with 13.1 ± 13.3%, whereas the RV insertion pattern had the lowest (3.6 ± 3.0%).
The composite end point was met in 26 patients of whom 23 were in the LGE+ group; thus, the event rate was 32% in the LGE+ group versus 9% in the LGE− group ( Table 2 ). The yearly event rate for the composite end point was 14.3%. There were 9 deaths, 14 ICD therapies, and 14 hospitalizations for CHF between both groups. In the LGE+ group, there were 14 patients who had CHF hospitalizations (9 of them had multiple admissions), 12 patients who had an appropriate ICD therapy, and 8 deaths. There were 8 patients who experienced ≥2 end points. There were only 3 events in the LGE− group: 1 death and 2 appropriate ICD therapies ( Table 2 ). In univariate analyses LGE+, LVEF, RV ejection fraction, LV end-diastolic volume, LV end-systolic volume, RV end-diastolic volume, and RV end-systolic volume were predictors of adverse events. When these variables were entered into a multivariate analysis, the presence of LGE remained an independent risk factor and highest predictor for experiencing an adverse event (HR 4.47, 95% CI 1.27 to 15.74, p = 0.02) while adjusting for age, gender, LVEF, RV ejection fraction, LV end-systolic volume, and RV end-systolic volume. Age (HR per year 1.03, 95% CI 1.001 to 1.07, p = 0.045) and larger LV end-systolic volume (HR per ml 1.01, 95% CI 1.001 to 1.012, p = 0.016) although weaker also were independent predictors of events ( Table 3 ). Kaplan–Meier analyses demonstrate cumulative event rates, and survival curves are significantly different (p = 0.0137) between the groups ( Figure 2 ).
| Endpoints | Delayed Enhancement + n = 71 | Delayed Enhancement – n = 34 |
|---|---|---|
| Composite Outcome | 23 (32%) | 3 (9%) |
| CHF hospitalization | 14 (19%) | 0 (0%) |
| ICD therapy | 12 (17%) | 2 (6%) |
| Death | 8 (11%) | 1 (3%) |
| Variable | Unadjusted Models | Adjusted Model | ||||
|---|---|---|---|---|---|---|
| Beta (SE) | HR (95% CI) | p-Value ∗ | Beta(SE) | HR (95% CI) | p-Value † | |
| Group (+Delayed Enhancement) | 1.4(0.61) | 4.05 (1.2, 13.5) | 0.023 | 1.5(0.64) | 4.47(1.27, 15.74) | 0.02 |
| Age | 0.003(0.014) | 1.003(0.97, 1.03) | 0.854 | 0.03(0.02) | 1.03(1.001, 1.07) | 0.045 |
| Male | 0.58(0.44) | 1.78(0.75, 4.23) | 0.194 | 0.20(0.47) | 1.22(0.48, 3.07) | 0.674 |
| Left ventricular Ejection Fraction | -0.08(0.03) | 0.92(0.88, 0.97) | 0.002 | -0.05(0.05) | 0.95(0.87, 1.04) | 0.292 |
| Right Ventricular Ejection Fraction | -0.03(0.01) | 0.97(0.94, 0.99) | 0.013 | 0.002(0.03) | 1.002(0.94, 1.06) | 0.950 |
| Left ventricular End-Diastolic Volume (milliliters) | 0.006(0.001) | 1.007(1.004, 1.009) | <.0001 | ——– | ——— | ——- |
| Left Ventricular End-Systolic Volume (milliliters) | 0.007(0.002) | 1.007(1.004, 1.01) | <.0001 | 0.006(0.003) | 1.01(1.001, 1.012) | 0.016 |
| Right Ventricular End-Diastolic Volume (milliliters) | 0.005(0.002) | 1.005(0.002, 1.009) | 0.004 | ——– | ——— | ——- |
| Right Ventricular End-Systolic Volume (milliliters) | 0.006(0.002) | 1.006(1.003, 1.01) | 0.001 | -0.001(0.003) | 0.999(0.992, 1.006) | 0.757 |
Stay updated, free articles. Join our Telegram channel

Full access? Get Clinical Tree


