Early repolarization associated with sudden cardiac death is based on the presence of >1-mm J-point elevations in inferior and/or lateral leads with horizontal and/or downsloping ST segments. Automated electrocardiographic readings of early repolarization (AER) obtained in clinical practice, in contrast, are defined by ST-segment elevation in addition to J-point elevation. Nonetheless, such automated readings may cause alarm. We therefore assessed the prevalence and prognostic significance of AER in 211,920 patients aged 18 to 75 years. The study was performed at a tertiary medical center serving a racially diverse urban population with a large proportion of Hispanics (43%). The first recorded electrocardiogram of each individual from 2000 to 2012 was included. Patients with ventricular paced rhythm or acute coronary syndrome at the time of acquisition were excluded from the analysis. All automated electrocardiographic interpretations were reviewed for accuracy by a board-certified cardiologist. The primary end point was death during a median follow-up of 8.0 ± 2.6 years. AER was present in 3,450 subjects (1.6%). The prevalence varied significantly with race (African-Americans 2.2%, Hispanics 1.5%, and non-Hispanic whites 0.9%, p <0.01) and gender (male 2.4% vs female 0.6%, p <0.001). In a Cox proportional hazards model controlling for age, smoking status, heart rate, QTc, systolic blood pressure, low-density lipoprotein cholesterol, body mass index, and coronary artery disease, there was no significant difference in mortality regardless of race or gender (relative risk 0.98, 95% confidence interval 0.89 to 1.07). This was true even if J waves were present. In conclusion, AER was not associated with an increased risk of death, regardless of race or gender, and should not trigger additional diagnostic testing.
Highlights
- •
Early repolarization prevalence in Hispanics was intermediate to African-Americans and Caucasians.
- •
Automated electrocardiographic readings of early repolarization did not confer an increased risk of mortality.
- •
The aforementioned finding was true regardless of race or gender.
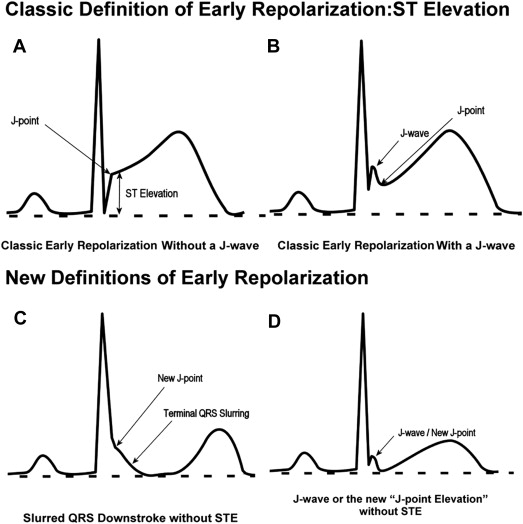
Electrocardiographic (ECG) machines used commonly in clinical practice use interpretation algorithms that define early repolarization (ER) by detecting ST-segment elevation (STE) in addition to elevation of the J point. Examples of different forms of ER are shown in Figure 1 . In light of the association between ER and sudden cardiac death, such automated readings may cause alarm, trigger unnecessary diagnostic workup, and potentially create liability issues. To better understand the clinical significance of automatically detected ER (AER), we investigated its prevalence and prognostic significance in a racially diverse population, including a large proportion of Hispanics.
Methods
The study population consisted of inpatients and outpatients aged 18 to 75 years who had a standard 12-lead electrocardiogram at rest recorded at Montefiore Medical Center from 2000 to 2012 (n = 238,456). Only the first recorded electrocardiogram for each individual was included in the analysis. The primary end point was death from any cause before the end of 2013 as determined by investigating the electronic medical record and Social Security Death Index. The Social Security Death Index records all deaths in the United States, and the quality and reliability of this register have been validated previously. Loss to follow-up in our study was <2%. The study was performed without the support of external funding and was approved by the local institutional review board.
In addition to data from the ECG recordings, age, gender, self-reported race, systolic and diastolic blood pressure measurements, low-density lipoprotein cholesterol, body mass index, and smoking status were available for analysis through the hospital electronic medical record using Clinical Looking Glass. Our study was designed to assess the prevalence and prognostic significance of AER in this population. We excluded 23,019 electrocardiograms recorded during acute coronary syndrome, 3,105 electrocardiograms with ventricular pacing, and 412 electrocardiograms with artifact or uninterpretable tracings. Thus, the study population consisted of 211,920 subjects (52% men, mean age 58 ± 13 years).
At baseline, standard 12-lead electrocardiograms at rest were recorded at a paper speed of 25 mm/s. All electrocardiograms were automatically interpreted by the ECG machine software (Marquette 12SL ECG analysis program; GE Healthcare, Cleveland, Ohio). This software determines the presence of ER in a stepwise manner using several criteria, including a low ST:T ratio and a normal repolarization character (upright T in appropriate leads and ST segment aligned with the T wave). The analysis is performed in a stepwise manner. First, the software will exclude injury based on the degree of ST elevation, ST:T ratio, and reciprocal changes. If no injury is defined, the software will continue to test for ER only if the following criteria are met: (1) the test will be skipped and/or stopped if QRS duration is >140 ms, complete bundle branch block is present, or right or left ventricular hypertrophy or acute myocardial infarction is present; (2) the test will continue if corrected QT interval is from 370 to 460 ms; (3) QRS duration is <120 ms or if any ST elevation >200 μV is present in the precordial leads; and (4) the QRS balance is positive (QRS balance = maximum R amplitude − maximum S amplitude). If the aforementioned criteria are met, then the software will count all leads from V 1 to V 6 with a QRS balance >0 in which both STJ elevation and STM elevation are >75 μV and the number of leads from I, II, III, and aVF with a QRS balance >0 in which ST amplitude is >50 μV. The software will then compute the sum of the amplitudes of the smaller of STJ (STJ is defined as the ST level, with respect to QRS onset, at the QRS offset commonly referred to as the “J point”) and STM (STM is the ST level at the QRS offset plus 1/16 of the average RR interval) for each lead that passes this test and classify the electrocardiogram as “early repolarization” if >5 leads pass this ER test and the T wave is tall (T waves with amplitudes that exceed 1.20 mV or for positive T waves that exceed 0.50 mV and are also >1/2 the size of the peak-to-peak QRS voltage) in ≥5 leads, and the sum calculated in the ER test is >500 μV. ECG signs of coronary artery disease (CAD) were defined automatically by the software according to Minnesota criteria.
All automated ECG interpretations were reviewed for accuracy by a board-certified cardiologist who confirmed the presence or absence of ER on the basis of the classic definition of ER. Interpretation was performed at the time of acquisition and stored electronically (MUSE ECG database; GE Healthcare). To ensure diagnostic accuracy, a subset of 2,200 randomly selected electrocardiograms were carefully examined manually. The κ value between automatically and manually determined ER in this subset was 0.82. In the analysis, only the electrocardiograms classified as ER by the automated algorithm were considered as AER in this study.
All electrocardiograms flagged as AER were visually inspected, and AER was categorized as anterior, inferior, or lateral in localization depending on the lead with the highest amplitude of STE. Electrocardiograms classified as AER were also inspected for the presence of inferior and/or lateral J waves (inferior: II, II, and aVF; lateral: I, aVL, V 5 , and V 6 ). An example is given in Figure 1 .
Continuous variables are presented as means ± SDs, and categorical variables are presented as percentages in each group. The Student t test or Mann-Whitney U tests were used as appropriate to compare means. When comparing multiple means, the Kruskal-Wallis 1-way analysis of variance test was applied. The relative risk and 95% confidence intervals for death were calculated with a Cox proportional hazards model. The primary adjustments in these models were for age, gender, and race with further adjustments for covariates that were selected on the basis of previous evidence of an association with death from cardiovascular causes or any cause that was available. In the multivariate model, age, heart rate (HR), QTc interval, systolic blood pressure, low-density lipoprotein cholesterol, and body mass index were added as continuous variables. Gender, race, smoking status, and ECG signs of CAD were added as categorical variables. Kaplan-Meier survival curves were plotted for AER presence and absence and were compared by means of the log-rank test. The statistical analyses were performed with SPSS software, version 20 (IBM Corporation, Armonk, New York). A 2-tailed p value <0.05 was considered statistically significant.
Results
AER was present in 3,450 subjects (1.5%). The ST-segment amplitude was highest in anterior leads in 1,922 subjects, lateral leads in 910 subjects, and inferior leads in 618 subjects. The baseline characteristics of subjects with and without AER are listed in Table 1 . Inferior and/or lateral J-wave notching and/or slurring was present in 1,348 subjects (39%) with AER. Inferior J waves were present in 851 subjects, and lateral J waves were present in 497 subjects. J waves in both inferior and lateral leads occurred in 1,003 subjects. The baseline characteristics of subjects with AER with and without J waves are listed in Table 2 .
| Characteristic | Early Repolarization | p Value ∗ | |
|---|---|---|---|
| Absent | Present | ||
| (n =208,470) | (n = 3450) | ||
| All subjects | 98.5% | 1.5% | — |
| Male | 97.6% | 2.4% | — |
| Female | 99.4% | 0.6% | — |
| African American | 97.8% | 2.2% | — |
| Non-Hispanic white | 99.1% | 0.9% | — |
| Hispanic | 98.5% | 1.5% | — |
| Age (years) | 58 ± 13 | 51 ± 13 | <0.001 |
| Heart rate (beats/minute) | 77 ± 15 | 75 ± 16 | <0.001 |
| Smoker | 23% | 24% | ns |
| Prior MI | 3.5% | 3.5% | ns |
| Body mass index (kg/m 2 ) | 27.5 ± 3.2 | 26.9 ± 3.4 | <0.001 |
| Blood pressure (mm Hg) | |||
| Systolic | 137 ± 20 | 135 ± 22 | <0.001 |
| Diastolic | 85 ± 14 | 83 ± 14 | <0.001 |
| LDL cholesterol (mg/dL) | 126 ± 28 | 126 ± 29 | ns |
| QTc (ms) | 403 ± 27 | 401 ± 27 | <0.001 |
| QRS (ms) | 87 ± 9 | 88 ± 11 | ns |
| CAD criteria on ECG † | 16.5% | 12.4% | <0.001 |
∗ p Value comparing “no ER” and “ER” groups.
† Criteria for diagnosis of CAD corresponded to Minnesota codes 1.1 to 1.3, 5.1 to 5.2, 4.1 to 4.3, 7.1, and 7.4.
| Characteristic | J-Waves | p Value ∗ | |
|---|---|---|---|
| Absent | Present | ||
| (n = 2102) | (n = 1348) | ||
| All subjects | 61% | 39% | — |
| Male | 35% | 65% | — |
| Female | 56% | 44% | — |
| African American | 50% | 50% | — |
| Non-Hispanic white | 17% | 83% | — |
| Hispanic | 38% | 62% | — |
| Age (years) | 50 ± 12 | 52 ± 14 | <0.001 |
| Heart rate (beats/minute) | 77 ± 17 | 74 ± 16 | <0.001 |
| Smoker | 24% | 24% | ns |
| History of MI | 3.4% | 3.5% | ns |
| Body mass index (kg/m 2 ) | 27.1 ± 3.7 | 26.8 ± 4.1 | ns |
| Blood pressure (mm Hg) | |||
| Systolic | 136 ± 21 | 135 ± 20 | ns |
| Diastolic | 83 ± 15 | 83 ± 16 | ns |
| LDL cholesterol (mg/dL) | 125 ± 30 | 126 ± 31 | ns |
| QTc (ms) | 405 ± 30 | 398 ± 31 | <0.001 |
| QRS (ms) | 86 ± 9 | 89 ± 11 | <0.001 |
| CAD criteria on ECG † | 12.1% | 12.6% | ns |
Stay updated, free articles. Join our Telegram channel

Full access? Get Clinical Tree


