Association between clinical factors and high-risk plaque features, such as, thin or ruptured cap, intraplaque hemorrhage, presence of lipid-rich necrotic core (LRNC), and increased LRNC volume as assessed by magnetic resonance imaging (MRI), was examined in patients with established vascular disease in the Atherothrombosis Intervention in Metabolic Syndrome With Low HDL/High Triglycerides (AIM-HIGH) trial. A total of 214 subjects underwent carotid MRI and had acceptable image quality for assessment of plaque burden, tissue contents, and MRI-modified American Heart Association lesion type by a core laboratory. We found that 77% of subjects had carotid plaques, 52% had lipid-containing plaques, and 11% had advanced American Heart Association type-VI lesions with possible surface defect, intraplaque hemorrhage, or mural thrombus. Type-VI lesions were associated with older age (odds ratio [OR] = 2.6 per 5 years increase, p <0.001). After adjusting for age, these lesions were associated with history of cerebrovascular disease (OR = 4.1, p = 0.01), higher levels of lipoprotein(a) (OR = 2.0 per 1 SD increase, p = 0.02), and larger percent wall volume (PWV [OR = 4.6 per 1 SD increase, p <0.001]) but, were negatively associated with metabolic syndrome (OR = 0.2, p = 0.02). Presence of LRNC was associated with the male gender (OR = 3.2, p = 0.02) and PWV (OR = 3.8 per 1 SD, p <0.001); however, it was negatively associated with diabetes (OR = 0.4, p = 0.02) and high-density lipoprotein cholesterol levels (OR = 0.7 per 1 SD, p = 0.02). Increased percent LRNC was associated with PWV (regression coefficient = 0.36, p <0.001) and negatively associated with ApoA1 levels (regression coefficient = −0.20, p = 0.03). In conclusion, older age, male gender, history of cerebrovascular disease, larger plaque burden, higher lipoprotein(a), and lower high-density lipoprotein cholesterol or ApoA1 level have statistically significant associations with high-risk plaque features. Metabolic syndrome and diabetes showed negative associations in this population.
Highlights
- •
This study found that among patients with established vascular disease and well treated for LDL-C and blood pressure in AIM-HIGH, 77% had carotid plaques, 52% of subjects had lipid-containing plaques, and 11% had advanced, American Heart Association type VI lesions with intraplaque hemorrhage, surface defect or thrombus. Subjects qualified for this study if they had a history of dyslipidemia and major vascular disease, not exclusively carotid atherosclerosis, and yet a significant proportion were found to have advanced carotid plaque features despite the prior use of statin and well-controlled LDL-C at baseline. These observations in plaque morphology suggest the study population was at increased residual cardiovascular (CV) risk and are consistent with significant CV event rate in AIM-HIGH.
Development of high-resolution magnetic resonance imaging (MRI) techniques in recent years has made it possible to directly assess plaque burden and composition. Prospective MRI studies of carotid lesions offer compelling evidence that high-risk plaque features, such as, thin or ruptured cap, intraplaque hemorrhage (IPH), presence of lipid-rich necrotic core (LRNC), and increased LRNC volume, strongly associate with clinical cerebrovascular events as well as coronary heart disease events. We designed a multicenter carotid MRI study in the AIM-HIGH trial (Atherothrombosis Intervention in Metabolic Syndrome With Low HDL/High Triglycerides: Impact on Global Health Outcomes) to directly assess atherosclerotic plaque burden and tissue contents in patients with established vascular disease and well-controlled low-density lipoprotein cholesterol (LDL-C) levels and blood pressure, but, with elevated triglycerides and low level of high-density lipoprotein cholesterol (HDL-C). This report examines the association of clinical factors with the presence of baseline high-risk carotid plaque features as assessed by MRI in AIM-HIGH.
Methods
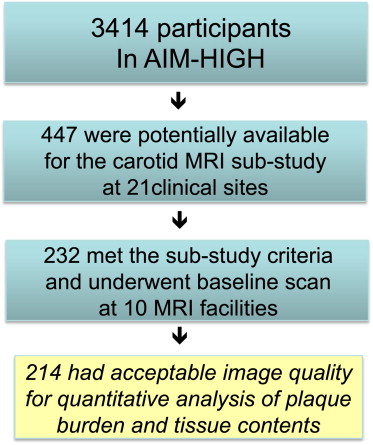
In a total of 3,414 AIM-HIGH participants, 447 were potentially available to be enrolled in the carotid MRI substudy at 21 clinical sites based on the recruitment dates of each subject and the start of enrollment for the MRI substudy. The AIM-HIGH study enrolled men and women, aged ≥45, with atherogenic dyslipidemia consisting of low HDL-C levels (if off statin ≤40 mg/dl for men or ≤50 mg/dl for women), high triglycerides (if off statin 150 to 400 mg/dl), and untreated LDL-C levels ≤180 mg/dl and documented clinically established atherosclerotic cardiovascular disease. Of these 447, there were 232 who met the inclusion or exclusion criteria-estimated glomerular filtration rate ≥60 ml/min/1.73 m 2 , had no contraindication to MRI, no history of claustrophobia, and consented to participate in the substudy. These subjects underwent the baseline carotid scan from February 2008 to May 2010 at 10 MRI centers. Details of site location, principal investigator, and coordinator information are listed in the Appendix . Two hundred fourteen subjects had acceptable image quality for assessment at baseline; as shown in Figure 1 . This study was approved by the AIM-HIGH Executive Committee and local institutional review board and/or research ethics committee at each participating clinical site. Separate signed informed consent was obtained from participants in this substudy.
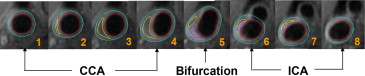
The carotid MRI substudy in AIM-HIGH was a large multicenter investigation using either GE (GE Healthcare, Global Diagnostic Imaging, Pewaukee, Wisconsin) or Philips (Philips Healthcare, Andover, Massachusetts) 3T whole body scanners. A standardized carotid MRI scan protocol with multicontrast sequences as listed in Table 1 was developed by the University of Washington’s Vascular Imaging Laboratory to achieve clear identification of carotid outer wall and lumen boundaries, as well as, plaque tissue contents. Subjects were placed in the supine position in the MRI scanner with the neck extended to bring the carotid arteries into a more superficial location relative to the skin. A custom-designed head holder was used to minimize movement. Two separate phased-array carotid coils were used to obtain a simultaneous bilateral scan. As listed in Table 1 , after the oblique scans, cross-sectional images with 2 mm thickness and a total coverage of 3.2 cm were obtained, centered at the common carotid bifurcation. A 20 ml (0.1 mmol/kg) bolus of gadolinium contrast material was administrated intravenously through a power injector for the dynamic contrast-enhanced MRI and postcontrast imaging. The T1-weighted (T1W) sequence was repeated between 5 and 7 minutes after contrast administration. The total scan time for each subject was <45 minutes per scan. The carotid artery with the thicker wall or larger plaque with less calcification on the baseline scan was assigned as the index side.
| Parameters | T1 Weighted | T2 Weighted | 3D Time-of-Flight (TOF) | 3D Magnetization Prepared Rapid Gradient Echo (MP-RAGE) | Dynamic Contrast-Enhanced |
|---|---|---|---|---|---|
| Gadolinium contrast | No/yes | No | No | No | Yes |
| Scan plane | Axial | Axial | Axial | Axial | Axial |
| Repetition time (msec) | 800 | 4800 | 24 | 13 | 125 |
| Echo time (msec) | 10 | 50 | Min | Min | 4.6 |
| Field-of-view (cm 2 ) | 16 × 16 | 16 × 16 | 16 × 16 | 16 × 16 | 16 × 16 |
| Resolution (mm 2 ) | 0.63 × 0.63 | 0.63 × 0.63 | 0.63 × 0.63 | 0.63 × 0.63 | 0.63 × 0.63 |
| Slice thickness (mm) | 2 | 2 | 1 ∗ | 1 ∗ | 2 |
| Coverage (mm) | 32 | 32 | 48 | 48 | 16 |
| Blood suppression | Quadruple inversion recovery | Multi-slice double inversion recovery | Saturation-veins | No | Saturation arteries/veins |
| Fat suppression | Yes | Yes | No | Yes | Yes |
| Averages | 1 | 1 | 1 | 1 | 1 |
MRI personnel from all imaging sites participated in an MRI training session held by the core laboratory. They were instructed on study design, magnetic resonance protocol design, image acquisition, and identification and correction of imaging artifacts. After the training, each imaging site was required to perform a phantom scan, as well as, a scan of a volunteer using the study protocol. Adherence to protocol parameters, image quality, and presence of artifacts were assessed. Immediate feedback and technical support were provided to the site to remedy any protocol deviations and image quality issues.
All study scans were transferred to the core laboratory and reviewed for image quality and protocol deviations within 48 hours of the scan. Vessel Wall image quality was assessed based on a previous described 4-point scale. Scans of inadequate quality were repeated. If the repeat scan did not qualify by image quality, then the subject was excluded from the study. Reviewers trained in carotid MRI analysis interpreted all images, blinded to subject information, therapy, and laboratory results. All images from time-of-flight, T1, proton density (PD), T2, 3D Magnetization Prepared Rapid Gradient Echo (MP-RAGE), and postcontrast T1 weightings were co-registered, using the common carotid bifurcation as a physical landmark. For each case, 2 reviewers reached consensus for the measurements made. Plaque components (LRNC, fibrous tissue, loose matrix, and calcification) were identified using previously published MRI criteria.
CASCADE (UW Radiology, Seattle, WA), a custom-designed image analysis tool, was used to contour boundaries of the lumen, outer wall, and plaque components ( Figure 2 ). Volumes were derived by summing the contour areas across slices from the same vessel and multiplying the sum by the slice thickness (2 mm). The primary measure of plaque burden was percent wall volume (PWV), calculated using the following formula: (wall volume/total vessel volume) × 100%. PWV adjusts for variation in artery size and is similar to percent atheroma volume described in the intravascular ultrasound literature. The percent volume of each component was calculated using the formula: (component volume/wall volume) × 100%. In particular, percent LRNC volume was calculated using only the slices with LRNC present.
American Heart Association (AHA) lesion types were evaluated using previously published MRI-based criteria : type I to II = near-normal wall thickness; type III = diffuse wall thickening or small eccentric plaque; type IV to V = plaque with a necrotic core; type VI = complex plaque with a possible surface defect, intraplaque hemorrhage, or mural thrombus; type VII = calcified plaque; and type VIII = fibrotic plaque without a necrotic core. The Carotid Atherosclerosis Score (CAS) for each plaque was computed with an adjustment to include AHA type-VI lesions in the highest risk category as previously described : CAS 1 (low risk) = plaque with maximum wall thickness ≤2 mm; CAS 2 (medium to low risk) = plaque with maximum percent LRNC (LRNC area/wall area) ≤20%; CAS 3 (medium to high risk) = plaque with maximum percent LRNC 20% to 40%; CAS 4 (high risk) = plaque with maximum percent LRNC >40% or AHA type-VI lesion.
Clinical characteristics of subjects in the MRI substudy were compared with those of the remainder of the AIM-HIGH cohort using Fisher’s exact test and the Mann-Whitney test. Linear and logistic regression models were used to evaluate associations with continuous and binary plaque outcomes, respectively. Continuous variables were visually inspected using histograms and quantile-quantile plots to determine whether the distributional assumptions were appropriate. Highly right-skewed variables were log-transformed before inclusion in regression models. Throughout the regression analyses, continuous variables (outcome and independent variables) were standardized to have SD = 1. For multivariate analysis, adjustments were made for age, gender, and PWV, and variables statistically significant after these adjustments were included in the final multivariate models. All statistical calculations were conducted with the R statistical software package (R Foundation for Statistical Computing, Vienna, Austria). Throughout, 2-tailed tests were used with p <0.05 denoting statistical significance.
Results
As listed in Table 2 , compared with the rest of the AIM-HIGH cohort (n = 3,200), the 214 subjects in the MRI substudy had the following statistically significant differences: they were younger (mean 61 vs 64 years, p <0.001), more likely to be nonwhite (12% vs 7%, p = 0.02), more likely to have hypertension (83% vs 71%, p <0.001), less likely to be treated with statin for 1 year or longer (72% vs 82%, p = 0.001), and less likely to have diabetes (25% vs 35%, p = 0.004). They also had smaller body mass index (mean 30 vs 31 kg/m 2 , p = 0.009) and lower triglycerides (median 158 vs 165 mg/dl, p = 0.03).
| Variable | In MRI Study (N = 214) | Not in MRI Study (N = 3200) | p-Value ∗ | Tot. N | ||||
|---|---|---|---|---|---|---|---|---|
| Male | 175 (82%) | 2735 (85%) | 0.16 | 3414 | ||||
| Female | 39 (18%) | 465 (15%) | ||||||
| Age (years) | 61 ± 9 | 61 | (45–80) | 64 ± 9 | 64 | (44–89) | <0.001 | 3414 |
| White | 187 (88%) | 2961 (93%) | 0.017 | 3413 | ||||
| Non-white/other | 26 (12%) | 239 (7%) | ||||||
| Hispanic or Latino | 10 (5%) | 130 (4%) | 0.59 | 3413 | ||||
| Not Hispanic or Latino | 203 (95%) | 3070 (96%) | ||||||
| Statin therapy ≥1 year | 151 (72%) | 2458 (82%) | 0.001 | 3210 | ||||
| Coronary artery disease | 203 (95%) | 2944 (92%) | 0.15 | 3414 | ||||
| Prior cerebrovascular disease | 34 (16%) | 686 (21%) | 0.057 | 3414 | ||||
| Stroke or transient ischemic attack | 21 (10%) | 325 (10%) | >0.99 | 3414 | ||||
| Carotid disease | 23 (11%) | 475 (15%) | 0.11 | 3414 | ||||
| Hypertension | 178 (83%) | 2261 (71%) | <0.001 | 3414 | ||||
| Smoker | 151 (71%) | 2388 (75%) | 0.14 | 3388 | ||||
| Diabetes mellitus | 53 (25%) | 1105 (35%) | 0.004 | 3414 | ||||
| Metabolic syndrome (+) | 175 (82%) | 2592 (81%) | 0.79 | 3403 | ||||
| Body mass index (kg/m 2 ) | 30 ± 5 | 30 | (17–47) | 31 ± 5 | 30 | (14–64) | 0.009 | 3409 |
| Systolic blood pressure (mm Hg) | 128 ± 17 | 128 | (84–180) | 128 ± 16 | 128 | (85–215) | 0.85 | 3412 |
| Diastolic blood pressure (mm Hg) | 75 ± 10 | 74 | (47–116) | 74 ± 10 | 74 | (35–128) | 0.59 | 3411 |
| Total cholesterol (mg/dl) | 146 ± 31 | 144 | (70–262) | 145 ± 27 | 143 | (74–290) | 0.92 | 3414 |
| Non-HDL cholesterol (mg/dl) | 111 ± 30 | 107 | (48–222) | 111 ± 27 | 108 | (47–252) | 0.86 | 3414 |
| LDL cholesterol (mg/dl) | 77 ± 27 | 73 | (19–180) | 74 ± 23 | 72 | (20–180) | 0.22 | 3414 |
| HDL cholesterol (mg/dl) | 35 ± 6 | 35 | (18–52) | 35 ± 6 | 35 | (16–53) | 0.88 | 3414 |
| Triglycerides (mg/dl) | 174 ± 66 | 158 | (100–400) | 183 ± 67 | 165 | (93–399) | 0.031 | 3414 |
| Lipoprotein(a) (mg/dl) | 81 ± 93 | 32 | (0.3–341) | 76 ± 88 | 34 | (0.1–620) | 0.63 | 3359 |
| ApoB (mg/dl) | 86 ± 23 | 84 | (32–175) | 83 ± 20 | 81 | (30–329) | 0.077 | 3353 |
| ApoA1 (mg/dl) | 121 ± 16 | 122 | (59–168) | 123 ± 16 | 123 | (61–194) | 0.35 | 3353 |
∗ Fisher’s exact test (categorical variables) or the Mann-Whitney test (continuous variables).
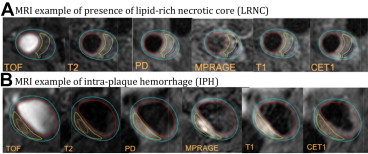
From examination of the carotid MRI of the 214 subjects, mean PWV was 42 ± 7%, 77% of patients had carotid plaques, 52% were found to have lipid-containing plaques as shown in Figure 3 and 11% had advanced AHA type-VI lesions ( Table 3 ). Similarly, 26 subjects (12%) showed high-risk plaques with CAS = 4. Figure 3 shows an MRI example of IPH with noticeable increased signal intensity on T1 and MP-RAGE.
| All Subjects | Value | ||
|---|---|---|---|
| AHA lesion type (any) | |||
| III | 124 (58%) | ||
| IV–V | 110 (51%) | ||
| VI | 23 (11%) | ||
| VII | 76 (36%) | ||
| AHA lesion type (most severe ∗ ) | |||
| I–II (no detectable plaque) | 49 (23%) | ||
| III | 21 (10%) | ||
| IV–V | 91 (43%) | ||
| VI | 23 (11%) | ||
| VII | 30 (14%) | ||
| Carotid Atherosclerosis Score (CAS) | |||
| 1 (low risk) | 75 (35%) | ||
| 2 (medium–low risk) | 91 (43%) | ||
| 3 (medium–high risk) | 22 (10%) | ||
| 4 (high risk) | 26 (12%) | ||
| Presence of lipid-rich necrotic core | 112 (52%) | ||
| Presence of calcification | 103 (48%) | ||
| Presence of loose matrix | 21 (10%) | ||
| Presence of intraplaque hemorrhage | 18 (8.4%) | ||
| Presence of surface defect | 17 (7.9%) | ||
| Presence of mural thrombus | 1 (0.5%) | ||
| Wall volume (mm 3 ) | 788 ± 232 | 741 | (387–1965) |
| % Wall volume (%) | 42 ± 7 | 41 | (27–69) |
| Mean wall thickness (mm) | 1.1 ± 0.2 | 1.1 | (0.8–2.4) |
| Max wall thickness (mm) | 2.7 ± 1.4 | 2.5 | (0.9–8.0) |
| Subjects with lipid-rich necrotic core | |||
| Lipid-rich necrotic core volume (mm 3 ) | 76 ± 126 | 31 | (4–735) |
| % Wall volume (%) | 45 ± 7 | 44 | (29–69) |
| % Lipid-rich necrotic core volume (%) † | 14 ± 10 | 10 | (3–51) |
| % Calcification volume (%) † | 1.6 ± 2.6 | 0 | (0–12) |
| % Loose matrix volume (%) † | 0.4 ± 1.3 | 0 | (0–9.0) |
| % Fibrous tissue volume (%) † | 84 ± 11 | 88 | (43–97) |
∗ AHA lesion types in order of increasing severity: I to II, III, VII, IV to V, and VI.
† As a percentage of the wall volume from locations with LRNC present.
Logistic regression analysis of AHA type-VI lesions are listed in Table 4 . Type-VI lesions were significantly associated with older age, a longer duration of statin treatment, cerebrovascular disease, and increased PWV in the univariate analysis. After adjusting for age, lipoprotein(a) level and PWV were significantly associated with increased likelihood of type-VI lesions, whereas, metabolic syndrome showed a negative association. Furthermore multivariate adjustments beyond age were not made because of the small number of type-VI lesions (n = 23).
| Variable | AHA Type-VI Lesion | Model 1 (Univariate) | Model 2 (Age-Adjusted) | |||||
|---|---|---|---|---|---|---|---|---|
| Present (N = 23) | Absent (N = 191) | Odds Ratio ∗ | (95% CI) | p-Value | Adjusted Odds Ratio ∗ | (95% CI) | p-Value | |
| Age (years) | 71 ± 6 | 60 ± 8 | 2.6 | (1.8, 3.9) | <0.001 | — | — | |
| Male | 20 (87%) | 155 (81%) | 1.5 | (0.4, 5.5) | 0.50 | 3.5 | (0.9, 14.3) | 0.081 |
| Female | 3 (13%) | 36 (19%) | (Ref) | (Ref) | ||||
| White | 23 (100%) | 164 (86%) | ∞ | — | 0.085 † | — | — | |
| Non-white/other | 0 (0%) | 26 (14%) | (Ref) | |||||
| Hispanic or Latino | 0 (0%) | 10 (5%) | 0 | — | 0.61 † | — | — | |
| Not Hispanic or Latino | 23 (100%) | 180 (95%) | (Ref) | |||||
| Duration of statin therapy | 0.016 | 0.19 | ||||||
| None or <1 year | 1 (5%) | 57 (30%) | (Ref) | (Ref) | ||||
| 1–5 years | 6 (29%) | 70 (37%) | 4.9 | (0.6, 42) | 3.3 | (0.3, 31.5) | ||
| >5 years | 14 (67%) | 61 (32%) | 13 | (1.7, 103) | 6.1 | (0.7, 53.1) | ||
| Prior cerebrovascular disease | 9 (39%) | 25 (13%) | 4.3 | (1.7, 11) | 0.002 | 4.1 | (1.4, 12.4) | 0.011 |
| Stroke or transient ischemic attack | 5 (22%) | 16 (8%) | 3.0 | (1.0, 9.3) | 0.051 | 2.2 | (0.6, 7.8) | 0.21 |
| Carotid disease | 8 (35%) | 15 (8%) | 6.3 | (2.3, 17) | <0.001 | 7.2 | (2.1, 24.9) | 0.002 |
| Hypertension | 21 (91%) | 157 (82%) | 2.3 | (0.5, 10) | 0.28 | 2.2 | (0.4, 11.0) | 0.34 |
| Smoker | 18 (78%) | 133 (70%) | 1.6 | (0.6, 4.4) | 0.39 | 2.6 | (0.8, 8.3) | 0.12 |
| Diabetes mellitus | 5 (22%) | 48 (25%) | 0.8 | (0.3, 2.3) | 0.72 | 0.6 | (0.2, 1.9) | 0.36 |
| Metabolic syndrome (+) | 15 (68%) | 160 (84%) | 0.4 | (0.2, 1.1) | 0.078 | 0.2 | (0.1, 0.8) | 0.019 |
| Body mass index (kg/m 2 ) | 29 ± 4 | 30 ± 5 | 0.7 | (0.4, 1.1) | 0.13 | 0.8 | (0.5, 1.4) | 0.47 |
| Systolic blood pressure (mm Hg) | 134 ± 17 | 127 ± 17 | 1.4 | (0.9, 2.2) | 0.099 | 1.1 | (0.7, 1.9) | 0.70 |
| Diastolic blood pressure (mm Hg) | 74 ± 10 | 75 ± 10 | 0.9 | (0.6, 1.5) | 0.78 | 1.2 | (0.7, 2.1) | 0.42 |
| Total cholesterol (mg/dl) ‡ | 147 | 143 | 1.2 | (0.8, 1.8) | 0.42 | 1.0 | (0.6, 1.7) | 0.95 |
| Non-HDL cholesterol (mg/dl) ‡ | 107 | 107 | 1.2 | (0.8, 1.8) | 0.49 | 1.0 | (0.6, 1.7) | 0.94 |
| LDL cholesterol (mg/dl) ‡ | 74 | 73 | 1.5 | (0.9, 2.3) | 0.096 | 1.3 | (0.8, 2.3) | 0.31 |
| HDL cholesterol (mg/dl) | 36 ± 5 | 35 ± 6 | 1.2 | (0.8, 1.9) | 0.42 | 0.9 | (0.5, 1.4) | 0.55 |
| Triglycerides (mg/dl) ‡ | 133 | 162 | 0.7 | (0.4, 1.1) | 0.11 | 0.6 | (0.3, 1.1) | 0.079 |
| Lipoprotein(a) (mg/dl) ‡ | 116 | 32 | 1.5 | (0.9, 2.4) | 0.13 | 2.0 | (1.1, 3.6) | 0.019 |
| ApoB (mg/dl) | 92 ± 22 | 85 ± 23 | 1.3 | (0.9, 1.9) | 0.23 | 1.1 | (0.7, 1.8) | 0.58 |
| ApoA1 (mg/dl) | 123 ± 14 | 121 ± 17 | 1.1 | (0.7, 1.7) | 0.64 | 0.8 | (0.5, 1.4) | 0.50 |
| % Wall volume (%) ‡ | 52 | 40 | 5.4 | (2.8, 10) | <0.001 | 4.6 | (2.3, 9.1) | <0.001 |
Stay updated, free articles. Join our Telegram channel

Full access? Get Clinical Tree


