It is unknown whether left ventricular hypertrophy (LVH) diagnosis by electrocardiography improves risk stratification in patients with atrial fibrillation (AF). We investigated the prognostic impact of LVH diagnosis by electrocardiography in a large sample of anticoagulated patients with AF included in the Randomized Evaluation of Long-Term Anticoagulant Therapy (RE-LY) Study. We defined electrographic LVH (ECG-LVH) by strain pattern or Cornell voltage (R wave in aVL plus S wave in V 3 ) >2.0 mV (women) or >2.4 mV (men). LVH prevalence was 22.7%. During a median follow-up of 2.0 years, 303 patients developed a stroke, 778 died (497 from cardiovascular causes), and 140 developed a myocardial infarction. LVH was associated with a greater risk of stroke (1.99% vs 1.32% per year, hazard ratio [HR] 1.51, 95% confidence interval [CI] 1.18 to 1.93, p <0.001), cardiovascular death (4.52% vs 1.80% per year, HR 2.56, 95% CI 2.14 to 3.06, p <0.0001), all-cause death (6.03% vs 3.11% per year, HR 1.95, 95% CI 1.68 to 2.26, p <0.0001), and myocardial infarction (1.11% vs 0.55% per year, HR 2.07, 95% CI 1.47 to 2.92, p <0.0001). In multivariate analysis, the prognostic value of LVH was additive to CHA 2 DS 2 -VASc score and other covariates. The category-free net reclassification index and integrated discrimination improvement increased significantly after adding LVH to multivariate models. In conclusion, our study demonstrates for the first time that ECG-LVH, a simple and easily accessible prognostic indicator, improves risk stratification in anticoagulated patients with AF.
Left ventricular hypertrophy (LVH) diagnosed by standard 12-lead electrocardiogram is an independent predictor of all-cause and cardiovascular (CV) death, sudden cardiac death, coronary artery disease, and stroke. However, to the best of our knowledge, the adverse prognostic impact of LVH diagnosed by electrocardiography has never been tested in cohorts of patients with atrial fibrillation (AF). AF might limit the potential for electrocardiography to detect LVH because the use of P-wave abnormalities associated with left atrial dilatation is obviously restricted to patients in sinus rhythm. Because of the growing burden of AF, the importance of risk stratification in these patients, and the important role of hypertension and LVH as predictors of AF, we sought to clarify the prognostic value of LVH diagnosis by electrocardiography in these patients. Electrocardiography has the advantage of being less expensive and more widely available than echocardiography or magnetic resonance imaging and, hence, more suited for application to population-wide AF management. Thus, we reviewed for LVH the ECG tracings of patients enrolled in the Randomized Evaluation of Long-Term Anticoagulant Therapy (RE-LY) trial and tested the hypothesis that LVH at entry would identify patients at increased risk of stroke and other major events.
Methods
Details of the RE-LY trial have been published. It was a noninferiority trial of 2 doses of dabigatran compared with warfarin for prevention of stroke or systemic embolism in patients with AF and at least 1 additional risk factor for stroke. Overall, 18,113 patients were randomized to receive dabigatran 110 mg twice daily, dabigatran 150 mg twice daily, or warfarin (dose adjusted to a target international normalized ratio 2.0 to 3.0) and monitored for a median of 2 years. The primary outcome measure was a composite of stroke or systemic embolism and the primary safety end point was major hemorrhage. The protocol was approved by national regulatory authorities and ethics committees, and all patients provided written informed consent before study entry. The investigators of this post hoc analysis had full access to the data and designed the statistical analysis plan. For the purpose of the present study, we excluded patients with sinus rhythm at entry and used the selection criteria outlined in Figure 1 .
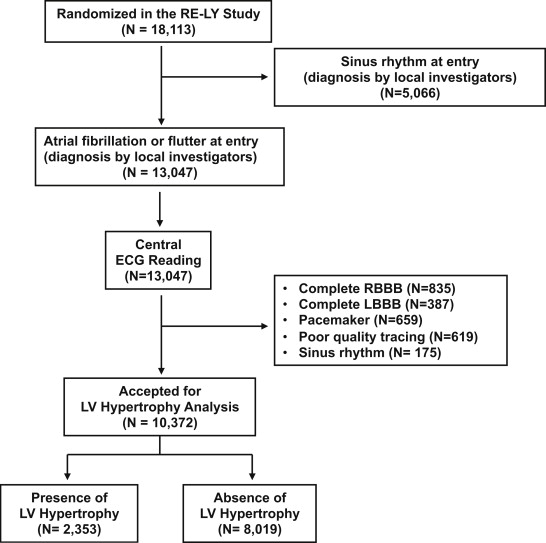
Participants underwent a 25-mm/s 12-lead electrocardiography at entry and then annually and at the final follow-up visit or permanent discontinuation of study drugs. Copies of ECG tracings carried out at scheduled visits were forwarded by participating centers to the coordinating center. ECG tracings of suboptimal quality (see Figure 1 ) were excluded. An expert reader, (GM) blinded to the patients’ features and randomized treatment, examined the baseline ECG tracings of all patients. We defined LVH diagnosis by electrocardiography in a binary (yes or no) fashion by one or both of the following: (1) sum of the R wave in lead aVL and depth of the S wave in lead V 3 >2.0 mV in women and >2.4 mV in men and (2) strain pattern in at least one of the following leads: I, II, aVL, or V 4 to V 6 . Strain pattern was considered present if there was ST-segment depression of at least 0.5 mm and inverted T wave in any of the aforementioned leads in the direction opposite the polarity of the QRS. This definition of ECG-LVH is simple and applicable in large populations. In a large validation study in hypertensive patients, it yielded 34% sensitivity and 91% specificity with echocardiographic LVH as reference and identified subjects at increased risk of major CV events with a greater population-attributable risk (16.1%) when compared with traditional ECG criteria of LVH.
Study outcomes were stroke, CV death, all-cause death, and myocardial infarction (MI) because all these outcomes have been associated with ECG-LVH in previous studies. Sources of outcomes data were clinical and hospital records and death certificates, when appropriate. Two independent experts who were unaware of randomized treatment adjudicated outcome events. Definition of events has been previously published. Deaths were adjudicated as being vascular or nonvascular, due to other specified causes such as cancer, or of unknown cause.
For data analysis, we used the SAS software, version 9.1.3 (SAS Institute, Cary, North Carolina). Continuous data are given as mean ± SD and categorical data as frequencies. We compared the characteristics of patients with and without LVH at entry by the Student t test for continuous variables and chi-square test for proportions. LVH was categorized as present or absent. For subjects who experienced multiple events, analysis was restricted to the first event. Survival curves were estimated by the Kaplan-Meier product-limit method and compared by the Mantel (log-rank) test. We report the risk of events as percentage per year, estimated by dividing the total number of patients with events by the total number of patient-years of follow-up. The effect of prognostic factors on survival was evaluated by using the Cox model. In multivariate analysis, we adjusted for the CHA 2 DS 2 -VASc score (score 0 to 2 as reference) and other covariates not included in the score. These were current smoking at entry (0 = no; 1 = yes), use of digoxin at entry (0 = no; 1 = yes), permanent AF at entry (0 = no; 1 = yes), and randomized treatment (dabigatran 110 mg twice daily = 0; warfarin = 1; dabigatran 150 mg twice daily = 0; warfarin = 1). We used the CHA 2 DS 2 -VASc score, in place of its 7 components taken separately, because of the growing use of this score in the clinical practice and also to preserve model parsimony and prevent overfitting. We also tested the interaction of LVH status with CHA 2 DS 2 -VASc score to test the hypothesis that LVH may be differently predictive at different levels of the previously established risk score.
The incremental predictive value of LVH was estimated by computing the difference in c-statistics between models. Confidence intervals (CIs) for the difference in c-statistics between models were calculated by bootstrap resampling. To quantify the clinical impact of adding LVH to the models predicting outcome events, we calculated the net reclassification improvement (NRI) and the integrated discrimination improvement (IDI). In our context, clinically relevant cut-off values for the risk of outcome events are absent. Thus, we used category-free reclassification measures (category-free NRI), which are independent of arbitrarily defined risk thresholds. The category-free NRI is computed as the net proportion of events in which the new model correctly predicts a higher probability plus the net proportion of nonevents in which the new model correctly predicts a lower probability. The IDI expresses the improvement in the probability of discrimination between models, and was calculated by the formula (P Y1 − P x1 ) − (P Y0 − P x0 ), where P Y1 and P Y0 are the mean estimated probabilities of events and nonevents with the model that includes LVH, and P x1 and P x0 are the mean estimated probabilities of events and nonevents with the model without LVH. Because IDI, as an absolute difference in probabilities, is highly sensitive to event rates, its absolute magnitude may be difficult to interpret quantitatively. Therefore, to facilitate interpretation, we calculated the relative IDI as [(P Y1 − P Y0 )/(P x1 − P x0 )] − 1. For instance, if the addition of LVH to a base model results in a relative IDI of 0.30, this indicates that the addition of LVH results in a 30% relative improvement in separation of events and nonevents. In these analyses, the occurrence or nonoccurrence of outcome events during the whole follow-up period (median duration: 2.0 years ) was used as a binary response. A probability value of <0.05 from 2-sided tests was considered to be statistically significant.
Results
The patient flow diagram is shown in Figure 1 . Patient characteristics at baseline are summarized in Table 1 . Prevalence of LVH was 22.7%. When compared with patients without LVH, those with LVH were more frequently women and of Asian ethnicity. Permanent AF was more frequent in the subgroup with LVH. Other relevant features of the population including systolic blood pressure at baseline and history of diabetes, coronary artery disease, MI, and heart failure were more frequent in the subgroup with LVH (all p <0.001). Prevalence of hypertension was slightly, but not significantly, greater in the subset with than without LVH. The CHA 2 DS 2 -VASc score was higher in the subset with than without LVH (p <0.001).
| Variable | All Patients (n = 10,372) | LVH | p Value | |
|---|---|---|---|---|
| Yes (n = 2,353) | No (n = 8,019) | |||
| Age (yrs) | 71.2 ± 9 | 71.1 ± 9 | 71.3 ± 9 | 0.26 |
| Men | 6,771 (65) | 1,413 (60) | 5,358 (67) | <0.001 |
| Body weight (kg) | 83.2 ± 20 | 79.2 ± 19 | 84.4 ± 20 | <0.001 |
| Body mass index (kg/m 2 ) | 28.9 ± 6 | 28.1 ± 6 | 29.1 ± 6 | <0.001 |
| Ethnicity | ||||
| Caucasian | 8,373 (81) | 1,833 (78) | 6,540 (82) | <0.001 |
| Asian | 1,899 (18) | 490 (21) | 1,409 (18) | <0.001 |
| Black | 100 (1) | 30 (1) | 70 (1) | 0.08 |
| Type of AF | ||||
| Paroxysmal | 1,640 (16) | 352 (15) | 1,288 (16) | 0.20 |
| Persistent | 3,926 (38) | 853 (36) | 3,073 (38) | 0.07 |
| Permanent | 4,804 (46) | 1,148 (49) | 3,656 (46) | 0.006 |
| Medical history | ||||
| Hypertension | 8,110 (78) | 1,874 (80) | 6,236 (78) | 0.052 |
| Diabetes mellitus | 2,405 (23) | 634 (27) | 1,771 (22) | <0.001 |
| Current cigarette smoking | 4,887 (47) | 1,035 (44) | 3,852 (48) | <0.001 |
| Coronary artery disease | 2,657 (26) | 688 (29) | 1,969 (25) | <0.001 |
| MI | 1,546 (15) | 459 (19) | 1,087 (14) | <0.001 |
| Heart failure | 3,436 (33) | 1,094 (46) | 2,342 (29) | <0.001 |
| Stroke | 1,377 (13) | 330 (14) | 1,047 (13) | 0.22 |
| Transient ischemic attack | 921 (9) | 198 (8) | 723 (9) | 0.37 |
| Non-CNS systemic embolism | 244 (2) | 53 (2) | 191 (2) | 0.72 |
| Systolic BP (mm Hg) | 130.3 ± 17 | 132.5 ± 18 | 129.7 ± 17 | <0.001 |
| Diastolic BP (mm Hg) | 77.9 ± 11 | 78.0 ± 11 | 77.8 ± 10 | 0.42 |
| Heart rate (beats/min) | 76.9 ± 15 | 76.7 ± 15 | 77.0 ± 15 | 0.35 |
| Waist circumference (cm) | 101.1 (21) | 98.4 (15) | 101.9 (23) | <0.001 |
| Medication use at entry | ||||
| Aspirin, clopidogrel, or dipyridamole | 9,175 (88) | 2,050 (87) | 7,125 (89) | 0.02 |
| Digoxin | 3,578 (34) | 1,184 (50) | 2,394 (30) | <0.001 |
| β Blockers | 6,455 (62) | 1,471 (62) | 4,984 (62) | 0.75 |
| ARBs or ACE inhibitors | 6,797 (65) | 1,692 (72) | 5,105 (64) | <0.001 |
| Statins | 4,332 (42) | 945 (40) | 3,387 (42) | 0.07 |
| Long-term VKA therapy | 7,269 (70) | 1,568 (67) | 5,701 (71) | <0.001 |
| CHA 2 DS 2 -VASc score | 3.42 ± 1.3 | 3.70 ± 1.4 | 3.36 ± 1.3 | <0.001 |
During a median follow-up period of 2.0 years, 303 patients (2.9%) developed a stroke, 497 (4.8%) died from CV causes, 778 (7.5%) died from any cause, and 140 (1.3%) developed MI. LVH at baseline was associated with an increased risk of stroke (1.99% vs 1.32% per year, unadjusted hazard ratio [HR] 1.51, 95% CI 1.18 to 1.93, p <0.001), CV death (4.52% vs 1.80% per year, unadjusted HR 2.56, 95% CI 2.14 to 3.06, p <0.0001), all-cause death (6.03% vs 3.11% per year, unadjusted HR 1.95, 95% CI 1.68 to 2.26, p <0.0001), and MI (1.11% vs 0.55% per year, unadjusted HR 2.07, 95% CI 1.47 to 2.92, p <0.0001). The Kaplan-Meier curves for stroke, CV death, all-cause death, and MI in the groups with and without LVH are reported in Figure 2 (all p <0.001).
As shown in Figure 3 , the excess risk of stroke (p = 0.29) and MI (p = 0.82) associated with LVH did not show any significant interaction with the CHA 2 DS 2 -VASc score, thus, suggesting that the predictive impact of LVH is comparable across levels of CHA 2 DS 2 -VASc score. In contrast, the excess risk of CV death (p = 0.0042) and all-cause death (p = 0.0188) associated with LVH was greater in patients with CHA 2 DS 2 -VASc score 0 to 2 than in those with a score ≥3.
The independent predictive value of LVH beyond the CHA 2 DS 2 -VASc score on stroke, CV death, all-cause death, and MI is listed in Table 2 . After adjustment for the CHA 2 DS 2 -VASc score, and other variables not included in the score, LVH was associated with an increased risk for stroke (HR 1.34, 95% CI 1.04 to 1.73), CV death (HR 2.22, 95% CI 1.85 to 2.67), all-cause death (HR 1.75, 95% CI 1.51 to 2.04), and MI (HR 1.92, 95% CI 1.35 to 2.73). As listed in Table 3 , adding LVH to the multivariate model (model B) yielded generally modest increases in the c-statistics that were significant for CV death and all-cause death, but formally not for MI and stroke. Conversely, as shown in Figure 4 , both the category-free NRI (stroke, p = 0.0094; CV death, p <0.0001; all-cause death, p <0.0001; and MI, p = 0.0011) and the IDI (stroke, p = 0.0202; CV death, p <0.0001; all-cause death, p <0.0001; and MI, p = 0.0010) were significant for all outcomes.


