Polymer coatings on drug-eluting stents (DES) serve as a vehicle for delivery of antirestenotic drugs. Whether they influence outcomes for contemporary DES is unknown. The evolution of polymer coatings for zotarolimus-eluting stents (ZES) provides a natural experiment that facilitates such analysis. The Resolute ZES (R-ZES) uses the same antirestenotic drug as the Endeavor ZES (E-ZES) but has a more biocompatible polymer with enhanced drug release kinetics. However, there are limited data on the real-world comparative efficacy of R-ZES and the preceding E-ZES. Thus, we analyzed 17,643 patients who received either E-ZES or R-ZES from 2008 to 2014 from the British Columbia Cardiac Registry. A total of 9,869 patients (56%) received E-ZES and 7,774 patients (44%) received R-ZES. Compared with E-ZES, R-ZES was associated with lower 2-year mortality (4.1% vs 6.4%, p <0.001) and 2-year target vessel revascularization (TVR; 6.8% vs 10.7%, p <0.001). R-ZES use was an independent predictor of lower mortality rate and TVR. This was confirmed in propensity-matched analyses for 2-year mortality (hazard ratio [HR] 0.59, 95% CI 0.49 to 0.71, p <0.001) and 2-year TVR (HR 0.86, 95% CI 0.75 to 0.98, p = 0.032). Instrumental variable analyses demonstrated R-ZES to be associated with lower 2-year mortality (Δ = −2.2%, 95% CI −4.3% to −0.2%, p = 0.032) and 2-year TVR (Δ = −3.3% to 95% CI −6.1% to −0.7%, p = 0.015). Acknowledging the limitations of observational analyses, this study has shown that R-ZES was associated with lower long-term TVR and mortality. These data are reassuring for the newer R-ZES and demonstrate how polymer coatings may influence the clinical performance of DES with wider implications for future DES development and design.
Polymer coatings on drug-eluting stents (DES) serve as a vehicle for delivery and elution of antirestenotic drugs, but whether they may influence outcomes is unknown. The zotarolimus-eluting stents (ZES) represent one of the newer second generation DES, and the evolution in its polymer coatings provides a natural experiment that may facilitate such analysis. The Endeavor ZES (E-ZES) was the first of these, with a phosphorycholine-based polymer with rapid release drug kinetics. However, concerns regarding late lumen loss with E-ZES prompted the development of the newer Resolute ZES (R-ZES). This was initially based on the same platform and eluted the same dose of zotarolimus (Endeavor Resolute) but differed in its polymer coating that provided an extended drug release period. This was subsequently replaced by a stent with a different platform but retaining the new polymer coating (Resolute Integrity). Thus, comparison of outcomes after E-ZES and R-ZES implantation allows evaluation of the potential prognostic benefit of polymer coatings for contemporary DES. However, data directly comparing R-ZES with the preceding E-ZES are limited. We compared outcomes after E-ZES and R-ZES implantation in patients who underwent percutaneous coronary intervention (PCI) in the British Columbia Cardiac Registry (BCCR).
Methods
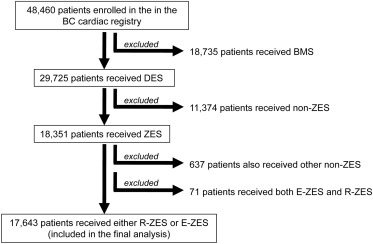
This was a retrospective observational cohort study to compare long-term outcomes after E-ZES and R-ZES implantation for an all-comers patient population undergoing PCI. We used merged data sets from the BCCR where data are collected prospectively from 5 tertiary cardiac centers and entered into a central database. Mortality events are obtained by linkage of provincial Vital Statistics Database, which records the date of death for all patients. We examined consecutive patients treated with PCI from 2008 to 2014 at all 5 cardiac centers in British Columbia, Canada. Anonymous data sets with linked mortality and target vessel revascularization (TVR) data were used for analysis. Of the total of 48,461 patients enrolled in BCCR, a total of 18,351 patients received ZES. Patients receiving other DES or both E-ZES and R-ZES were excluded. This yielded 17, 643 patients who received either E-ZES or R-ZES and were included in the final analysis ( Figure 1 ). We analyzed all-cause mortality and TVR at 30 days, 1 year, and 2 years. Ethical approval for analyses of outcomes after PCI was obtained from the University of British Columbia Ethics Board (H12-01628).
Patients were divided into “E-ZES” and “R-ZES” groups. Noncategorical variables in our data set had a skewed distribution and thus were summarized using median (lower and upper quartiles) and compared using the Mann–Whitney U test. Categorical variables were expressed as percentages and compared using the Z-test. We used Cox proportional hazard models to determine independent predictors of outcomes. To address measured confounders, we performed propensity-matched analyses and inverse probability treatment weighted analyses. To address unmeasured confounding, we used instrumental variable (IV) analyses. Full details of statistical method are provided in the Supplementary Methods . All statistical analyses were performed using MedCalc, version 12.5, (MedCalc Software, Ostend, Belgium) and (R Foundation for Statistical Computing, Vienna, Austria). Statistical significance was established at p <0.05 (2-tailed) for all tests.
Results
We analyzed 17,643 consecutive patients who underwent PCI at all 5 tertiary cardiac centers in British Columbia who received either E-ZES or R-ZES. Of this patient population, 9,869 patients (56%) received E-ZES and 7,774 patients (44%) received R-ZES. As R-ZES replaced E-ZES, the use of R-ZES increased over the study period ( Figure 2 ). An increase in ZES use is seen from December 2010, reflecting when the British Columbia provincial stent contract came into effect. The patient characteristics are summarized in Table 1 . Compared with E-ZES, R-ZES was associated with similar mortality at 30 days (1.9% vs 1.5%, p = 0.078) but lower mortality at 1 year (3.8% vs 4.5%, p = 0.041) and 2 years (4.2% vs 6.4%, p <0.001). Similarly, R-ZES was associated with similar TVR rates at 30 days (2.1% vs 2.2%, p = 0.491) but lower at TVR at 1 year (5.7% vs 8.1%, p <0.001) and 2 years (6.9% vs 10.6%, p <0.001).
| Total (n = 17,643) | E-ZES (n = 9869) | R-ZES (n = 7774) | p value | |
|---|---|---|---|---|
| Clinical factors | ||||
| Age (years) | 65(57,74) | 66(58,74) | 65(57,74) | 0.649 |
| Female | 24.7% | 24.7% | 24.7% | 0.959 |
| Peripheral vascular disease | 8.5% | 8.4% | 8.8% | 0.458 |
| Renal disease | 4.7% | 4.4% | 5.1% | 0.029 |
| Previous cerebrovascular accident | 8.2% | 7.3% | 9.6% | <0.001 |
| Previous myocardial infarction | 18.7% | 22.3% | 14.2% | <0.001 |
| Previous revascularization | 20.4% | 26.9% | 12.1% | <0.001 |
| History of heart failure | 7.7% | 6.2% | 11.3% | <0.001 |
| Diabetes | 29.1% | 26.7% | 32.7% | <0.001 |
| Hypertension | 67.0% | 64.3% | 70.8% | <0.001 |
| Hypercholesterolemia | 63.2% | 60.2% | 67.3% | <0.001 |
| Smoking | 20.3% | 19.8% | 21.1% | 0.034 |
| Severe left ventricular function (ejection fraction ≤30%) | 7.0% | 4.6% | 9.9% | <0.001 |
| Cardiogenic shock | 1.6% | 2.4% | 0.6% | <0.001 |
| Pulmonary disease | 13.5% | 12.6% | 14.9% | <0.001 |
| Gastrointestinal disease | 12.2% | 11.6% | 13.7% | 0.001 |
| Malignancy | 9.8% | 8.3% | 13.3% | <0.001 |
| Presentation | ||||
| Stable coronary artery disease | 28.2% | 29.3% | 26.7% | <0.001 |
| Non-ST-elevation acute coronary syndrome | 46.7% | 47.0% | 46.3% | 0.369 |
| ST-elevation acute coronary syndrome | 25.2% | 23.7% | 27.0% | <0.001 |
| Diseased coronary vessels | ||||
| Left main-stem | 6.0% | 5.2% | 7.2% | <0.001 |
| Left anterior descending artery | 76.5% | 75.5% | 77.8% | 0.001 |
| Proximal left anterior descending artery | 36.5% | 32.0% | 42.5% | <0.001 |
| Non-proximal left anterior descending artery | 64.9% | 64.9% | 64.8% | 0.871 |
| Left circumflex artery | 56.7% | 56.8% | 56.6% | 0.841 |
| Right coronary artery | 62.3% | 61.3% | 63.6% | 0.002 |
| Multivessel disease | 66.4% | 65.5% | 67.7% | 0.003 |
| Procedural characteristics | ||||
| Radial access | 46.7% | 50.6% | 41.7% | <0.001 |
| Glycoprotein 2 b/3a inhibitor use | 4.6% | 6.6% | 2.1% | <0.001 |
| Thrombectomy | 7.8% | 7.3% | 8.3% | 0.012 |
| Intra-aortic balloon-pump use | 1.6% | 1.4% | 1.8% | 0.065 |
| Total stent length≥30 mm | 47.9% | 48.5% | 47.1% | 0.068 |
| Stent diameter ≥3 mm | 66.0% | 65.1% | 67.2% | 0.004 |
| Target vessel | ||||
| Left main-stem | 3.8% | 3.1% | 4.8% | <0.001 |
| Left anterior descending artery | 51.1% | 50.4% | 52.1% | 0.033 |
| Proximal left anterior descending artery | 27.6% | 24.1% | 32.2% | <0.001 |
| Non-proximal left anterior descending artery | 38.7% | 39.5% | 37.6% | 0.011 |
| Left circumflex artery | 31.9% | 32.5% | 31.0% | 0.036 |
| Right coronary artery | 38.0% | 36.7% | 39.7% | <0.001 |
| Graft | 3.9% | 3.8% | 4.1% | 0.217 |
| Multivessel intervention | 25.3% | 23.6% | 27.6% | <0.001 |
Multivariate-adjusted analyses demonstrated that R-ZES use was not associated with mortality at 30 days (hazard ratio [HR] 1.05, 95% CI 0.79 to 1.38, p = 0.758) but was an independent predictor for reduced mortality at 1 year (HR 0.78, 95% CI 0.66 to 0.93, p = 0.006) and 2 years (HR 0.72, 95% CI 0.62 to 0.84, p <0.001). Similarly, R-ZES use was not associated with TVR at 30 days (HR 0.86, 95% CI 0.69 to 1.08, p = 0.190) but was an independent predictor for reduced TVR at 1 year (HR 0.81, 95% CI 0.71 to 0.92, p = 0.001) and 2 years (HR 0.89, 95% CI 0.71 to 0.99, p = 0.042). Given that the R-ZES and E-ZES cohorts represent different periods, it is possible that evolving improvements in pharmacotherapy and techniques may affect outcomes. Although enrollment year was not identified as a significant variable in the stepwise variable selection process, when this was included as forced-in variable into the multivariate models, the results were similar. Recent data suggest that repeat revascularization may predict long-term mortality. Thus, we examined the association between TVR and long-term mortality in our data set, by including receipt of TVR in first 30 days and 1 year as a binary forced-in variable into multivariate models for mortality. This demonstrated a strong association with TVR and 2-year mortality (30-day TVR: HR 1.85, 95% CI 1.32 to 2.60, p <0.001 and 1-year TVR: HR 1.33, 95% CI 1.07 to 1.65, p = 0.009). The Kaplan–Meier curves for the total study cohort are shown in Figure 3 and are compared using the log-rank test.
Propensity score matching yielded a total of 8,344 matched patients (4,172 patients in each group, c-statistic = 0.72). Table 2 illustrates that the covariates were well balanced and the absolute standardized differences in means ([Sdiff]) were all <10%. In these analyses, R-ZES use was associated with similar mortality at 30 days (1.5% vs 1.5%, p = 0.928) but lower mortality at 1 year (3.7% vs 5.0%, p = 0.004) and 2 years (4.2% vs 7.2%, p <0.001). Similarly, R-ZES use was associated with similar TVR at 30 days (2.2% vs 2.3%, p = 0.769) but lower TVR at 1 year (6.8% vs 8.7%, p = 0.001) and 2 years (8.4% vs 11.1%, p <0.001). R-ZES use was not associated with mortality at 30 days (HR 0.98, 95% CI 0.69 to 1.39, p = 0.897) but was an independent predictor for lower mortality rate at 1 year (HR 0.75, 95% CI 0.61 to 0.92, p = 0.007) and 2 years (HR 0.70, 95% CI 0.58 to 0.84, p <0.001). Similarly, R-ZES use was not associated with TVR at 30 days (HR 0.95, 95% CI 0.72 to 1.27, p = 0.749) but was an independent predictor for lower TVR at 1 year (HR 0.81, 95% CI 0.69 to 0.94, p = 0.006) and 2 years (HR 0.85, 95% CI 0.74 to 0.97, p = 0.020). The Kaplan–Meier curves for the matched cohort are shown in Figure 3 and are compared using the stratified log-rank test. In inverse probability treatment weighted analyses, R-ZES use was not associated with mortality at 30 days (HR 1.01, 95% CI 0.76 to 1.34, p = 0.954) but was an independent predictor for lower mortality at 1 year (HR 0.76, 95% CI 0.64 to 0.91, p = 0.002) and 2 years (HR 0.70, 95% CI 0.69 to 0.83, p <0.001). Similarly, R-ZES use was an independent predictor for lower TVR at 30 days (HR 0.78, 95% CI 0.62 to 0.99, p = 0.041), 1 year (HR 0.74, 95% CI 0.65 to 0.85, p <0.001), and 2 years (HR 0.84, 95% CI 0.74 to 0.95, p = 0.006).
| Total (n = 8344) | E-ZES (n = 4172) | R-ZES (n = 4172) | [Sdiff] | |
|---|---|---|---|---|
| Clinical factors | ||||
| Age > 60 years | 71.0% | 70.4% | 71.6% | 2.7% |
| Female | 24.8% | 24.7% | 25.0% | 0.8% |
| Peripheral vascular disease | 8.3% | 7.9% | 8.7% | 2.6% |
| Renal disease | 5.4% | 5.2% | 5.6% | 1.7% |
| Previous cerebrovascular accident | 9.3% | 9.1% | 9.5% | 1.2% |
| Previous myocardial infarction | 21.8% | 21.5% | 22.2% | 1.9% |
| Previous revascularization | 19.2% | 19.2% | 19.1% | 0.1% |
| History of heart failure | 8.3% | 7.9% | 8.7% | 3.0% |
| Diabetes | 30.7% | 30.0% | 31.4% | 3.1% |
| Hypertension | 68.8% | 67.7% | 69.9% | 4.8% |
| Hypercholesterolemia | 64.1% | 63.3% | 64.9% | 3.3% |
| Smoking | 18.4% | 18.7% | 18.1% | 1.5% |
| Severe left ventricular function (ejection fraction ≤30%) | 7.1% | 6.7% | 7.5% | 3.1% |
| Cardiogenic shock | 1.0% | 0.9% | 1.0% | 1.2% |
| Pulmonary disease | 13.4% | 13.1% | 13.6% | 1.4% |
| Gastrointestinal disease | 11.6% | 11.5% | 11.7% | 0.5% |
| Malignancy | 9.6% | 9.2% | 10.0% | 2.8% |
| Presentation | ||||
| Stable coronary artery disease | 31.4% | 31.1% | 31.7% | 1.2% |
| Non-ST-elevation acute coronary syndrome | 45.8% | 46.1% | 45.5% | 1.3% |
| ST-elevation acute coronary syndrome | 22.8% | 22.7% | 22.8% | 0.2% |
| Diseased coronary vessels | ||||
| Left main-stem | 7.5% | 7.0% | 8.1% | 4.3% |
| Left anterior descending artery | 77.9% | 76.9% | 78.9% | 4.9% |
| Proximal left anterior descending artery | 39.6% | 39.3% | 39.9% | 1.4% |
| Non-proximal left anterior descending artery | 65.5% | 64.6% | 66.4% | 3.7% |
| Left circumflex artery | 58.6% | 57.9% | 59.2% | 2.6% |
| Right coronary artery | 65.1% | 64.8% | 65.4% | 1.3% |
| Multivessel disease | 69.0% | 68.0% | 70.0% | 4.2% |
| Procedural characteristics | ||||
| Radial access | 41.3% | 42.6% | 39.9% | 5.6% |
| Glycoprotein 2 b/3a inhibitor use | 4.2% | 4.4% | 4.0% | 2.1% |
| Thrombectomy | 7.4% | 7.1% | 7.7% | 2.6% |
| Intra-aortic balloon-pump use | 1.5% | 1.5% | 1.6% | 0.6% |
| Total stent length≥30 mm | 48.5% | 48.0% | 49.0% | 2.0% |
| Stent diameter ≥3 mm | 67.8% | 67.3% | 68.4% | 2.3% |
| Target vessel | ||||
| Left main-stem | 5.0% | 4.7% | 5.3% | 2.7% |
| Left anterior descending artery | 51.5% | 51.0% | 52.1% | 2.2% |
| Proximal left anterior descending artery | 30.1% | 29.0% | 31.3% | 5.1% |
| Non-proximal left anterior descending artery | 38.0% | 37.7% | 38.3% | 1.2% |
| Left circumflex artery | 31.6% | 31.4% | 31.9% | 0.9% |
| Right coronary artery | 39.3% | 39.5% | 39.1% | 0.9% |
| Graft | 5.6% | 5.3% | 5.8% | 2.3% |
| Multivessel intervention | 28.4% | 27.4% | 29.5% | 4.6% |
To account for unmeasured confounding, IV analyses were performed using enrollment year (2008 to 2012 vs 2013 to 2014) as an IV. The use of R-ZES was 11.7% versus 91.9% (2008 to 2010 vs 2011 to 2014, p <0.001), and the strong association between R-ZES use and the IV was validated using logistic and linear regression models. Multivariate models demonstrated that the enrollment year groups were not associated with outcomes. The F-test statistic for enrollment year was 117.6 for 2-year mortality and 38.1 for 2-year TVR outcomes (value <10 indicates a weak IV). Table 3 demonstrates the strength of the enrollment year as an IV. Adopting the framework proposed by Brookhart and Schneeweiss, when examining the difference in R-ZES use in various patient subsets stratified according to the IV, the strength of the IV was similar to that in the overall cohort across most observed variables, with the exception of 8 variables (denoted by * in Table 3 ). This provided reasonable evidence to infer that the balance of unmeasured variables is likely to be improved by IV stratification. R-ZES use was found to be associated with reduced 2-year mortality, with an IV-adjusted mortality difference of −2.2% (95% CI −4.3% to −0.2%, p = 0.032). Similarly, R-ZES use was found to be associated with reduced 2-year TVR, with an IV-adjusted TVR difference of −3.3% (95% CI −6.1% to −0.7%, p = 0.015).
| Enrollment year | % difference in R-ZES use (95% CI) | |||
|---|---|---|---|---|
| 2008-2012 (n = 10,530) | 2013-2014 (n = 7113) | |||
| Clinical factors | ||||
| Age > 60 years | 6.9% | 36.8% | 29.9% | (28.9, 30.9) |
| Female | 7.5% | 36.5% | 28.9% | (27.4, 30.6) |
| Peripheral vascular disease | 6.0% | 33.5% | 27.5% | (24.6, 30.3) |
| Renal disease | 9.2% | 36.7% | 27.5% | (23.5, 31.4) |
| Previous cerebrovascular accident | 6.8% | 38.5% | 31.7% | (28.7, 34.7) |
| Previous myocardial infarction | 7.6% | 25.9% | 18.4% | (16.5, 20.1)* |
| Previous revascularization | 6.1% | 20.1% | 14.1% | (12.5, 15.6)* |
| History of heart failure | 7.3% | 37.2% | 29.9% | (28.3, 31.5) |
| Diabetes | 6.9% | 37.4% | 30.5% | (29.0, 32.0) |
| Hypertension | 7.0% | 37.2% | 30.2% | (29.1, 31.3) |
| Hypercholesterolemia | 6.9% | 38.5% | 31.6% | (29.8, 33.4) |
| Smoking | 6.4% | 37.3% | 30.9% | (27.5, 34.2) |
| Severe left ventricular function (ejection fraction ≤30%) | 7.3% | 56.9% | 49.6% | (46.0, 53.1)* |
| Cardiogenic shock | 9.4% | 6.5% | 2.9% | (-1.9, 7.7)* |
| Pulmonary disease | 6.9% | 35.9% | 29.0% | (26.7, 31.3) |
| Gastrointestinal disease | 7.0% | 26.2% | 19.2% | (16.7, 21.7)* |
| Malignancy | 6.3% | 34.7% | 28.4% | (25.5, 31.3) |
| Presentation | ||||
| Stable coronary artery disease | 6.7% | 35.1% | 28.4% | (26.9, 29.9) |
| Non-ST-elevation acute coronary syndrome | 7.2% | 36.5% | 29.3% | (28.1, 30.5) |
| ST-elevation acute coronary syndrome | 7.0% | 40.3% | 33.3% | (30.8, 35.7) |
| Diseased coronary vessels | ||||
| Multivessel disease | 6.8% | 36.5% | 29.6% | (28.7, 30.7) |
| Procedural characteristics | ||||
| Radial access | 5.7% | 33.5% | 27.8% | (26.7, 28.9) |
| Glycoprotein 2 b/3a inhibitor use | 6.5% | 40.8% | 34.3% | 29.9, 38.6) |
| Thrombectomy | 12.3% | 8.2% | 4.0% | (1.1, 7.1)* |
| Intra-aortic balloon-pump use | 7.8% | 41.7% | 33.9% | (27.0, 40.5) |
| Total stent length≥30 mm | 6.6% | 35.2% | 28.7% | (27.4, 29.8) |
| Stent diameter ≥3 mm | 7.3% | 36.1% | 28.8% | (27.8, 29.8) |
| Target vessel | ||||
| Left main-stem | 6.3% | 47.1% | 40.8% | (36.3, 45.1)* |
| Left anterior descending artery | 7.2% | 36.1% | 28.8% | (27.8, 30.1) |
| Proximal left anterior descending artery | 7.6% | 42.1% | 34.5% | (32.9, 36.1)* |
| Non-proximal left anterior descending artery | 6.8% | 34.4% | 27.6% | (26.3, 28.9) |
| Left circumflex artery | 6.6% | 34.7% | 28.1% | (26.7, 29.3) |
| Right coronary artery | 6.7% | 37.7% | 31.0% | (29.7, 32.3) |
| Graft | 7.4% | 37.4% | 29.9% | (25.7, 34.2) |
| Multivessel intervention | 6.0% | 40.4% | 34.4% | (30.1, 37.9) |
| R-ZES use as a % of the full cohort (n = 17,643): | ||||
| 7.0% | 37.1% | 30.0% | (29.2,30.9) | |
Stay updated, free articles. Join our Telegram channel

Full access? Get Clinical Tree


