Most subordinate techniques accompanying bifurcation stenting have not been supported by relevant clinical trials. The aim of this study was to investigate the impact of technical specifications involved in bifurcation stenting on angiographic outcomes. We analyzed patients enrolled in a cohort consisting of the patients in 2 randomized studies: one comparing routine final kissing inflation (FKI) versus leave-alone strategy after the 1-stent technique for bifurcations without side branch (SB) stenosis (<50%) and the other comparing crush versus the 1-stent technique for lesions with SB stenosis (≥50%). The effects of subordinate techniques and devices on 8-month angiographic restenosis were studied using multivariate models. Of 514 patients whose 8-month angiograms were available, 58 (11.3%) were found to have restenosis involving, in total, 35 main branches (MBs) and 27 SBs. Using multivariate models, we identified FKI as the only independent predictor of MB restenosis in the technically modifiable variables. The effect of FKI was significantly different across subgroups defined by bifurcation lesion type and stenting technique (test for homogeneity, p = 0.003): FKI was unrelated to MB restenosis in the 1-stent for diseased SB (odds ratio [OR] 0.41, 95% confidence interval [CI] 0.10 to 1.72; p = 0.22) and the 2-stent groups (OR 0.14, 95% CI 0.01 to 1.36; p = 0.09) but predictive of MB restenosis in the 1-stent for normal SB group (OR 4.90, 95% CI 1.58 to 15.16; p = 0.006).
Coronary bifurcation lesions are associated with a high rate of adverse events. Although much effort has been made to solve this problem, most clinical trials have failed to demonstrate superiority of any bifurcation stenting technique over others. One of the major hindrances to performing a study of any aspect of coronary bifurcation lesions is the difficulty of standardizing the bifurcation stenting technique because it varies across operators in terms of the device used and subordinate techniques. And yet, the impact of these technical specifications on outcomes has not been directly addressed. To investigate this subject, we analyzed the pooled patients enrolled in a recent cohort comprising 2 randomized studies namely, the Choice of Optimal Strategy for Bifurcation Lesions with Normal Side Branch (CROSS) and Optimal Stenting Strategy for True Bifurcation Lesions (PERFECT). The former aimed to evaluate the role of routine final kissing inflation (FKI) compared with provisional use of FKI for bifurcation lesions with normal side branches (SBs); the purpose of the latter was to compare the crush technique and provisional T-stenting for those with diseased SB. Our purpose was to identify technical predictors of 8-month angiographic restenosis by analyzing the pooled subjects of these 2 studies.
Methods
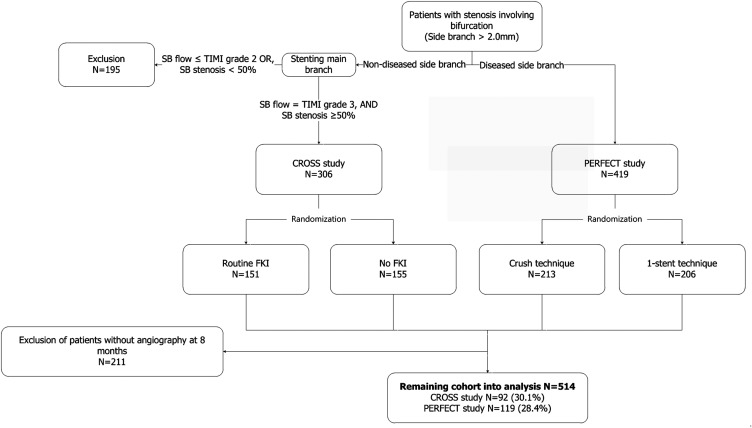
The study design and methods of the CROSS and PERFECT trials have been described in detail previously. Briefly, these trials were open-label and randomized studies, carried out in 14 centers in Korea. Patients with non–left main coronary bifurcation lesions were screened. Of all the patients screened, those whose main branch (MB) was ≥2.5 mm in diameter and SB ≥2.0 mm were considered for inclusion. Patients were assigned to one or the other of the 2 studies according to the severity of the stenosis involving the SB: those with SB stenosis <50% to the CROSS study and those with SB stenosis ≥50% to the PERFECT study. After stenting the MB of the CROSS study candidates, those who showed SB stenosis ≥50% and Thrombolysis in Myocardial Infarction (TIMI) grade 3 flow in it were randomly assigned to routine FKI or provisional FKI. Similarly, the PERFECT study candidates, after wiring both the MB and SB, were randomized to the crush and provisional T-stenting groups. After excluding subjects without 8-month angiograms, we analyzed 214 and 300 patients in the CROSS and PERFECT studies, respectively ( Figure 1 ).
All procedures for percutaneous coronary intervention were performed in compliance with standard guidelines. It was recommended that both branches should be evaluated by intravascular ultrasound for all patients. FKI was mandatory after stenting both branches, regardless of the technique used.
All the patients were asked to revisit for follow-up angiography 8 months after the index procedure or earlier if experiencing symptoms of angina. For all stented branches, a quantitative angiographic analysis was performed over the entire segment (in-segment), which consisted of the stented segment (in-stent) and 5-mm nonstented segments proximal and distal to it, in the angiographic core laboratory of the CardioVascular Research Foundation, Seoul, Korea, using dedicated software for bifurcation lesions (CAAS-5.4; Pie-Medical, Maastricht, the Netherlands). The reference diameter, minimal lumen diameter (MLD), percentage diameter of stenosis (DS), and late luminal loss were measured in this manner.
Restenosis was defined as a DS ≥50% on 8-month angiography. The locations of restenosis were classified into 9 categories: 3 edges, shafts, and ostia of the proximal and distal MB and the SB. Each edge was defined as a 5-mm nonstented area proximal or distal to the margins of implanted stents. The ostia consisted of 5-mm segments of the proximal and distal MB and SB bordering the POC, the zone of confluence of the MB and SB. If restenosis occurred in the POC, it was categorized as being in the closest ostium.
To analyze the relative positions of the balloons and MB stents and between the 2 balloons during FKI, we used the arbitrary classification system depicted in Figure 2 . With the proximal end of the MB stent as a reference point, the tip position of the more proximal of the 2 balloons was divided into 4 regions: >2 mm outside the stent, ≤2 mm outside it, ≤2 mm inside it, and >2 mm inside it, and this system was used to analyze the position of the proximal end of the overlapping segment ( Figure 2 ). With regard to the positional relation between the 2 balloons, we defined 3 positional types: the proximal tips of the 2 balloons in line, the MB balloon more proximal than the other, and the SB balloon more proximal than the other. Decisions on the locations of restenosis and balloon positions during FKI were made by 2 experienced cardiologists. For estimating the diameters of the 2 overlapping balloons in the proximal MB during FKI, we used a formula that was proposed by Morino et al and shown to be useful for predicting stent expansion after FKI, which is as follows:
R 2 = D mb 2 + D sb 2

We analyzed the subjects pooled from the CROSS and PERFECT studies on an as-treated basis. Data are presented as mean ± standard deviation or number (proportion). Continuous variables were analyzed using t tests or the Wilcoxon rank sum tests, and categorical variables by the chi-square statistics or Fisher’s exact test, as appropriate. To identify technical predictors of restenosis, univariate and multivariate stratified logistic regression models were used, with the whole population stratified by the study in which they were enrolled. For odds ratio, only summary values for the whole population are presented unless tests for homogeneity showed significant differences between the individual odds ratios (ORs) for the 2 study groups. To estimate adjusted ORs, we developed a multivariate model by backward elimination of those variables that were marginally significant (p <0.10) in the univariate analysis. All statistical analyses were performed with IBM SPSS version 21 (IBM, Chicago, Illinois) and SAS 9.3 (SAS Institute, Cary, North Carolina). A 2-tailed p value of <0.05 was considered statistically significant.
Results
Of the 725 patients enrolled in the CROSS and PERFECT studies, those who did not undergo 8-month angiography were excluded, leaving 514 patients in our cohort. The baseline demographic and clinical characteristics of the patients enrolled in the 2 studies have been described previously. In brief, the mean age of the subjects was 61 ± 8.6 years, and male patients made up 72%. The number of patients with medically treated diabetes was 138 (27%). Most of the bifurcation lesions involved the left anterior descending coronary artery (n = 471, 92%), the left circumflex and right coronary arteries making up 7% (n = 35) and 2% (n = 8), respectively. The single-stent technique was performed on 321 patients (63%), of whom 178 (56%) were completed with FKI and 143 (45%) without FKI; the double-stent technique was performed on 193 patients (38%), of whom 188 (97%) were completed with FKI and 5 (3%) without FKI.
The ORs of angiographic and technical variables for MB and SB restenosis are listed in Tables 1 and 2 , respectively. Of the variables which were technically modifiable, FKI in the CROSS group (OR 5.21, 95% confidence interval [CI] 1.66 to 16.34; p = 0.005) and a smaller postprocedural MLD of the SB in the PERFECT group (OR 0.20, 95% CI 0.05 to 0.72; p = 0.014) were independent predictors of MB and SB restenosis, respectively. Interestingly, these 2 variables had different effects according to the study group: FKI was predictive of a greater risk of MB restenosis in the CROSS group and of a lower risk in the PERFECT group; postprocedural MLD of the SB was unrelated to SB restenosis in the CROSS group, but greater values were predictive of a lower risk in the PERFECT group.
| Variable | CROSS Study | PERFECT Study | Overall | ||
|---|---|---|---|---|---|
| Main branch restenosis | + (N=20) | 0 (N=194) | + (N=15) | 0 (N=285) | OR (95% CI) |
| True bifurcation | 5 (26%) | 48 (25%) | 12 (80%) | 249 (87%) | 0.84 (0.34-2.04) |
| Multi-vessel involvement | 8 (40%) | 84 (43%) | 7 (47%) | 141 (50%) | 0.88 (0.44-1.77) |
| Main branch | |||||
| Proximal reference diameter (mm) | 3.4 ± 0.6 | 3.5 ± 0.6 | 3.4 ± 0.4 | 3.7 ± 0.5 | 0.53 (0.26-1.07) |
| Distal reference diameter (mm) | 2.3 ± 0.4 | 2.5 ± 0.4 | 2.5 ± 0.4 | 2.6 ± 0.4 | 0.32 (0.12-0.84) |
| Lesion length (mm) | 28.2 ± 13.0 | 27.0 ± 12.9 | 27.5 ± 13.1 | 28.4 ± 14.0 | 1.00 (0.98-1.03) |
| Diameter stenosis (%) | 64.9 ± 12.7 | 60.7 ± 12.1 | 68.5 ± 9.1 | 64.8 ± 12.3 | 1.03 (1.00-1.06) |
| Non-compliant balloon | 9 (45%) | 114 (59%) | 6 (40%) | 158 (55%) | 0.56 (0.28-1.12) |
| Intravascular ultrasound | 19 (95%) | 183 (94%) | 14 (93%) | 273 (96%) | 0.87 (0.20-3.86) |
| Predilation | 20 (100%) | 187 (96%) | 15 (100%) | 279 (98%) | Infinite |
| Maximal pressure applied (atm) | 18.6 ± 4.9 | 19.0 ± 4.5 | 15.0 ± 4.1 | 17.3 ± 4.5 | 0.94 (0.87-1.02) |
| Stent implantation | |||||
| Number of stents | 1.3 ± 0.5 | 1.3 ± 0.5 | 1.4 ± 0.5 | 1.4 ± 0.5 | 1.07 (0.54-2.11) |
| Mean stent diameter (mm) | 3.3 ± 0.3 | 3.4 ± 1.9 | 3.3 ± 0.3 | 3.3 ± 0.2 | 0.92 (0.27-3.12) |
| Total length of stents (mm) | 34.1 ± 11.1 | 32.8 ± 13.5 | 35.9 ± 16.2 | 37.6 ± 15.1 | 1.00 (0.98-1.02) |
| Stent length, measured (mm) | 30.6 ± 10.7 | 30.7 ± 11.7 | 32.9 ± 15.5 | 34.4 ± 13.4 | 1.00 (0.97-1.02) |
| Stent length in proximal MB (mm) | 15.9 ± 10.2 | 16.9 ± 8.3 | 16.6 ± 7.7 | 17.2 ± 7.6 | 0.99 (0.94-1.03) |
| Stent length in distal MB (mm) | 14.8 ± 7.6 | 13.8 ± 9.0 | 16.2 ± 13.3 | 17.2 ± 11.7 | 1.00 (0.97-1.04) |
| Postprocedural MLD (mm) | 2.2 ± 0.6 | 2.4 ± 0.5 | 2.2 ± 0.4 | 2.5 ± 0.6 | 0.42 (0.21-0.86) |
| Side branch | |||||
| Distal reference diameter (mm) | 1.9 ± 0.4 | 2.1 ± 0.4 | 2.1 ± 0.4 | 2.2 ± 0.3 | 0.17 (0.06-0.53) |
| Lesion length (mm) | 2.6 ± 4.2 | 1.9 ± 3.9 | 9.2 ± 10.5 | 9.3 ± 7.6 | 1.01 (0.95-1.07) |
| Diameter stenosis (%) | 30.6 ± 12.1 | 29.0 ± 14.8 | 57.7 ± 12.9 | 54.0 ± 15.9 | 1.01 (0.99-1.03) |
| Non-compliant balloon | 1 (5%) | 13 (7%) | 1 (7%) | 105 (37%) | 0.22 (0.05-0.95) |
| Intravascular ultrasound | 7 (35%) | 83 (43%) | 12 (80%) | 247 (87%) | 0.68 (0.31-1.50) |
| Predilation | 1 (5%) | 9 (5%) | 13 (87%) | 230 (81%) | 1.37 (0.43-4.38) |
| Maximal pressure applied (atm) | 9.7 ± 2.7 | 10.3 ± 3.5 | 13.0 ± 5.0 | 15.2 ± 5.5 | 0.93 (0.84-1.03) |
| Stent implantation | 0 | 2 (1%) | 7 (47%) | 184 (65%) | 0.47 (0.17-1.31) |
| Postprocedural MLD (mm) | 1.5 ± 0.3 | 1.6 ± 0.4 | 1.5 ± 0.5 | 1.8 ± 0.4 | 0.38 (0.16-0.87) |
| Final kissing balloon ∗ | 16 (80%) | 87 (45%) | 4.89 (1.58-15.12) | ||
| 10 (67%) | 253 (89%) | 0.25 (0.08-0.79) | |||
Stay updated, free articles. Join our Telegram channel

Full access? Get Clinical Tree


