The prevalence of troponin elevations in patients with cardiac arrest (CA) using newer generation troponin assays when the ninety-ninth percentile is used has not been well described. We studied patients admitted with CA without ST elevation myocardial infarction (MI). Treatment included a multidisciplinary protocol that included routine use of hypothermia for appropriate patients. Serial assessment of cardiac biomarkers, including troponin I was obtained over the initial 24 to 36 hours. Patients were classified into 1 of 5 groups on the basis of multiples of the ninety-ninth percentile (upper reference limit [URL]), using the peak troponin I value: <1×, 1 to 3×, 3 to 5×, 5 to 10×, and >10×. Serial changes between the initial and second troponin I values were also assessed. A total of 165 patients with CA (mean age 58 ± 16, 67% men) were included. Troponin I was detectable in all but 2 patients (99%); all others had peak troponin I values that were greater than or equal to the URL. Most patients had peak troponin I values >10× URL, including patients with ventricular fibrillation or ventricular tachycardia (85%), asystole (50%), and pulseless electrical activity (59%). Serial changes in troponin I were present in almost all patients: ≥20% change in 162 (98%), ≥30% change in 159 (96%), and an absolute increase of ≥0.02 ng/ml in 85% of patients. In conclusion, almost all patients with CA who survived to admission had detectable troponin I, most of whom met biomarker guideline criteria for MI. Given the high mortality of these patients, these data have important implications for MI mortality reporting at CA treatment centers.
There are limited data on the use of troponin for diagnosing acute myocardial infarction (MI) in patients with cardiac arrest (CA). Previous studies used earlier generation troponin assays that had limited sensitivity. In contrast, most assays currently in use have increased sensitivity and specificity, especially at low values. We report on the frequency of troponin I elevations using a contemporary assay in patients admitted after return of spontaneous circulation (ROSC) after CA.
Methods
Patients with CA and ROSC admitted from January 2007 through December 2010 were included. Patients with ST elevation consistent with acute MI were excluded (n = 35) as most would have substantial troponin elevations. The standard protocol at our hospital for treatment of patients with CA with ROSC includes therapeutic hypothermia and protocol-driven care for the initial 72 hours. Patients who have ventricular fibrillation or pulseless ventricular tachycardia arrest (VF/pVT) witnessed asystole or pulseless electrical activity (PEA) who are comatose on arrival are evaluated for hypothermia. Relative exclusion criteria include prolonged arrest time and hemodynamic instability despite multiple vasopressors. Subsequent clinical care followed a standard protocol. Coronary angiography was performed at the discretion of the attending cardiologist. Significant coronary artery disease was defined as ≥70% stenosis in a major vessel or its branches or ≥50% left main stenosis.
All patients had serial assessment of creatine kinase (CK), CK-MB, and troponin I (Siemens Ultra Troponin I Assay; Siemens, New Jersey) at presentation, 3, 6, and 8 hours later. Patients who had elevated markers had sampling repeated every 6 hours until CK or CK-MB peaked. The 10% coefficient of variation for troponin I was 0.03 ng/ml, and the ninety-ninth percentile (upper reference limit) was 0.04 ng/ml (as determined by the manufacturer). Values >0.04 ng/ml were considered abnormal.
Patients were classified into 1 of 5 groups based on multiples of the ninety-ninth percentile using the peak troponin I value: <1× (<0.04 ng/ml), 1 to 3× (0.04 to 0.12 ng/ml), 3 to 5× (0.13 to 0.20 ng/ml), 5 to 10× (0.21 to 0.4 ng/ml), and >10× (>0.40 ng/ml). To assess the frequency of serial changes between the initial and peak troponin I values, 2 different criteria were used: >20% change and >30% change. In addition, various absolute changes, including 0.02 ng/ml and 0.04 ng/ml (ninety-ninth percentile), were examined.
The first electrocardiogram recorded after ROSC was used for interpretation. Electrocardiograms were classified as consistent with ischemia if there was ≥1 mm ST depression not associated with left ventricular hypertrophy or a symmetrical T-wave inversion of ≥3 mm. An electrocardiography performed 1 to 2 weeks after admission or the last one before discharge or death (whichever was later) was analyzed for development of new Q waves (compared with the initial electrocardiogram) based on recommended criteria. For patients who had Q waves consistent with MI, a comparison was made with the one obtained before admission (if available) or at the time of admission to determine if the Q waves were new.
Results are presented as mean ± SD, median (twenty-fifth, seventy-fifth percentile), and number (percentage). Chi-square and Wilcoxon rank-sum tests were used to compare categorical and continuous variables, respectively. A p value <0.05 was considered significant.
Results
Of the 165 consecutive patients included, the presenting arrest arrhythmia was VF/pVT in 85 (51%), asystole in 34 (21%), and PEA in 46 (28%). Clinical characteristics for all patients based on presenting rhythm are listed in Table 1 . In-hospital and 30-day mortality was lowest in patients with VT/pVF (39%) and exceeded 50% for asystole and PEA ( Table 1 ).
| Variable | All Patients (n = 165) | VF/pVT (n = 85) | Asystole (n = 34) | PEA (n = 46) |
|---|---|---|---|---|
| Age (yrs) | 56 ± 16 (57) | 57 ± 14 (56) | 56 ± 17 (57) | 56 ± 17 (61) |
| Age ≥65 yrs | 52 (32) | 23 (27) | 12 (35) | 17 (37) |
| Men | 111 (67) | 62 (72) | 20 (59) | 29 (63) |
| Hypertension | 99 (60) | 49 (57) | 20 (58) | 30 (65) |
| Diabetes mellitus | 51 (31) | 20 (23) | 16 (47) | 15 (33) |
| Ejection fraction (%) | 41 ± 17 (40) | 39 ± 17 (37) | 46 ± 17 (55) | 43 ± 17 (44) |
| Ejection fraction <35% | 65 (39) | 40 (47) | 10 (29) | 15 (33) |
| Previous MI | 9 (5.4) | 8 (9.3) | 0 (0) | 1 (2.2) |
| Previous angioplasty or bypass surgery | 11 (6.6) | 7 (8.1) | 2 (5.9) | 2 (4.3) |
| Creatinine clearance (ml/min) | 64 ± 39 (59) | 70 ± 35 (63) | 57 ± 34 (50) | 57 ± 48 (49) |
| Creatinine clearance <60 ml/min | 85 (51) | 38 (44) | 19 (56) | 28 (61) |
| Peak troponin I (ng/ml) | 3.1 ± 1.2 (3.0) | 12 ± 17 (3.0) | 4.2 ± 9.1 (3.0) | 6.2 ± 12 (3.0) |
| Peak CK (U/L) | 2,340 ± 6,390 (730) | 1,490 ± 2,050 (950) | 4,510 ± 10,600 (780) | 2,310 ± 7,330 (470) |
| Peak CK-MB (ng/ml) | 80 ± 127 (34) | 87 ± 115 (38) | 62 ± 95 (27) | 82 ± 165 (33) |
| 30-Day mortality | 93 (56) | 33 (38) | 26 (77) | 34 (74) |
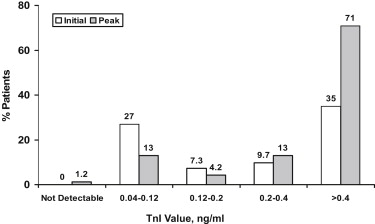
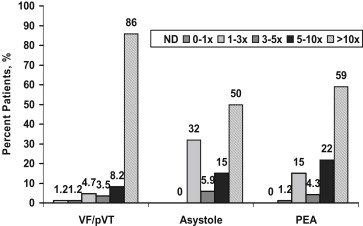
Cardiac troponin I was detectable in all but 2 patients (99%); all others had peak troponin I values that equaled or exceeded the ninety-ninth percentile (0.04 ng/ml). One patient who did not have detectable troponin I presented with VF/pVT; the other presented with PEA. Troponin I elevations were frequent at the time of admission ( Figure 1 ). Most patients ( Figure 1 ) and the subgroups based on the presenting arrhythmia ( Figure 2 ) had peak troponin I values >10× normal. Patients presenting with VF/pVT were significantly more likely to have a peak troponin I value of >10× normal, whereas a peak troponin I value of <10× normal was significantly more common in patients presenting with asystole (24% vs 15%, p = 0.01) and PEA (42% vs 23%, p = 0.03). Patients who had a presenting rhythm of VT/pVF were also more likely to have higher peak marker values compared with patients with asystole (p <0.01) or PEA (p = 0.02; Table 1 ).
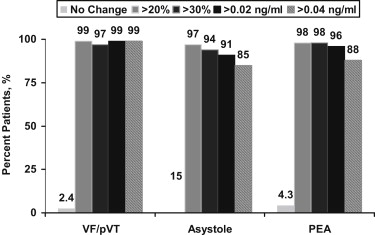
Serial changes ( Figure 3 ) were common in all subgroups based on the presenting arrhythmia. A 20% change in troponin I was present in 162 patients (98%), and a 30% change was present in 159 patients (96%), which was similar among groups ( Figure 3 ). Absolute changes in troponin I were also frequent and exceeded 85% for all definitions for serial changes.
Ischemic electrocardiographic changes were present on the first electrocardiogram obtained in the emergency department in 30 (18%) of the 165 patients. This included ST depression in 20, T-wave inversion in 12, and both in 2. Peak troponin I was 11.5 ± 15.6 ng/ml (median 3.3) versus 8.3 ± 14.4 ng/ml (median 1.2, p = NS) in those with versus those without ischemic electrocardiograms, respectively.
A total of 18 patients (11%) had Q waves at the time of admission. Q waves that developed after admission were present in only 3 patients, of whom 2 had ischemic electrocardiographic changes also. Only 31 patients (19%) had either ischemic changes or new Q waves.
A total of 46 patients (28%) underwent coronary angiography during the course of their hospital stay (39 with VF/pVT, 4 with asystole, and 3 with PEA). Significant coronary disease was found in 27 (59%). All had detectable troponin I, and all but 2 (5%; both without significant disease) had a peak troponin I value of >0.12 ng/ml (3× upper limit of normal [ULN]). Compared with those without significant disease, patients who had significant coronary disease had significantly higher peak marker values for both troponin I (16 vs 1.9 ng/ml, p <0.001) and CK-MB (160 vs 23 ng/ml, p = 0.004) but not peak CK (1,510 vs 810 U/L, p = 0.09). Consistent with the higher peak marker values, patients with significant coronary disease were more likely to have a troponin I value of >5× ULN (100% vs 78%, p = 0.03) and >10× ULN (100% vs 58%, p <0.002), although most patients without significant coronary disease also had values >10× ULN.
Results
Of the 165 consecutive patients included, the presenting arrest arrhythmia was VF/pVT in 85 (51%), asystole in 34 (21%), and PEA in 46 (28%). Clinical characteristics for all patients based on presenting rhythm are listed in Table 1 . In-hospital and 30-day mortality was lowest in patients with VT/pVF (39%) and exceeded 50% for asystole and PEA ( Table 1 ).


