The measurement of dynamic blood pressure has been of interest to physiologists and physicians since 1732, when Reverend Stephen Hales measured the blood pressure of a horse by using a vertical glass tube connected to a brass rod inserted in the femoral artery of the horse (see Chapter 1).1 Methodology has advanced impressively since then, but with increased technical capability has come greater complexity of instrumentation, such that few physicians today have a firm understanding of the instruments on which they rely.
THE INPUT SIGNAL: WHAT IS A PRESSURE WAVE?
Force is transmitted through a fluid medium as a pressure wave, and an important objective of the cardiac catheterization procedure is to assess accurately the forces and therefore the pressure waves generated by various cardiac chambers. A ventricular pressure wave may be considered a complex periodic fluctuation in force per unit area, with one cycle consisting of the time interval from the onset of one systole to the onset of the subsequent systole. The number of times the cycle occurs in 1 second is termed the fundamental frequency of cardiac pressure generation. Thus, a fundamental frequency of two corresponds to a heart rate of 120 beats per minute (bpm). Definitions of terms relevant to the theory and practice of pressure measurement are listed in Table 10.1.
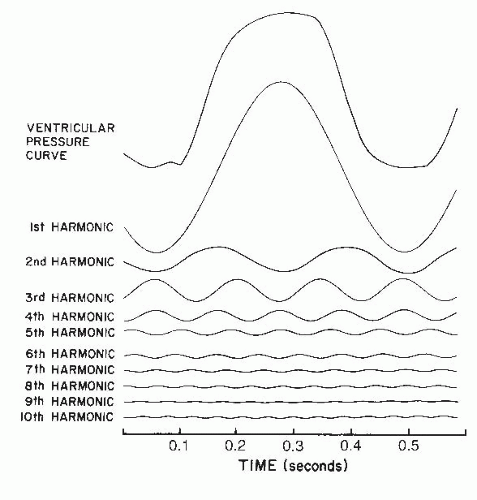
As a complex periodic waveform, the pressure wave may be subjected to a type of analysis developed by the French physicist Fourier, whereby any complex wave form may be considered the mathematical summation of a series of simple sine waves of differing amplitude and frequency (Figure 10.1). Even the most complex waveform can be represented by its own Fourier series, in which the sine wave frequencies are usually expressed as harmonics, or multiples of the fundamental frequency. For example, at a heart rate of 120 bpm, the fundamental frequency is 2 cycles per second (Hz) and the first five harmonics are sine waves whose frequencies are 2, 4, 6, 8, and 10 Hz. The practical consequence of this analysis is that, to record pressure accurately, a system must respond with equal amplitude for a given input throughout the range of frequencies contained within the pressure wave. If components in a particular frequency range are either suppressed or exaggerated by the transducer system, the recorded signal will be a grossly distorted version of the original physiologic waveform. For example, the dicrotic notch of the aortic pressure wave contains frequencies above 10 Hz. If the pressure measurement system were unable to respond to frequencies greater than 10 Hz, the notch would be slurred or absent.
Table 10.1 Definitions of Terms Relevant to the Theory and Practice of Pressure Measurement
Term
Definition
Pressure wave
Complex periodic fluctuation in force per unit area Units: dynes/cm2: 1 dyne/cm2 = 1 microbar = 10−1 N/M2 = 7.5 × 10⁻⁴ mmHg mmHg: 1 mmHg = 1 Torr = 1/760 atmospheric pressure
Fundamental frequency
Number of times the pressure wave cycles in 1 s
Harmonic
Multiple of the fundamental frequency
Fourier analysis
Resolution of any complex periodic wave into a series of single sine waves of differing frequency and amplitude
Sensitivity of pressure measurement system
Ratio of the amplitude of the recorded signal to the amplitude of the input signal
Linearity
Relationship between input and output of the first order
Frequency response of pressure measurement system
Ratio of output amplitude to input amplitude over a range of frequencies of the input pressure wave
Natural frequency
Frequency at which the pressure measurement system oscillates or responds when shock- excited; also, the frequency of an input pressure wave at which the ratio of output/input amplitude of an undamaged system is maximal. Units: cycles/sec, Hz
Damping
Dissipation of the energy of oscillation of a pressure measurement system owing to friction. Units: damping coefficient, D (see text)
Optimal damping
Damping that progressively blunts the increase in out-put/input ratio that occurs with increasing frequency of pressure wave input. Optimal damping can maintain frequency response flat (output/input ratio = 1) to 88% of the natural frequency of the system
Strain gauge
Variable-resistance transducer in which the strain (ΔL/L) on a series of wires is determined by the pressure on the transducer’s diaphragm. Over a wide range, electrical resistance (R) of the wire is directly proportional to ΔL/L
Wheatstone bridge
Arrangement of electrical connections in a strain gauge such that pressure-induced changes in resistance result in proportional changes in voltage across the bridge
Balancing a transducer
Interpolating a variable resistance across the out-put of a Wheatstone bridge/strain gauge transducer so that atmospheric pressure at the zero level (e.g., midchest) induces an arbitrary voltage output on the monitor/recording device (i.e., a voltage that positions the transducer output on the oscilloscopic pressure baseline)
Figure 10.1 Resolution of a normal ventricular pressure curve (top) into its first 10 harmonics by Fourier analysis. If components in a particular frequency range (e.g., the third harmonic, which in this case is 7 Hz) were either suppressed or exaggerated by the transducer system, the recorded signal would be a grossly distorted version of the original physiologic signal. (Adapted from Wiggers CJ. The Pressure Pulses in the Cardiovascular System. London: Longmans, Green; 1928:1.)
PRESSURE MEASURING DEVICES
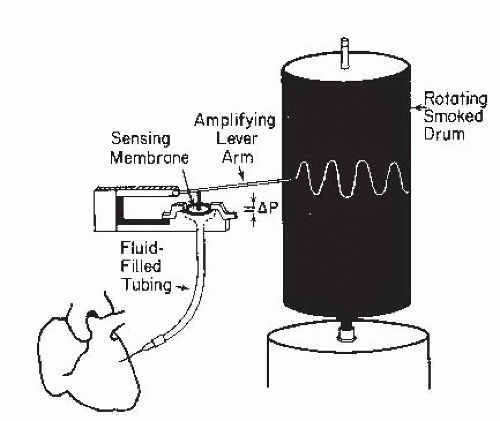
The manometer used by Starling, Wiggers,2 and others was a modification of that devised by Hürthle3 in 1898 and illustrated in Figure 10.2. A rubber tambour was coupled with a writing lever that recorded change in pressure on a rotating smoked drum. The system had a high inertia and a low elasticity, giving it a narrow range of usefulness. However, consideration of the mechanics of this primitive system helps give a tangible meaning to key concepts applicable to modern pressure measurement devices.
Sensitivity
The sensitivity of such a measurement system is the ability to detect small changes in the input signal. It may be defined as the ratio of the amplitude of the recorded signal to the amplitude of the input signal. With the Hürthle manometer illustrated in Figure 10.2, the more rigid the sensing membrane, the lower the sensitivity; conversely, the more flaccid the membrane, the higher the sensitivity. This general principle applies to manometers currently in use, where the instrument must be sensitive enough to respond to a small input signal with an adequate output.
Frequency Response
A second crucial property of any pressure measurement system is its frequency response. The frequency response of a pressure measurement system may be defined as the ratio of output amplitude to input amplitude over a range of frequencies of the input pressure wave. To measure pressure accurately, the frequency response (amplitude ratio) must be constant over a broad range of frequency variation. Otherwise, the amplitude of major frequency components of the pressure waveform may be attenuated while minor components are amplified, so that the recorded waveform becomes a distorted caricature of the physiologic event. Referring again to the Hürthle manometer in Figure 10.2, the range of good frequency response is improved by stiffening the membrane, and it is narrowed by making the membrane more flaccid, because the flaccid membrane cannot respond well to higher frequencies. Thus, frequency response and sensitivity are related reciprocally, and one can be obtained only by sacrificing the other.
Figure 10.2 Schematic illustration of the Hürthle manometer. A rubber tambour serves as the sensing membrane and is coupled with an amplifying lever arm that records changes in pressure (ΔP) on a rotating smoked drum. Pressure is transmitted from the heart (lower left corner) to the sensing membrane by fluid-filled tubing.
Natural Frequency and Damping
A third important concept is the natural frequency of a sensing membrane and how it determines the degree of damping required for optimal recording. If the sensing membrane were to be shock-excited (like a gong) in the absence of friction, it would oscillate for an indefinite period in simple harmonic motion. The frequency of this motion would be the natural frequency of the system. Any means of dissipating the energy of this oscillation, such as friction, is called damping. The dynamic response characteristics of such a system are determined largely by the natural frequency and the degree of damping that the system possesses.4
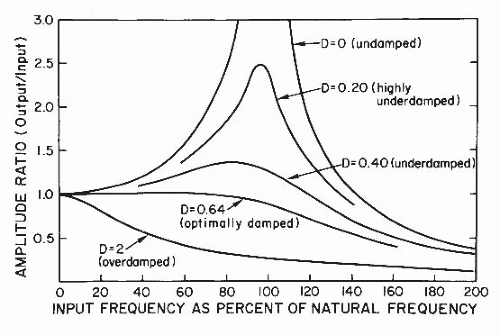
The significance of the natural frequency and the importance of proper damping are illustrated in Figure 10.3. The amplitude of an output signal tends to be augmented as the frequency of the input signal approaches the natural frequency of the sensing membrane. The physical counterpart of this augmentation is that the sensing membrane of the pressure transducer vibrates with increasing energy and violence. The same mechanism underlies the fracture of a crystal glass when an opera singer vocalizes the appropriate input frequency. Damping dissipates the energy of the oscillating sensing membrane, and optimal damping dissipates the energy gradually, thereby maintaining the frequency response curve nearly flat (constant output/input ratio) as it approaches the region of the pressure measurement system’s natural frequency.
Figure 10.3 Frequency-response curves of a pressure measurement system, illustrating the importance of optimal damping. The amplitude of an input signal tends to be augmented as the frequency of that signal approaches the natural frequency of the sensing membrane. Optimal damping dissipates the energy of the oscillating sensing membrane gradually and thereby maintains a nearly flat natural frequency curve (constant output/input ratio) as it approaches the region of the pressure measurement system’s natural frequency (see text). D, damping coefficient.
As an analogy to further help the reader understand the significance of damping, consider the simple case of a weight suspended from a spring. If the weight is displaced and then released, the stretched spring recoils so that the weight moves past its original position and then oscillates up and down. In the absence of frictional forces (damping), the oscillation would continue indefinitely at a frequency determined by the stiffness of the spring and an amplitude determined by the mass of the weight. In practice there is always some damping, and this has two effects: the amplitude of the oscillations gradually diminishes, and the frequency of oscillation is reduced. This second important consequence of damping—reduction of the natural frequency of a system—is not widely appreciated. If we continue with our analogy, imagine that the spring and its weight are suspended in a jar of syrup or honey; the spring will clearly vibrate with lesser amplitude of vibration and lesser frequency than before. The effect of the viscous medium is to further damp the oscillations. If the medium’s viscosity is high enough, it prevents any overshoot or oscillation: the weight returns to its original position regardless of its initial displacement. Further damping at this point simply slows the return of the weight to its equilibrium position, thereby depressing the frequency response characteristics of the system. Therefore, damping helps to prevent overshoot artifacts resulting from resonance of the system, but at the cost of diminished frequency response.
Linearity
Linearity is an additional critical component of recording systems, and it exists when the relationship between the input signal and the output signal is of the first order. Linearity allows the use of a single calibration factor for different amplitudes of the input signal.
WHAT FREQUENCY RESPONSE IS DESIRABLE?
Wiggers2 suggested that the shortest significant vibrations contained within physiologic pressure waves have one-tenth the period of the entire pressure curve—that is, the essential physiologic information is contained within the first 10 harmonics of the pressure wave’s Fourier series. At a heart rate of 120 bpm, the fundamental frequency is 2 Hz and the tenth harmonic is 20 Hz. Therefore, a pressure measurement system with a frequency response range that is flat to 20 Hz should be adequate in such a circumstance, and support for this hypothesis has come from experimental work comparing high frequency-response systems with conventional catheter systems.5
The useful frequency-response range of commonly used pressure measurement systems is usually <20 Hz unless special care is taken. Wood and colleagues6 and Gleason and Braunwald7 found that frequency response was flat to <10 Hz with small-bore (6F) catheters attached to standard strain gauge manometers.
To ensure a high frequency-response range, the pressure measurement system must be set up in such a way that it has the highest possible natural frequency as well as optimal damping. The natural frequency is directly proportional to the lumen radius of the catheter system. It is inversely proportional to the length of the catheter and associated tubing and to the square root of the catheter and tubing compliance and the density of fluid filling the system. The highest natural frequency is obtained by using a short, wide-bore, stiff catheter connected to its transducer without intervening tubing or stopcocks and filled with a low-density liquid from which small air bubbles, which increase compliance, have been excluded (e.g., boiled saline solution). Such a system is impractical for routine use, but deviation from it occurs only at a significant sacrifice.
If such a system is constructed, it will be found to be grossly underdamped (Figure 10.3). Accordingly, it is important to introduce damping into the system to keep the frequency response flat as the frequency of the input signal approaches the natural frequency of the pressure measurement system. With optimal damping, the frequency response can be maintained flat (±5%) to within 88% of the natural frequency, according to Fry,4 although it is unusual to achieve >50% in most laboratories. Damping may be introduced by interposing a damping needle between the catheter and manometer6 and gradually shortening it until optimal damping is obtained, by filling the manometer or tubing with a viscous medium such as Renografin (a radiographic contrast agent), or by any of several other methods.
EVALUATION OF FREQUENCY RESPONSE CHARACTERISTICS
Ideally, the frequency-response characteristics of a pressure measurement system should be evaluated using a sine wave pressure generator to construct curves similar to those seen in Figure 10.3. By altering the characteristics of the system discussed in the previous section, a reasonable compromise between frequency response, damping, and practicality can be achieved for each laboratory. An example of the use of this device in estimating frequency response of a pressure measurement system is provided in Figure 10.4.
Another method, which does not require the use of such a pressure waveform generator, is described here. This technique may be used for measuring the dynamic response characteristics of a pressure measurement system.
The catheter to be studied is connected by means of a three-way stopcock with or without intervening tubing to one arm of a strain gauge transducer (Figure 10.5). The transducer used should be of the low-volume-displacement type (small chamber capacity) to enhance frequency response. The tip of the catheter is snugly projected through a hole in a no. 6 rubber stopper, which is tightly inserted into the cutoff barrel of a 60 mL plastic syringe. The syringe plunger is removed, and the barrel is fixed in a vertical position, pointing downward, so that the catheter enters from below. The manometer and catheter are filled with saline solution, care being taken to avoid even small air bubbles, and the catheter is flushed until the catheter tip and holes are submerged in approximately 30 mL of saline solution. The plunger is slowly inserted into the syringe, producing an upward deflection of the pressure trace on the oscilloscope of the recording apparatus. When the trace comes to rest at the top of the oscilloscope, the recorder is turned on at rapid paper speed and the plunger is suddenly withdrawn. This method, modified from Hansen,8 produces shock-excitation vibrations of the type seen in Figure 10.6. The mathematical foundation for analysis of such a shock excitation has been described by Wiggers2 and Fry4 and may be summarized as follows:
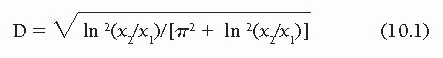
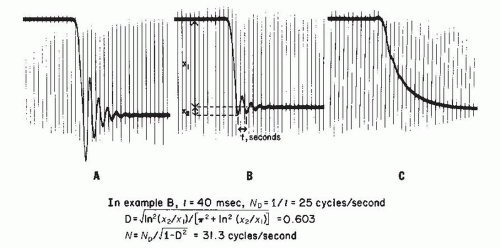
The frequency of the after-vibrations produced by shock excitation is the damped natural frequency of the system. This is obtained by measuring the time, t, between two successive vibrations and obtaining the damped natural frequency, ND as 1/t. In the example in Figure 10.6, ND = 1/0.04 = 25 Hz. Next, the damping coefficient, D, is calculated as a function of the ratio by which successive single vibrations decrease. In Figure 10.6, this may be calculated from the ratio of x2 to x1, the percent overshoot
where ln(x2/x1) is the natural logarithm of the percent over-shoot. In our example, x2/x1 = 0.093, ln(x2/x1) = −2.379, and D = 0.603. From the damping coefficient D and the damped natural frequency ND, we may determine the undamped natural frequency N as
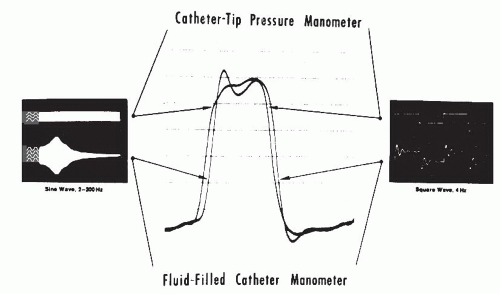
Figure 10.4 Left ventricular pressure (center) measured with a fluid-filled standard catheter and micromanometer (catheter-tip pressure manometer) in a patient undergoing cardiac catheterization. Left and right. In vitro frequency response for micromanometer (upper) and fluid-filled (lower) systems. The left panel recordings were obtained by continuously increasing the input frequency of a sine wave pressure waveform from 2 to 200 Hz. The fluid-filled system resonated (natural frequency) at 37 Hz but was flat (±5%) only to 12 Hz. Therefore its useful range is only to approximately 12 Hz. The right panel shows the response of each system to a square wave pressure input signal. (From Nichols WW, Pepine CJ, Millar HD, et al. Percutaneous left ventricular catheterization with an ultraminiature catheter-tip pressure transducer. Cardiovasc Res 1978;12:566, with permission.)
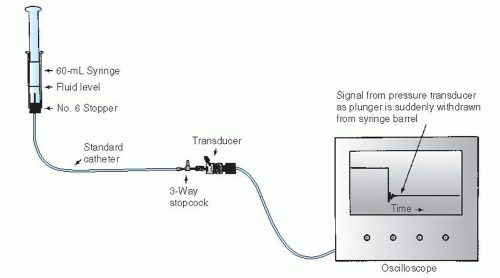
Figure 10.5 Practical evaluation of dynamic response characteristics of a catheter-transducer system. The catheter hub is connected by means of a three-way stopcock to one arm of a low-volume-displacement pressure transducer. The tip of the catheter is snugly projected through a hole in a no. 6 rubber stopper, which is tightly inserted into the cutoff barrel of a 60 mL plastic syringe. The manometer and catheter are filled with saline solution, care being taken to avoid even small air bubbles, and the catheter is flushed until the catheter tip and holes are submerged in approximately 30 mL of saline solution. Next, the plunger is slowly inserted into the syringe, producing an upward deflection of the pressure trace on the oscilloscope of the recording apparatus. When the pressure trace comes to rest at the top of the oscilloscope screen, the recorder is turned on and the plunger is suddenly withdrawn from the syringe barrel. Dynamic response characteristics are then calculated as shown in Figure 10.6.
Figure 10.6 Records of dynamic frequency-response characteristics obtained from the system illustrated in Figure 10.5. A, B, and C. Progressive increases in damping produced by introducing increasing amounts of a viscous radiographic contrast agent (Renografin-76) into the catheter-transducer system. The catheter was 80 cm long, and its diameter was 8F. A. Underdamped. B. Almost optimally damped. C. Overdamped. The percent overshoot (x2/x1) is used in the calculation of the damping coefficient, D. The undamped natural frequency, N, is calculated from D and the damped natural frequency, ND. Time lines are 20 milliseconds. Using the curves shown in Figure 10.3 for various values of D, the frequency response of the system in B can probably be considered flat (±5%) to 0.88 N, or 27.5 Hz.
A simple practical goal is to try to regulate the damping of an actual pressure measurement system so that its damping coefficient is as close to 0.64 (so-called optimal damping) as possible. At this value, the pressure measurement system shows uniform frequency response (±5%) to about 88% of its natural frequency, according to Fry.4 If such optimal damping is achieved for the system illustrated in Figure 10.6, its frequency response could be considered flat to 0.88 N, or 27.5 Hz. Improperly damped systems with low natural frequencies (because of small air bubbles or excessively compliant tubing) may achieve uniform frequency response to <10 Hz.
TRANSFORMING PRESSURE WAVES INTO ELECTRICAL SIGNALS: THE ELECTRICAL STRAIN GAUGE
Pressure measurement systems today generally use electrical strain gauges based on the principle of the Wheatstone bridge. In its simplest form, the strain gauge is a variableresistance transducer whose operation depends on the fact that when an electrical wire is stretched, its resistance to the flow of current increases. As long as the strain remains well below the elastic limit of the wire, there is a wide range within which the increase in resistance is accurately proportional to the increase in length.
Figure 10.7 illustrates how the Wheatstone bridge uses this principle in converting a pressure signal to an electrical signal. In this schematic representation of a pressure transducer, pressure is transmitted through port P and acts on diaphragm D, which is vented to atmospheric pressure on its opposite side. In the illustration, the diaphragm is attached on its undersurface to a plunger, which in turn is attached to four wires, G1 through G4, as illustrated. The manner of attachment is such that increased pressure on the diaphragm stretches and therefore increases the electrical resistance of G1 and G2 and has the opposite effect on G3 and G4. In the Wheatstone bridge, G1, G2, G3, and G4 are connected electrically as in Figure 10.8 and are attached to a voltage source, B. If all four resistances are equal, then exactly half the voltage of battery B exists at the junction of G1 and G4 and half at the junction of G2 and G3, therefore, no current flows between the output terminals. However, when pressure is applied to the diaphragm (Figure 10.7), the resistances are unbalanced, so that the junction of G1 and G4 becomes negative, and a current flows across the output terminals.
Only gold members can continue reading. Log In or Register to continue