Transcatheter aortic valve implantation (TAVI) is already an accepted option to treat elderly patients with severe symptomatic aortic stenosis who are inoperable or at high surgical risk. However, short- and long-term mortality after TAVI remains an important issue, raising the need to further improve the technology of TAVI as well as to identify patients who will not benefit from TAVI. A total of 1,391 patients treated with TAVI at 27 hospitals were included in the German Transcatheter Aortic Valve Interventions – Registry. One-year follow-up data were available for 1,318 patients (94.8%), with a mean follow-up period of 12.9 ± 4.5 months. One-year mortality was 19.9%. Survivors and nonsurvivors showed multiple differences in patient characteristics, indications for interventions, preintervention and interventional characteristics, and postintervention events. A higher logistic European System for Cardiac Operative Risk Evaluation score was associated with higher 1-year mortality (p <0.0001). Cox proportional-hazards analysis revealed the following independent predictors of mortality: among preintervention findings: previous mitral insufficiency ≥II° (p = 0.0005), low-gradient aortic stenosis (p = 0.0008), previous decompensation (p = 0.0061), previous myocardial infarction (p = 0.0138), renal failure (p = 0.0180), previous New York Heart Association class IV (p = 0.0254), and female gender (p = 0.0346); among procedural factors: intraprocedural conversion to surgery (p = 0.0009), peri-intervention stroke (p = 0.0003), and residual aortic insufficiency ≥II° (p = 0.0022); and among postprocedural events: postintervention myocardial infarction (p = 0.0009) and postintervention pulmonary embolism (p = 0.0025). In conclusion, 1-year mortality after TAVI was 19.9% in this series. Patient characteristics and procedural as well as postintervention factors associated with mortality were identified, which may allow better patient selection and better care for these critically ill patients.
Transcatheter aortic valve implantation (TAVI) has rapidly been integrated into the care of elderly patients with severe symptomatic aortic stenosis and is now performed in almost 1/3 of patients who undergo aortic valve replacement therapy in Germany.
The superiority of TAVI compared with conservative treatment has been shown for patients who are not candidates for surgery, and its equivalence to surgical valve replacement was shown in high-risk surgical patients who are candidates for surgery. This has led to a class I/B recommendation for TAVI in inoperable patients and a class IIa/B recommendation for high-risk surgical patients in the most recent guidelines of the European Society of Cardiology on valvular heart disease, under the premise that the indication to perform TAVI is made by the so-called heart team and that TAVI is performed at a center with on-site cardiac surgery. However, short-term as well as long-term mortality and morbidity after TAVI remain an important issue, raising the need to further improve the technology as well as to identify patients who will not benefit from TAVI and those who are at too great a risk for TAVI. Data are available from registries and from 2 randomized trials that analyzed predictors of mortality after TAVI. However, the data sets are too small or the analyses concentrated only on some important factors for prognosis, without using a more general and formal approach. To identify predictors of hospital, postdischarge, and total mortality from intervention through the end of the follow-up period, we analyzed data from the German Transcatheter Aortic Valve Interventions – Registry.
Methods
The German Transcatheter Aortic Valve Interventions – Registry is a multicenter prospective registry. Details have been described elsewhere. Since January 2009, all participating hospitals have committed to include all consecutive patients with severe symptomatic aortic stenoses treated with balloon valvuloplasty either alone or in combination with TAVI. The registry ceased recruitment in June 2010, after which all patients were included in the prospective Deutsches Aortenklappenregister (German Aortic Valve Replacement – Registry [GARY]).
All patients gave written informed consent before the procedure and also gave written informed consent for processing of their anonymized data.
The baseline operative risk of the patients was estimated using the logistic European System for Cardiac Operative Risk Evaluation score (EuroSCORE). The decision to treat a patient as well as the decision to perform balloon valvuloplasty alone or to perform TAVI were left to the discretion of the treating physician. However, we strongly suggested that these decisions should be made by a multidisciplinary team, typically consisting of an interventional cardiologist and a cardiac surgeon, the so-called heart team, as suggested in current recommendations.
In a first analysis of our registry, we analyzed all patients treated with TAVI from the start of our registry to December 2009. In that analysis, only procedural, hospital, and 30-day events were analyzed. We then performed follow-up by telephone according to a prespecified protocol from Institut für Herzinfarktforschung (Ludwigshafen, Germany) or the treating hospital to evaluate 1-year outcomes and to analyze factors associated with follow-up events.
Our registry was open to all available prostheses. However, only 2 prostheses were commercially available in Germany at that time: the Medtronic CoreValve (Medtronic, Inc., Minneapolis, Minnesota) and the Edwards SAPIEN (Edwards Lifesciences, Irvine, California). Details of the valves used have been described elsewhere.
The degree of postprocedural aortic regurgitation was angiographically evaluated at the end of the TAVI procedure after final device deployment and removal of the catheter and guidewire. Qualitative angiographic assessment of the severity of aortic regurgitation was performed by visual estimation of the concentration of contrast medium in the left ventricle, using the method of Sellers et al. Preintervention mitral insufficiency was evaluated by echocardiography and was graded as absent (0), trace or mild (1/4), mild to moderate (2/4), moderate to severe (3/4), or severe (4/4).
Data were collected via the Internet by Institut für Herzinfarktforschung at the Heart Center Ludwigshafen. Absolute numbers and percentages as well as means and SDs or medians and interquartile ranges were computed to describe the patient population. Categorical values were compared using chi-square tests and continuous variables using 2-tailed Wilcoxon’s rank-sum tests. The Kaplan-Meier method was used to calculate 30-day as well as follow-up survival rates. Multivariate analyses were used to determine risk factors for the occurrence of total mortality. We analyzed 3 different time periods: (1) from the procedure until the end of follow-up, (2) from the procedure until discharge, and (3) from discharge until the end of follow-up. We compared patients who died during follow-up with those who survived. Those parameters that showed differences with p values ≤0.10 were included in the multivariate model. The logistic EuroSCORE was not included in the model because the individual factors were already included. We provide instead the Kaplan-Meier curves for 3 categories of the logistic EuroSCORE, the grade of postintervention aortic regurgitation, and the grade of preintervention mitral insufficiency. Cox proportional-hazards analysis was used to determine risk factors for mortality for the time interval from the procedure until the end of follow-up, and logistic regression analyses were used for the time intervals from the procedure until discharge and from discharge until the end of follow-up. A p value <0.05 was considered significant. All p values are the results of 2-tailed tests. Analysis was performed using SAS version 9.2 (SAS Institute Inc., Cary, North Carolina).
Results
From January 2009 to June 2010, 1,391 patients (807 women [58%], 584 men [42%]) treated with TAVI at 27 hospitals were included. The mean follow-up duration was 12.9 ± 4.5 months. One-year follow-up data were available for 1,318 patients (94.8%). According to Kaplan-Meier analysis, 1-year mortality was 19.9% ( Figure 1 ).
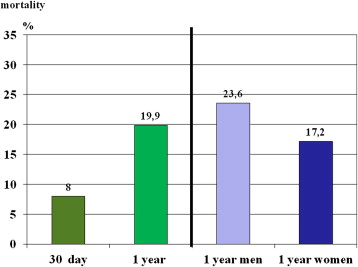
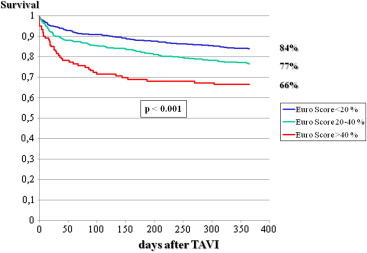
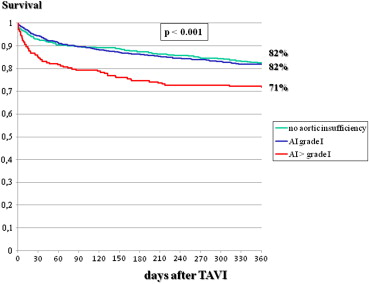
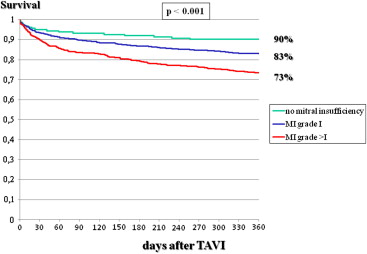
As listed in Tables 1 to 4 , the 2 groups showed multiple differences in patient characteristics, indications for interventions, preintervention and interventional characteristics, and postintervention events. In particular, there was a gender difference in 1-year mortality, which was 23.6% in men and 17.3% in women (p <0.001; Figure 1 ). A higher logistic EuroSCORE was associated with lower 1-year survival, which was 85% in patients with scores <20%, 77% in those with scores of 20% to 40%, and 66% in those with scores >40% ( Figure 2 ). The postintervention degree of aortic insufficiency was also associated with 1-year survival, which was 82% in patients with no aortic insufficiency, 82% in those with grade I insufficiency, and 71% in patients with aortic insufficiency greater than grade I (p <0.001; Figure 3 ). This was also found for preintervention degree of mitral insufficiency, which was also associated with 1-year survival, at 90% in patients with no mitral insufficiency, 83% in those with grade I insufficiency, and 73% in patients with mitral insufficiency greater than grade I (p <0.001; Figure 4 ). The 1-year death rate in the percutaneous TAVI group was 33.3% (41 of 123) and 20.6% (246 of 1,195) in the operative TAVI group (p = 0.0011).
| Variable | Patients Who Died | Patients Who Survived | p Value |
|---|---|---|---|
| (n = 287) | (n = 1,031) | ||
| Age (yrs) | 81.5 ± 6.2 | 81.8 ± 6.1 | 0.44 |
| Men | 50.2% (144/287) | 39.1% (403/1,031) | <0.001 |
| Body mass index (kg/m 2 ) | 26 ± 8 | 27 ± 11 | 0.06 |
| Previous coronary bypass surgery | 19.5% (56/287) | 17.7% (184/1,031) | 0.51 |
| Previous percutaneous coronary intervention | 42.3% (120/284) | 31.9% (328/1,028) | 0.001 |
| Previous valve surgery | 14.1% (9/64) | 17.1% (38/222) | 0.56 |
| Previous balloon valvuloplasty | 16.1% (46/285) | 10.4% (107/1,030) | 0.007 |
| Previous stroke | 10.2% (29/285) | 7.6% (78/1,030) | 0.15 |
| Diabetes mellitus | 38.2% (109/285) | 32.9% (339/1,029) | 0.09 |
| Chronic obstructive pulmonary disease | 30.2% (99/285) | 26.2% (270/1,030) | 0.006 |
| Peripheral arterial obstructive disease | 31.9% (91/285) | 17.7% (182/1,030) | <0.001 |
| Renal failure ∗ | 72.1% (207/287) | 57.3% (591/1,031) | <0.001 |
| Clinical presentation | |||
| NYHA class III | 63.7% (181/284) | 73.4% (752/1,025) | 0.002 |
| NYHA class IV | 27.5% (78/284) | 14.1% (145/1,025) | <0.001 |
| Frailty | 24.8% (70/282) | 15.9% (163/1,028) | <0.001 |
| Logistic EuroSCORE | 25 ± 17 | 19 ± 12 | <0.001 |
| Variable | Patients Who Died | Patients Who Survived | p Value |
|---|---|---|---|
| (n = 287) | (n = 1,031) | ||
| No coronary heart disease | 34.7% (99/285) | 42.9% (441/1,029) | 0.06 |
| Left ventricular ejection fraction (%) | 48 ± 16 | 55 ± 14 | <0.001 |
| Left ventricular ejection fraction ≤30% | 20.2 % | 9.3 % | <0.001 |
| Aortic valve area (cm 2 ) | 0.66 ± 0.24 | 0.69 ± 0.44 | 0.34 |
| Transvalvular mean gradient (mm Hg) | 46.3 ± 21.8 | 50.6 ± 18.5 | <0.001 |
| Bicuspid aortic valve | 2.1% (6/285) | 3.1% (32/1,026) | 0.37 |
| Severely calcified valve | 66.1% (189/286) | 66.1% (677/1,024) | 0.99 |
| Aortic annular diameter (mm) ∗ | 23 ± 3 | 23 ± 3 | 0.08 |
| Low-output low-gradient stenosis | 19.4% (55/283) | 9.2% (93/1,014) | <0.001 |
| Concomitant aortic insufficiency grade ≥3/4 | 4.5% (13/286) | 3.6% (37/1,027) | 0.46 |
| Concomitant mitral insufficiency grade ≥2/4 | 5.7% (16/285) | 2.5% (26/1,027) | 0.009 |
| Peak systolic pulmonary pressure (mm Hg) | 47 ± 17 | 45 ± 35 | 0.002 |
| Pulmonary hypertension | 68.8% (192/279) | 65.5% (673/1,027) | 0.30 |
| Atrial fibrillation | 31.3% (89/284) | 23.1% (238/1,029) | 0.004 |
| Porcelain aorta | 12.9% (37/286) | 10.2% (104/1,022) | 0.18 |
∗ Diameter of the plane connecting the nadirs of all 3 aortic cusps.
| Variable | Patients Who Died | Patients Who Survived | p Value |
|---|---|---|---|
| (n = 287) | (n = 1,031) | ||
| Elective intervention | 76.7% (220/287) | 85.5% (882/1,031) | <0.001 |
| Intervention during resuscitation | 1.0% (3/287) | 0% (0/1,031) | 0.001 |
| Type of valve used | |||
| Medtronic CoreValve | 78.3% (224/286) | 82.6% (850/1,029) | 0.10 |
| 26 mm | 45.3% (102/225) | 47.1% (402/853) | 0.63 |
| 29 mm | 54.7% (123/225) | 52.9% (451/853) | 0.63 |
| Edwards SAPIEN | 21.3% (61/286) | 17.0% (175/1,029) | 0.09 |
| 23 mm | 44.3% (27/61) | 46.3 (81/175) | 0.78 |
| 26 mm | 55.7 (34/61) | 53.7 (94/175) | 0.78 |
| Type of access used | |||
| Transfemoral access | 80.1% (230/287) | 90.2% (930/1,031) | <0.001 |
| Subclavian access | 5.6% (16/287) | 1.8% (19/1,031) | <0.001 |
| Surgical access | 14.3% (41/287) | 8% (82/1,031) | 0.001 |
| Transapical | 12.2% (35/287) | 7.6% (78/1,031) | 0.013 |
| Transaortic | 2.1% (6/287) | 0.4% (4/1,031) | 0.001 |
| Procedural characteristics | |||
| Intervention time (minutes) | 99 ± 60 | 87 ± 45 | 0.03 |
| Fluoroscopy time (minutes) | 15.26 ± 7.50 | 15.44 ± 7.37 | 0.41 |
| Amount of contrast dye used (ml) | 168 ± 75 | 163 ± 71 | 0.25 |
| Interventional closure of puncture site | 80.6% (183/227) | 86.0% (799/929) | 0.04 |
| Surgical closure of puncture site | 13.2% (30/227) | 6.8% (63/929) | 0.001 |
| Concomitant percutaneous coronary intervention during the same procedure | 6.3% (18/284) | 3.7% (38/1,030) | 0.05 |
| Variable | Patients Who Died | Patients Who Survived | p Value |
|---|---|---|---|
| (n = 287) | (n = 1,031) | ||
| Technical success | 92.0% (263/286) | 98.8% (1,019/1,031) | <0.001 |
| Conversion to open-heart surgery | 4.2% (12/286) | 0.5% (5/1,031) | <0.001 |
| Unsuccessful termination of the procedure | 3.8% (11/286) | 0.7% (7/1,031) | <0.001 |
| Mean gradient after the procedure (mm Hg) | 5.40 ± 5.98 | 5.99 ± 6.97 | 0.29 |
| Residual aortic insufficiency (grade) | 71.9% (200/278) | 67.5% (694/1,028) | 0.007 |
| 0 | 28.1 % (78/278) | 32.5% (334/1,028) | 0.007 |
| 1 | 50.0% (139/278) | 53.9% (554/1,028) | |
| 2 | 19.34% (54/278) | 12.5% (128/1,028) | |
| 3 | 1.8% (5/278) | 1.1% (11/1,028) | |
| 4 | 0.7% (2/278) | 0.1% (1/1,028) | |
| Pacemaker implantation | 33.8% (93/275) | 34.5% (353/1,022) | 0.82 |
| Clinical course | |||
| Time at intensive care unit (days) | 4.6 ± 4.3 | 2.9 ± 2.4 | <0.001 |
| Groin problems | 29.2% (81/277) | 19.6% (200/1,022) | <0.001 |
| Need for transfusion | 6.5% (18/277) | 1.7% (17/1,022) | <0.001 |
| Severe | 9.0% (25/277) | 2.1% (21/1,022) | <0.001 |
| Need for hemodynamic support (intra-aortic balloon pump/extracorporeal life support) | 2.9% (8/279) | 0% (0/1,016) | <0.001 |
| Pericardial tamponade | 1.8% (5/279) | 1.1% (11/1,018) | 0.35 |
| Aortic dissection | 1.8% (5/279) | 0.1% (1/1,018) | <0.001 |
| Coronary ischemia | 1% (2/279) | 0.2% (2/1,018) | 0.20 |
| Myocardial infarction | 2.1% (6/280) | 0.1% (1/1,023) | <0.001 |
| Stroke | 7.6% (21/278) | 1.6% (16/1,023) | <0.001 |
| Pulmonary embolism | 5.1% (14/277) | 0.7% (7/1,023) | <0.001 |
Cox proportional-hazards analysis revealed the following predictors of 1-year mortality ( Table 5 ): previous mitral insufficiency ≥II° (p = 0.0005), low-gradient aortic stenosis (p = 0.0008), previous decompensation (p = 0.0061), previous myocardial infarction (p = 0.0138), renal failure (glomerular filtration rate <60 ml/min/m 2 ; p = 0.0180), previous New York Heart Association class IV (p = 0.0254), female gender (p = 0.0346), intraprocedural conversion to surgery (p = 0.0009), peri-intervention stroke (p = 0.0003), residual aortic insufficiency ≥II° (p = 0.0022), postintervention myocardial infarction (p = 0.0009), and postintervention pulmonary embolism (p = 0.0025). Independent factors associated with hospital and postdischarge mortality are also listed in Table 5 .
| Variable | Wald’s Chi-Square | Adjusted HR (95% CI) | p Value |
|---|---|---|---|
| Overall mortality (procedure to end of follow-up) | |||
| Peri-intervention stroke | 12.90 | 1.72 (1.28–2.31) | 0.0003 |
| Previous mitral insufficiency ≥II° | 12.07 | 1.57 (1.22–2.02) | 0.0005 |
| Low-gradient aortic stenosis | 11.28 | 1.83 (1.29–2.61) | 0.0008 |
| Intraprocedural conversion to surgery | 11.06 | 4.13 (1.79–9.61) | 0.0009 |
| Postintervention myocardial infarction | 10.94 | 5.48 (2.00–15.00) | 0.0009 |
| Residual aortic insufficiency ≥II° | 9.41 | 1.63 (1.19–2.23) | 0.0022 |
| Postintervention pulmonary embolism | 9.18 | 2.92 (1.46–5.86) | 0.0025 |
| Previous decompensation | 7.51 | 1.48 (1.12–1.95) | 0.0061 |
| Previous myocardial infarction | 6.06 | 1.48 (1.08–2.03) | 0.0138 |
| Renal failure (GFR <60 ml/min/m 2 ) | 5.60 | 1.39 (1.06–1.82) | 0.0180 |
| Previous NYHA class IV | 4.99 | 1.44 (1.05–1.99) | 0.0254 |
| Female gender | 4.47 | 0.75 (0.57–0.98) | 0.0346 |
| Early (hospital) mortality | Adjusted odds ratio (95% CI) | ||
| Postintervention pulmonary embolism | 19.47 | 13.43 (4.24–42.58) | <0.0001 |
| Intraprocedural conversion to surgery | 14.07 | 14.08 (3.54–56.10) | 0.0002 |
| Pulmonary hypertension | 13.44 | 0.36 (0.21–0.62) | 0.0002 |
| Peri-intervention stroke | 11.93 | 2.46 (1.48–4.11) | 0.0006 |
| Residual aortic insufficiency ≥II° | 9.09 | 2.43 (1.36–4.32) | 0.0026 |
| Postintervention myocardial infarction | 6.93 | 16.40 (2.04–131.57) | 0.0085 |
| Low-gradient aortic stenosis | 6.19 | 2.34 (1.20–4.57) | 0.0128 |
| Previous NYHA class IV | 5.15 | 2.07 (1.10–3.88) | 0.0233 |
| Late mortality (discharge to 1 yr) | |||
| Female gender | 9.47 | 0.56 (0.38–0.81) | 0.0021 |
| Previous mitral insufficiency ≥II° | 8.56 | 1.70 (1.19–2.42) | 0.0034 |
| Previous balloon valvuloplasty | 5.07 | 1.70 (1.07–2.71) | 0.0243 |
| Renal failure (GFR <60 ml/min/m 2 ) | 4.60 | 1.49 (1.04–2.15) | 0.0319 |
| Previous American Society of Anesthesiologists class IV | 4.34 | 1.76 (1.03–2.99) | 0.0371 |
| Previous decompensation | 4.23 | 1.47 (1.02–2.12) | 0.0398 |
| Diabetes mellitus | 3.94 | 1.44 (1.00–12.06) | 0.0472 |
| Previous myocardial infarction | 3.91 | 1.56 (1.00–2.43) | 0.0479 |
Stay updated, free articles. Join our Telegram channel

Full access? Get Clinical Tree


