The aim of the study was to identify the determinants of pericardial effusion (PE) after a first myocardial infarction (MI). Cardiac magnetic resonance enables early analysis of multiple post-MI parameters; 193 patients with a first ST-elevation MI admitted to the Angers University Hospital (France) were enrolled prospectively. Cardiac magnetic resonance was performed at baseline (median of 5 days [4 to 7]) and repeated at a 3-month follow-up to investigate left ventricular (LV) volumes, LV ejection fraction, infarct size, microvascular obstruction (MVO), systolic wall stress (SWS), and PE presence and extent. A 1-year follow-up was also performed. Overall, 113 patients (58.5%) showed a PE with a median size of 31.6 ± 24.0 ml in the event that a PE was present. Patients with PE typically presented larger initial infarct sizes and LV volumes, and higher SWS, with more depressed LV ejection fraction and more frequent MVO and pleural effusions. Patients with PE exhibited higher rates of heart failure during hospitalization. At follow-up, there was no relevant PE, with no pericardiocentesis required. The multivariate analysis revealed SWS (odds ratio [OR] 1.092 [95% CI 1.007 to 1.184], p = 0.042), infarct size (OR 1.048 [95% CI 1.014 to 1.083], p = 0.003), and MVO extent (OR 1.274 [95% CI 1.028 to 1.579], p = 0.018) to be independent predictors for PE presence and volume. One patient died of LV free wall rupture during initial hospitalization, with only “small” PE found. In conclusion, infarct size, MVO, and SWS were independently related to PE presence and volume. Post-MI PE was found in 58.5% of cases, being regressive at follow-up. Among these patients with early reperfusion and optimal medical therapy, PE volume did not seem to be related to future clinical events.
In the setting of a recent ST-elevation myocardial infarction (MI), pericardial effusion (PE) is a common finding, yet its causative factors are poorly established. Although its incidence has decreased with modern therapies involving early reperfusion strategies, PE is currently observed in 4% to 19% of MI cases. Still, PE should be considered a risk factor for acute or subacute left ventricular (LV) free wall rupture, potentially resulting in tamponade and sudden cardiac death. Many parameters that may increase vascular permeability have been suggested, such as intensity of myocardial injury, increase in LV filling pressures, or microvessel injury and endothelial dysfunction. Microvascular obstruction (MVO) has, indeed, been associated with higher occurrence of PE or wall rupture. Contrary to echocardiography that remains the first-line examination for pericardium analysis, with inherent bidimensional limitations, cardiac magnetic resonance (CMR) imaging allows a direct and volumetric approach and revealed PE in 70% of cases. In addition, CMR offers a complete analysis of the LV in the context of acute MI by determining multiple and diverse parameters. We aimed to investigate the causative factors of PE in the context of acute MI, in particular using a marker for injury severity, endothelial injury, and loading conditions, namely infarct size, MVO, and systolic wall stress (SWS), respectively.
Methods
In total, 195 patients admitted to the Angers University Hospital (France) were enrolled prospectively from March 2006 until September 2011. All patients were referred for primary percutaneous coronary intervention for a first ST-elevation MI within 12 hours of symptom onset. Revascularization was successful with flow grade 3 after stenting. Exclusion criteria were cardiogenic shock, history of MI or aortocoronary bypass surgery, and initial cardiac arrest. The protocol was approved by the local institutional ethics committee, and the study was conducted in accordance with the Declaration of Helsinki and French regulatory requirements.
All patients underwent a detailed assessment of their medical history and clinical evaluation during the index hospitalization. CMR was performed at baseline, within 2 to 10 days after myocardial reperfusion (median 5 days [4 to 7]), with the examination repeated at 3-month follow-up (median 97 days [93 to 103]). Two patients did not complete baseline CMR scans because of claustrophobia. The statistical analysis was accordingly conducted on 193 patients. Three other patients having completed the 1-year follow-up refused to perform the 3-month CMR scan.
CMR scans were performed with a 1.5-T imager (Avanto; Siemens, Erlangen, Germany) using an 8-element phased-array cardiac receiver coil. LV function was assessed by means of cine imaging using a segmented steady-state–free precession pulse sequence in multiple short-axis views covering the entire LV. Late gadolinium enhancement was performed 10 to 12 minutes after initiation of gadoterate meglumine (DOTAREM; Guerbet, Aulnay-sous-Bois, France), administered in cumulative doses calculated at 0.2 mmol/kg of body weight, in conjunction with a 2-dimensional segmented inversion-recovery gradient-echo pulse sequence. For both sequences, typical in-plane resolution was 1.68 × 1.68 mm, with a 7.0-mm section thickness and no gap.
All de-identified images were analyzed at the central core laboratory by 2 experienced observers (LB and GC) who were blinded to the patient data. Commercially available software (QmassMR 7.1; Medis, Leiden, The Netherlands) was used for the analysis. Endocardial and epicardial borders were outlined manually on all end-diastolic and end-systolic short-axis cine slices. LV volumes, LV ejection fraction (LVEF), and LV myocardial mass were then calculated in a standard manner and indexed to the body surface area.
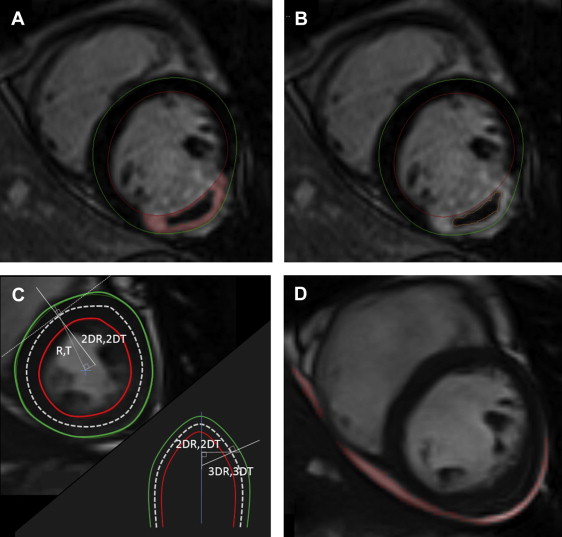
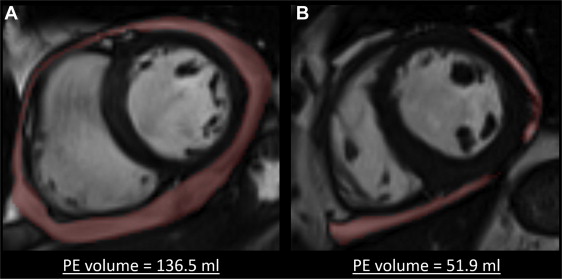
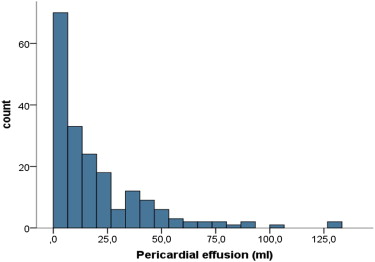
Pericardial volume was obtained by direct delineation on cine MRI imaging and end-diastolic short-axis views (see Figures 1 and 2 ). The measurement was performed on each end-diastolic LV short-axis view, covering the entire LV from the basis to the apex. The results were summed up to obtain PE volume (see distribution in Figure 3 ). Interobserver agreement was studied in a blinded fashion using CMR scans randomly selected from 30 patients, which were analyzed by 2 different observers. The intraclass correlation coefficient was 0.985 (95% CI 0.969 to 0.992) for PE volume assessment. To distinguish physiological from abnormal PEs, a panel of 10 healthy controls were similarly analyzed (mean age of 56 ± 10 years). Patients presenting a PE superior to the mean + 1 SD (volume ≥8.24 ml) were considered to have a pathologic PE.


The presence of pleural effusion was documented qualitatively on cine imaging sequences using 4-chamber and short-axis views when necessary.
The late gadolinium enhancement area was defined on each segment using the full-width at half-maximum method, with its total mass defining infarct size (as a percentage of total LV mass). MVO was identified by the presence of a central hypoenhancement within the bright signal, and the MVO area was manually traced on all segments. In cases where no MVO was present, MVO mass was set to zero ( Figure 1 ).
For CMR parameter analysis, including LV volumes, LVEF, LV mass, infarct size, and MVO mass, interobserver agreements were determined based on a set of 20 random patients.
Global SWS was calculated by a dedicated and inhouse software program using the modified Grossman formula and a 3-dimensional (3D) model on each slice. To sum it up, LV curvature direction was first calculated in the end-systolic short-axis plane; R and T and 2DR and 2DT constitute the radius of blood pool and wall thickness, first along radial lines emanating from the center of the ventricle mass and, second, perpendicularly to the middle line between the endocardial and epicardial borders, respectively. The longitudinal LV curvature direction was similarly extrapolated in the long-axis plane, with 3DR and 3DT accounting for 3D curvature (see Figure 1 ). SWS was given in 10 3 N/m 2 .
Outcomes were adjudicated by the agreement of 2 physicians unaware of the CMR results. During hospitalization, early pericarditis was defined as the presence of ≥2 of 4 diagnostic criteria (noncoronary chest pain, pericardial rub, electrocardiographic changes, and PE). We also distinguished deaths related to cardiovascular causes from others. Subsequently, late pericarditis, pericardiocentesis, septal or free wall rupture, death, and hospitalization for heart failure were tabulated per subject during a 1-year follow-up that was completed for every patient.
Data were presented as a mean ± SD or median with interquartile range from twenty-fifth to seventy-fifth percentile in cases of non-normal distribution, with categorical data expressed as frequencies and percentages. Comparisons of variables were performed using an unpaired Student’s t test or chi-square test as appropriate. We compared baseline with 3-month quantitative CMR parameters using the Wilcoxon test. To consider LV remodeling, Pearson’s tests were used to seek correlations between PE volume and changes in LV volume. In multivariate analyses for PE presence and volume determinants, clinical and CMR data were tested by either stepwise binomial logistic regression analysis or linear regression analysis when necessary, including variables with p values <0.05 in univariate analysis. The Hosmer-Lemeshow statistic was used to assess the goodness of fit of the applied models. The linear relation between dependent and independent variables was tested, as was the normal distribution of the residuals on P-P plots. Analysis was performed using SPSS version 15.0 for Windows (SPSS, Inc., Chicago, Illinois). A p value <0.05 was considered statistically significant.
Results
Of the 193 patients, 165 (85.5%) were men with a mean age of 57.5 ± 11.7 years. Of these, 108 (56.0%) presented anterior infarction. The mean creatine kinase peak was 3,067 ± 2,148 IU/L. Complete patient characteristics are given in Table 1 . Of the 193 consecutive patients, 113 (58.5%) presented a PE with a median size of 31.6 ± 24.0 ml in the event that a PE was present ( Figure 2 ). Table 1 lists the demographics, medical history, presenting features, and deferral treatments in patients with and without PE. Patients with PE typically presented larger infarction (13.9 ± 10.6% vs 27.4 ± 12.5%, p <0.001) and LV volumes, and higher SWS, with more depressed LVEF and more frequent MVO. We found no relations between PE volume and changes in LV end-systolic and end-diastolic volumes (r = 0.105, p = 0.15 and r = 0.110, p = 0.13, respectively; Table 2 ).
| Variables | TOTAL (n=193) | Pericardial effusion | p value | |
|---|---|---|---|---|
| No (n=80) | Yes (n=113) | |||
| Age (years) | 57.5 ± 11.7 | 57.3 ± 12.1 | 57.6 ± 11.4 | 0.88 |
| BMI (kg/m 2 ) | 26.9 ± 4.1 | 26.7 ± 3.9 | 27.1 ± 4.2 | 0.50 |
| Men | 165 (85) | 70 (87) | 95 (84) | 0.33 |
| Hypertension | 62 (32) | 24 (30) | 38 (34) | 0.35 |
| Active smoker | 85 (44) | 42 (52) | 43 (38) | 0.06 |
| Diabetes mellitus | 28 (15) | 10 (13) | 18 (16) | 0.33 |
| Dyslipidaemia | 95 (49) | 37 (46) | 58 (51) | 0.29 |
| Heredity | 53 (27) | 20 (25) | 33 (29) | 0.32 |
| Systolic blood pressure (mmHg) | 139.7 ± 26.9 | 134.8 ± 24.4 | 143.2 ± 28.1 | 0.034 |
| Heart rate (bpm) | 74.5 ± 18.0 | 71.9 ± 17.1 | 76.3 ± 18.5 | 0.09 |
| Time to reperfusion (min) | 264 ± 142 | 259+-141 | 268+-145 | 0.65 |
| Creatinine (μmol/l) | 84 ± 26.5 | 87.3 ± 34.2 | 81.7 ± 19.2 | 0.15 |
| Creatin kinase peak (IU/l) | 3067 ± 2148 | 2125 ± 1832 | 3709 ± 2118 | <0.001 |
| HbA1c (%) | 6.0 ± 1.1 | 6.0 ± 1 | 6.1 ± 1.2 | 0.73 |
| CRP peak(g/l) | 11.7 ± 22.4 | 10.9 ± 23.6 | 12.3 ± 21.5 | 0.67 |
| Fibrinogen peak (g/l) | 3.6 ± 1 | 3.5 ± 0.8 | 3.7 ± 1 | 0.22 |
| Preinfarction angina | 72 (37) | 34 (42) | 38 (34) | 0.23 |
| LAD culprit lesion | 108 (56) | 31 (39) | 77 (68) | <0.001 |
| Thrombolysis | 25 (13) | 10 (12) | 15 (13) | 0.53 |
| CMR initial assessment | TOTAL (n=193) | Pericardial effusion | p-value | |
|---|---|---|---|---|
| No (n=80) | Yes (n=113) | |||
| LVEDV index (ml/m 2 ) | 85.9 ± 16.7 | 80.9 ± 14.7 | 89.4 ± 17.2 | <0.001 |
| LVESV index (ml/m 2 ) | 46.0 ± 15.4 | 39.5 ± 12.7 | 50.5 ± 15.6 | <0.001 |
| LVEF (%) | 47.3 ± 10.3 | 51.8 ± 9.3 | 44.1 ± 9.8 | <0.001 |
| LV mass index (g/m 2 ) | 59.6 ± 11.5 | 56.2 ± 10.5 | 62.0 ± 11.6 | 0.001 |
| Infarct size (%) | 21.9 ± 13.5 | 13.9 ± 10.6 | 27.4 ± 12.5 | <0.001 |
| Systolic wall stress (10 3 N·m -2 ) | 16.0 ± 5.1 | 14.2 ± 4.5 | 17.2 ± 5.2 | <0.001 |
| MVO | 103 (53) | 24 (30) | 79 (70) | <0.001 |
| MVO extent (gr) | 2.7 ± 4.9 | 0.6 ± 1.3 | 4.2 ± 5.8 | <0.001 |
| Pericardial effusion (ml) | 19.6 ± 23.3 | 2.7 ± 2.7 | 31.6 ± 24.0 | <0.001 |
| CMR follow-up assessment | (n=189) | (n=80) | (n=109) | |
|---|---|---|---|---|
| LVEDV index (ml/m 2 ) | 86.5 ± 19.7 | 80.0 ± 15.6 | 91.4 ± 21.0 | <0.001 |
| LVESV index (ml/m 2 ) | 43.5 ± 18.1 | 36.8 ± 13.0 ∗ | 48.5 ± 19.8 | <0.001 |
| LVEF (%) | 50.9 ± 10.3 ∗ | 54.5 ± 9.0 ∗ | 48.3 ± 10.4 ∗ | <0.001 |
| LV mass index (g/m 2 ) | 53.5 ± 9.0 ∗ | 51.6 ± 8.5 ∗ | 54.9 ± 9.3 ∗ | 0.014 |
| Infarct size (%) | 17.6 ± 12.0 ∗ | 11.7 ± 10.2 ∗ | 21.9 ± 11.3 ∗ | <0.001 |
| Systolic wall stress (10 3 N·m -2 ) | 18.0 ± 7.3 ∗ | 15.5 ± 5.3 ∗ | 19.8 ± 8.1 ∗ | <0.001 |
Stay updated, free articles. Join our Telegram channel

Full access? Get Clinical Tree


