The underlying mechanism of mitral regurgitation (MR) because of isolated annulus dilation (Carpentier type I) remains controversial in patients with atrial fibrillation (AF). The present study evaluated changes in mitral valve geometry of patients with AF and structurally and functionally normal left ventricles and mitral leaflets. Grade of MR and left ventricular (LV) function was evaluated with echocardiography. Changes in mitral valve geometry were evaluated with multidetector row computed tomography (MDCT) performed before radiofrequency catheter ablation for AF. From a cohort of 480 patients with drug-refractory AF referred for catheter ablation, 170 patients (mean age 58 ± 10 years, 67% men) with structural and functional normal left ventricles and mitral leaflets were included. The intercommissural and anteroposterior diameter, perimeter, and area of the mitral annulus and left atrial volume were assessed with MDCT and correlated with the grade of MR as assessed with echocardiography. A total of 49 patients (29%) had MR ≥2+. These patients had larger mitral annulus area compared with patients with MR <2+ (665.0 ± 100.6 mm 2 /m 2 vs 530.5 ± 66.6 mm 2 /m 2 , p <0.001), whereas LV size and function (ejection fraction 64.9 ± 6.3% vs 63.1 ± 5.7%, p = 0.08) were similar. After adjusting for age, type of AF, hypertension, left atrial volume, and LV end-systolic volume and ejection fraction, the mitral annulus dimensions remained independently correlated with MR ≥2+. In conclusion, in AF patients with structural and functional normal left ventricles and mitral leaflets, MDCT demonstrated that mitral annulus dilation is independently associated with type I MR.
Mitral regurgitation (MR) is classified according to the mechanisms described by Dr. Carpentier as type I when leaflet motion is normal, type II when leaflet motion is excessive (prolapse), or type III if restrictive leaflet motion because of restriction and thickening of the valve and subvalvular apparatus (IIIa) or remodeling of the left ventricle (IIIb). The pathophysiology of type I MR is still debated, and in absence of mitral leaflet perforation (such as in endocarditis), isolated mitral annulus dilation as main pathophysiological determinant of significant MR is controversial. Atrial fibrillation (AF) is known to cause enlargement of the left atrium without coexisting necessarily with left ventricular (LV) dilation or dysfunction. Dilation of the left atrium may lead to mitral annulus dilation that can cause mitral leaflet coaptation failure and MR. The prevalence of significant type I MR in patients with AF remains unknown. In addition, the pathophysiological determinants of type I MR in this subpopulation have been mainly investigated with 2-dimensional (2D) echocardiography. The complex 3-dimensional (3D) saddle-shaped geometry of the mitral annulus challenges its accurate assessment with 2D imaging techniques. In contrast, multidetector row computed tomography (MDCT) enables 3D imaging of the mitral valve annulus in high-spatial resolution. Patients with AF are frequently evaluated with contrast-enhanced MDCT before radiofrequency catheter or surgical ablation procedures to assess pulmonary vein anatomy. From those MDCT data sets, novel insights into the geometrical remodeling of the mitral valve annulus in AF patients and its relation with the presence of type I MR could be analyzed. Accordingly, the aim of the present study was to assess the geometry of the mitral valve annulus with MDCT and to correlate the mitral annulus dimensions with type I MR grade in a population of AF patients with structural and functional normal left ventricles and with structurally normal mitral leaflets.
Methods
The population comprised 170 patients with structurally and functionally normal left ventricles and mitral leaflets selected from a cohort of 480 patients with symptomatic, drug-refractory AF referred for radiofrequency catheter or surgical ablation. Grade of MR and LV systolic function was assessed with transthoracic echocardiography. MDCT was clinically performed to provide geometric information of the left atrium and pulmonary veins and for the evaluation of coronary artery disease. Patients with LV dysfunction (ejection fraction <55%) or dilated LV end-diastolic volume (≥75 ml/m 2 ) (n = 107), nonischemic cardiomyopathy (n = 76), previous myocardial infarction or coronary revascularization (n = 14), moderate or severe aortic, pulmonary, or tricuspid valve disease (n = 29), atrial or ventricular septum defects (n = 10), and organic or restrictive mitral valve disease (n = 26) were excluded. In addition, patients without an available preprocedural echocardiogram (n = 9) or with only systolic MDCT data reconstructions (n = 39) were excluded. The remaining 170 patients were subsequently divided into 2 groups according to the preprocedural type I MR grade assessed on transthoracic echocardiography: 121 (71%) patients with MR <2+ and 49 (29%) with MR ≥2+. MDCT-derived dimensions of the mitral valve annulus were compared between the 2 groups and associated with the MR grade. All clinical, echocardiographic, and MDCT data were collected in the departmental electronic clinical files (EPD Vision, version 8.3.3.6, Leiden, The Netherlands) and retrospectively analyzed.
MDCT scans were performed with a volumetric 320-detector row computed tomography scanner (AquilionOne; Toshiba Medical Systems, Tochigi-ken, Japan) using a collimation of 320 × 0.5 mm and a rotation time of 350 ms. Depending on the patient’s body mass index, tube currents and voltages varied from 230 to 580 mA and 100 to 135 kV. If not contraindicated, β blockers were administered to patients with heart rates >65 beats/min. Depending on the patient’s body weight, 60 to 100 ml of nonionic contrast material (Iomeron 400; Bracco, Milan, Italy) was administered in the antecubital vein: first 50 to 90 ml of contrast material (flow rate 5.0 to 6.0 ml/s), followed by a 1:1 mixture of 20 ml contrast:saline, which again was followed by 25 ml saline (flow rate 3.0 ml/s). To synchronize the triggering of the scan with the arrival of the contrast material in the left ventricle, automated peak enhancement detection was used with a threshold of +180 Hounsfield units. The entire heart was scanned in a single volume using prospective electrocardiogram triggering with dose modulation. Phase windows were adjusted to heart rate and rhythm and set at 70% to 80%, 65% to 85%, or 30% to 80% of the RR interval in patients with regular heart rates of <60, 60 to 65, or >65 beats/min, respectively. In case of irregular heart rhythms, target scans were performed at 75% or 45% of the RR interval for heart rates of ≤65 beats/min or heart rates of >65 beats/min. MDCT data were automatically reconstructed in the end-diastolic phase (75% of the RR interval) with a slice thickness of 0.5 mm and with a reconstruction interval of 0.25 mm. To obtain the maximal image quality, additional phases with the least motion artifacts were reconstructed. Subsequently, the reconstructed data sets were transferred for off-line postprocessing and analysis to an external workstation (Vitrea 2; Vital Images, Plymouth, MN).
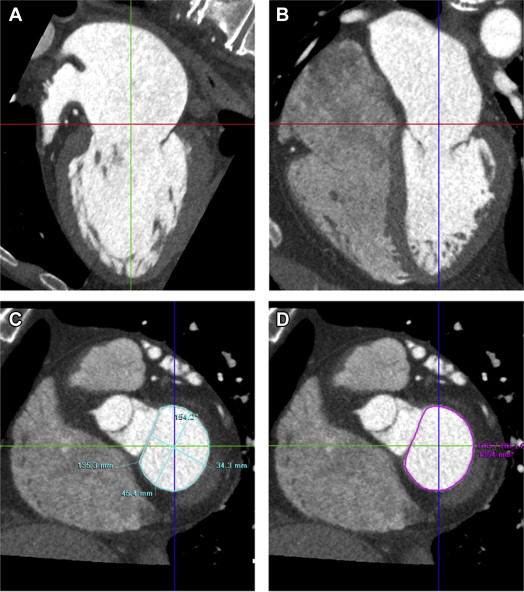
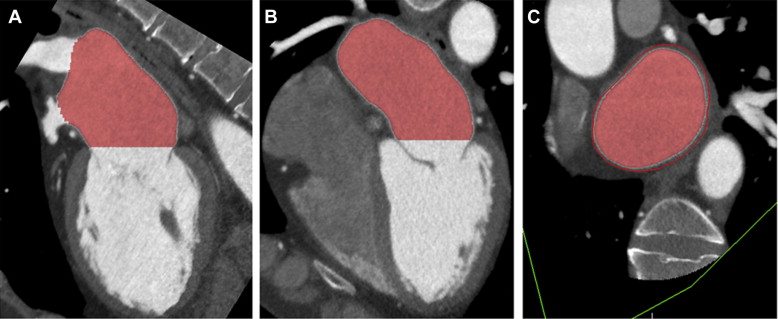
Three orthogonal multiplanar reformation planes were aligned to obtain the 2- and 4-chamber views of the left ventricle and the short-axis view of the mitral valve annulus ( Figure 1 ). From the short-axis view, the intercommissural and anteroposterior diameter, perimeter, and area of the mitral valve annulus were assessed ( Figure 1 ). Subsequently, left atrial (LA) volume was quantified using a semiautomatic endocardial contour tracing algorithm ( Figure 2 ). To ensure that the pulmonary vein ostia and LA appendage were excluded from analysis, manual corrections of the automatic trace were performed. Mitral annulus dimensions and LA volume were indexed to body surface area.
Transthoracic 2D, pulsed, continuous, and color Doppler echocardiographic data were acquired using commercially available systems with 3.5 MHz or M5S transducers (Vivid-7 or E9 Systems; General Electric Vingmed, Horten, Norway). The parasternal (long and short axis), apical (2, 3, and 4 chamber), and subcostal views were acquired with the patients in left lateral decubitus position. Data sets were stored digitally in cine-loop format to allow for off-line analysis (EchoPac 112.0.1; GE Medical Systems, Horten, Norway).
From the apical 2- and 4-chamber views, LV end-diastolic and end-systolic volumes were quantified and indexed to body surface area; LV ejection fraction was derived according to the Simpson’s biplane method. According to current recommendations, the severity of MR was semiquantitatively graded from color and continuous wave Doppler images with a multiparametric approach as: none or trivial (0 or 1+), mild (2+), moderate (3+), or severe (4+).
Summary statistics for continuous variables are presented as mean ± SD as appropriate, and categorical variables are expressed as frequencies and percentages. Differences between patients with MR <2+ and patients with MR ≥2+ were analyzed with the unpaired Student t test, for continuous data, and the chi-square test, for categorical data. To explore clinical, echocardiographic, and MDCT correlates of the presence of MR ≥2+, univariate logistic regression analysis was performed. Subsequently, those variables with a univariate p value <0.10 were selected for multivariate analysis to identify independent correlates of MR ≥2+. To avoid multicollinearity, multivariate analysis was performed with 4 non-nested logistic regression models to assess the independent correlation between the MDCT-derived mitral annulus dimensions (intercommissural and anteroposterior diameter, perimeter, and area) and the presence of echocardiographic MR ≥2+ separately. Linear regression analysis was performed to explore the association between LA volume and mitral valve annulus area. Statistical tests were 2 sided, and p values were considered to be statistically significant if <0.05. For all statistical analyses, SPSS software, version 20.0 (SPSS Inc., Chicago, IL) was used.
Results
Baseline and echocardiographic characteristics of the patient population (mean age 58 ± 10 years, 67% men) are summarized in Tables 1 and 2 . According to current definitions, AF was paroxysmal in 144 patients (85%) and persistent in 26 patients (15%). Sex distribution, body surface area, onset of AF, cardiovascular risk factors, and medication were comparable between patients with MR <2+ and patients with MR ≥2+. Patients with MR ≥2+ were older and had a higher prevalence of persistent AF compared with patients with MR <2+. Importantly, there were no differences between the 2 groups in terms of LV ejection fraction and LV end-diastolic volume. However, LV end-systolic volume was significantly larger in patients with MR ≥2+ compared with patients with MR <2+.
| Variable | Overall Population (n = 170) | Mitral Regurgitation Severity | p-Value | |
|---|---|---|---|---|
| <2+ (n = 121) | ≥2+ (n = 49) | |||
| Age (years) | 58 ± 10.2 | 56 ± 10.0 | 63 ± 8.7 | <0.001 |
| Male | 114 (67%) | 80 (66%) | 34 (69%) | 0.681 |
| Body surface area (m 2 ) | 2.04 ± 0.21 | 2.05 ± 0.20 | 2.02 ± 0.21 | 0.394 |
| Atrial fibrillation pattern | 0.010 | |||
| Paroxysmal | 144 (85%) | 108 (89%) | 36 (73%) | |
| Persistent | 26 (15%) | 13 (11%) | 13 (27%) | |
| Atrial fibrillation onset | 0.933 | |||
| <1 year | 10 (6%) | 7 (6%) | 3 (6%) | |
| ≥1 year | 160 (94%) | 114 (94%) | 46 (94%) | |
| Hypertension | 70 (41%) | 45 (37%) | 25 (51%) | 0.097 |
| Diabetes mellitus | 7 (4%) | 5 (4%) | 2 (4%) | 0.988 |
| Beta-blockers | 113 (66%) | 81 (67%) | 32 (65%) | 0.838 |
| Antiarrhythmic drugs | 158 (93%) | 112 (93%) | 46 (94%) | 0.595 |
| Mitral regurgitation grade | <0.001 | |||
| 0 | 44 (26%) | 44 (36%) | 0 (0%) | |
| 1 | 77 (45%) | 77 (64%) | 0 (0%) | |
| 2 | 42 (25%) | 0 (0%) | 42 (86%) | |
| 3 | 7 (4%) | 0 (0%) | 7 (14%) | |
| Variable | Overall Population (n = 170) | Mitral Regurgitation Severity | p-Value | |
|---|---|---|---|---|
| <2+ (n = 121) | ≥2+ (n = 49) | |||
| Mitral valve annulus | ||||
| Intercommissural diameter (mm/m 2 ) | 21.0 ± 2.3 | 20.3 ± 1.9 | 22.7 ± 2.4 | <0.001 |
| Anteroposterior diameter (mm/m 2 ) | 15.8 ± 2.1 | 15.1 ± 1.6 | 17.7 ± 2.1 | <0.001 |
| Perimeter (mm/m 2 ) | 61.9 ± 6.4 | 59.8 ± 5.0 | 67.1 ± 6.5 | <0.001 |
| Area (mm 2 /m 2 ) | 569.2 ± 98.8 | 530.5 ± 66.6 | 665.0 ± 100.6 | <0.001 |
| Left ventricular ejection fraction (%) | 64.4 ± 6.2 | 64.9 ± 6.3 | 63.1 ± 5.7 | 0.08 |
| Left ventricular end-diastolic volume (ml/m 2 ) | 50.1 ± 10.0 | 49.6 ± 10.2 | 51.3 ± 9.3 | 0.30 |
| Left ventricular end-systolic volume (ml/m 2 ) | 17.8 ± 4.8 | 17.3 ± 4.9 | 19.2 ± 4.2 | 0.02 |
| Left atrial volume index (ml/m 2 ) | 49.7 ± 13.2 | 45.4 ± 10.2 | 60.2 ± 13.7 | <0.001 |
Stay updated, free articles. Join our Telegram channel

Full access? Get Clinical Tree


