Pleura, Chest Wall, and Diaphragm
Very early in its development, the value of computed tomography (CT) was recognized in assessing pleural and chest-wall diseases (1,2). This reflects in part the wide range of pathology that affects these areas, as well as the accepted limitations of chest radiography, especially in the assessment of complex pleural and parenchymal disease. In this chapter, the value and limitations of CT in the assessment of diffuse and focal pleural disease, chest-wall lesions, and the diaphragm are discussed and illustrated. Potential applications of magnetic resonance (MR) and especially fluorodeoxyglucose–positron emission tomography (FDG-PET) scanning also are addressed.
Pleura
Computed Tomography Technique
Multidetector CT (MDCT) scanning has simplified our approach to imaging diseases related to the pleura, chest wall, and diaphragm. The ability to acquire contiguous thin (1 to 3 mm) sections throughout the chest in a single breath-hold has made visualization of otherwise difficult anatomic regions, such as the diaphragm or thoracic inlet, far easier to evaluate (3, 4, 5, 6). The use of multiplanar coronal and sagittal reconstructions, in particular, has proved of value in assessing the relation between lesions and fissures, for example, or evaluating the chest wall and diaphragm after blunt trauma. The ability to generate contiguous high-resolution axial images, either prospectively or especially retrospectively, may also prove of value in detecting subtle pleural and extrapleural abnormalities, for example, in detecting asbestos-related pleural plaques (7). In cases in which radiation exposure must be minimized, it has been shown that low-dose (mAs of 80 to 100) technique is an acceptable method for evaluating pleural disease (8).
As is extensively illustrated, the administration of intravenous contrast can play an indispensable role, especially in differentiating between pleural and parenchymal processes (9, 10, 11, 12). In cases in which the major indication for CT is evaluation of complex pleuro-parenchymal disease, a bolus of intravenous (IV) contrast should be administered, with sections obtained volumetrically, when available. This technique allows optimal visualization of parenchymal vasculature during the phase of maximal pulmonary artery and vein enhancement. It has been suggested that images be obtained between 20 and 60 seconds after IV contrast administration to optimize visualization of the parenchyma, specifically when the lung is consolidated or collapsed (13).
Localization
CT is of greatest efficacy in (a) confirming the presence of a lesion; (b) determining its precise location and extent as either primarily pulmonary or pleural; and (c) further characterizing the nature of the pathology by means of attenuation coefficients.
Peripheral lesions are generally classified as extrapleural, pleural, or parenchymal, and are usually characterized radiographically by the angle (either acute or obtuse) formed by the interface between the lesion and the adjacent pleura. Unfortunately, although CT is far superior to routine chest radiography in detecting the presence of pathology, considerable overlap is found in the cross-sectional appearance of these lesions, as shown in Figure 9-1.
Extrapleural lesions usually displace the overlying parietal and visceral pleura, resulting in an obtuse angle between the lesion and the chest wall (Fig. 9-2). Associated changes, such as rib destruction or muscle infiltration, help to confirm the site of origin as extrapleural, although these signs are often absent. Extrapleural lesions may prolapse into the adjacent lung, resulting in acute angulation between the lesion and the chest wall; however, this is uncommon.
Pleural lesions arising from the visceral or parietal pleura usually remain confined to the pleural space and have a configuration similar to that of extrapleural lesions. However, pedunculated pleural lesions, especially those arising from the visceral pleura, are an important exception (14,15). As shown in Figure 9-1, these may prolapse or invaginate into the adjacent pulmonary parenchyma. If the lesion is small, the appearance will mimic a peripheral, subpleural parenchymal nodule; if the lesion is larger and broad-based, the appearance of a pedunculated pleural lesion may mimic larger intraparenchymal subpleural lesions (Fig. 9-3).
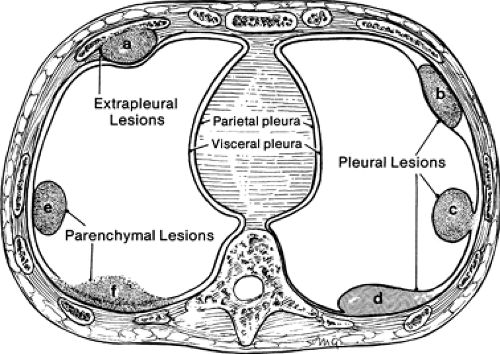 Figure 9-1 Schematic drawing of the cross-sectional appearance, typical and atypical, of extrapleural, pleural, and peripheral parenchymal lesions. Extrapleural lesions displace the overlying parietal and visceral pleura (a), resulting in an obtuse angle between the lesion and the chest wall. Associated chest-wall pathology (for example, rib erosion) helps define the lesion as extrapleural. Pleural lesions generally remain confined between the layers of the pleura and cause obtuse angles between the lesion and the chest wall (b). Pleural lesions, however, may be pedunculated (c), in which case, they may prolapse into the pulmonary parenchyma, resulting in acute angles between the lesion and the chest wall. Additionally, pleural fibrosis may result in fusion of the parietal and visceral pleura (d), leading to abnormal configurations of pleural lesions and/or loculation of pleural fluid. Parenchymal lesions, if subpleural, abut the pleural (e, f), resulting in acute angulation with the chest wall. Clearly, although the mechanics vary, a considerable overlap exists in the cross-sectional appearance of extrapleural, pleural, and parenchymal lesions. In practical terms, a biopsy should be performed on all peripheral soft tissue lesions, regardless of site of origin. |
The cross-sectional appearance of pleural pathology, especially loculated pleural fluid collections, will also be affected by pleural adhesions along the lesion margins. Pleurodesis restricts the mobility of the pleural layers; the result may be acute angulation between the pleural lesion and/or fluid, and the adjacent chest wall (Fig. 9-1).
Pulmonary parenchymal lesions, when peripheral, may abut the pleura; this typically results in acute angulation between the lesion and the chest wall. However, if sufficiently large, parenchymal lesions may result in ob-tuse angles between the lesion and the chest wall, usually as the result of visceral and parietal pleural infiltration (Figs. 9-1 and 9-4) (16). It cannot be overemphasized that evaluation of peripheral lung lesions that only abut pleural surfaces is extremely limited; the configuration of peripheral lung cancer in relation to the chest wall, for example, is of little use in determining whether histologic invasion of the pleura is present. As is discussed in greater detail later, exclusion of tumor infiltration into the pleura or chest wall often requires biopsy.
Another potential pitfall in differentiating parenchymal from pleural disease is the presence of fluid within pre-existing parenchymal cavities (17). As documented by Zinn et al. (17), fluid within bullae may precisely mimic the appearance of a loculated pleural fluid collection. In selected cases, differentiation may be possible only by reference to previous chest radiographs documenting the presence of prior bullous lung disease (Fig. 9-5). Therefore it is apparent that although the mechanics of pathology vary, the result is that considerable overlap may exist in the cross-sectional appearance of extrapleural, pleural, and peripheral subpleural parenchymal lesions (Fig. 9-1).
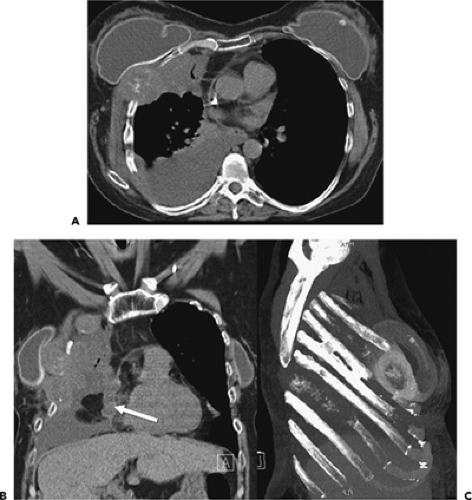 Figure 9-2 Rib metastasis in a patient with lung cancer. A: 5-mm unenhanced CT section demonstrates a lytic destructive lesion centered around a right-sided rib. An associated large soft tissue extraosseous component is seen. A dependent effusion is present. Note the obtuse angles between the lesion and the adjacent lung. B: Coronal 5-mm reconstruction performed from a 1-mm volumetric data set retrospectively reconstructed on a multidetector scanner. Multiple right-sided destructive rib metastases with extraosseous soft tissue are present. Pericardial metastases are also noted medially (arrow). C: A maximum intensity projection of the entire thoracic volume facilitates visualization of multiple rib osseous abnormalities simultaneously. Cosmetic breast implants are incidentally present. |
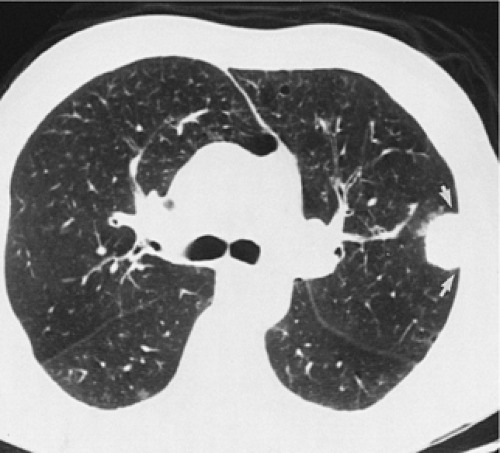 Figure 9-3 Benign fibrous tumor of the pleura. Section through the left midlung demonstrates a well-defined tumor mass on the left side. Note that, unusual for a lesion arising from the pleura, the lesion forms acute margins with the chest wall. At surgery, this feature was confirmed to be due to the pedunculated nature of the lesion with a narrow focal pleural attachment. Pedunculation is not uncommon in fibrous tumors of the pleura, accounting for lesion mobility and variable anatomic location on radiographs and CT. |
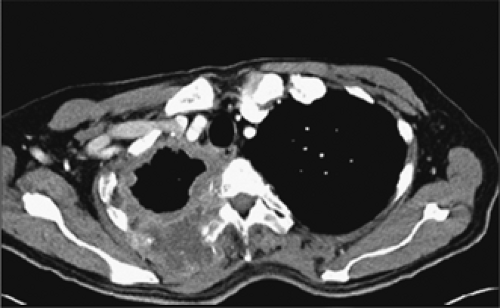 Figure 9-4 Chest-wall invasion: bronchogenic carcinoma with extensive localized spread. Enhanced 5-mm section through the lung apices demonstrates an enhancing mass invading the chest wall, destroying the ribs, and eroding the medial aspect of the vertebral body. |
Tissue Density Characteristics
As compared with routine chest radiographs, a major value of both CT and MRI is their ability to provide improved contrast resolution. This has proven to be immensely valuable in assessing pleural pathology, especially in detecting the presence of pleural fluid (18,19). Less commonly, CT may help in differentiating a lipoma from a soft tissue mass or cyst (Fig. 9-6) (20). Unfortunately, although CT is extremely accurate in detecting the presence of pleural fluid, CT densitometry is of less clinical value in differentiating among the various etiologies of pleural effusions. Specifically, CT numbers do not allow differentiation between transudative and exudative effusions and cannot even be used reliably to detect chylous effusions (21, 22, 23). More recently, as shown by Nandalur et al. (24), in a retrospective evaluation of 145 pleural effusions, including 101 exudates and 44 transudates, although a significant difference in CT density could be identified between exudates and transudates [17.1 HU vs. 12.5 HU (p < 0.001)], the overall accuracy of attenuation values for identifying exudates proved only moderate, with the most important limitation due to overlap between transudates and exudates in effusions in the 10- to 20-HU range.
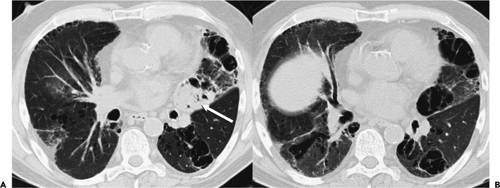 Figure 9-5 Infected bulla. CT sections through the region of the lingula initially (A) and 3 months later after antibiotic therapy (B). On the initial examination, a soft tissue neoplastic mass was suspected in the medial lingula, with possible areas of cavitation. However, after therapy with antibiotics, complete clearance of this area was demonstrated, revealing a large paraseptal bulla that had become fluid filled and infected (B). Emphysema with numerous other paraseptal and centrilobular bullae is evident. Fluid-filled bullae may also mimic the appearance of empyema when they lie in an elongated subpleural distribution and should always be considered in patients with extensive bullous disease. |
In the setting of an acute bleed, CT may allow identification of hemorrhagic pleural effusions (Fig. 9-7). Rarely, CT also may be of value in detecting so-called milk of calcium effusions resulting from chronic inflammation (25). Although CT easily detects the presence of even small pneumothoraces (Fig. 9-8), considerable limitations apply in the evaluation of soft tissue masses, for which specific histologic diagnosis can be made only rarely. From a practical standpoint, a biopsy should be performed on any peripheral soft tissue mass, regardless of its probable site of origin.
Interlobar Fissures
The interlobar fissures represent invaginations of the visceral pleura, which, to a variable degree, separate the pulmonary lobes. Knowledge of fissural anatomy is essential in the localization and diagnosis of both pleural and parenchymal abnormalities. Interlobar fissures can be localized on CT in nearly all cases, based on knowledge of their anatomy, although their appearances vary depending on whether thick collimation (5 to 10 mm) or thin collimation (1 to 3 mm) is used (26, 27, 28, 29, 30, 31).
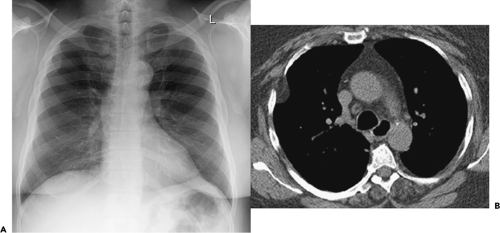 Figure 9-6 Pleural/Chest-wall lipoma. A: In a 52-year-old male patient, posteroanterior chest radiograph shows an ill-defined soft tissue density in the right upper lung field. The obtuse angle margins to the lung parenchyma suggest a pleural or extrapleural lesion. The presence of bilateral mid-thoracic thickening, gynecomastia, and a further lobulated density in the right apex suggests the possibility of a pleural lipoma. B: A 5-mm noncontrast CT confirms the presence of pure fat-density pleural lesion invaginating into the chest wall. The appearance is pathognomonic and requires no further diagnostic evaluation. |
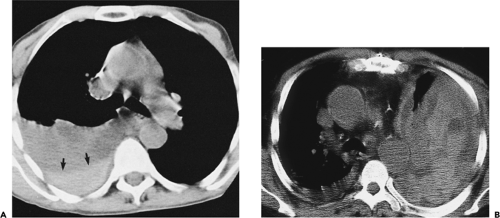 Figure 9-7 Hemorrhagic effusions. A: Pleural hemorrhage. CT section shows a large right-sided pleural fluid collection within which a clear fluid–fluid level is seen (arrows). The density within the dependent fluid collection measured within the range of acute hemorrhage, subsequently verified via thoracentesis. B: Non–contrast-enhanced CT section through a different patient than in A, after trauma. A massive hemothorax is identifiable as inhomogeneous areas of high contrast. Note that in this case, a marked shift of the mediastinum and a small right pleural effusion are present. |
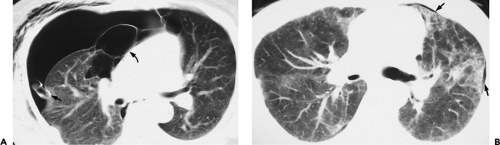 Figure 9-8 Pneumothorax: CT evaluation. A: CT section in a patient previously diagnosed with a spontaneous pneumothorax (PTX) shows evidence of a residual large right PTX, despite the presence of a right-sided chest tube (arrow). In this case, the persistent air leak was due to underlying bullous emphysema, identifiable as a cluster of cysts involving the medial aspect of the middle lobe (curved arrow). Not surprisingly, these were not initially identifiable on the admission radiograph. B: CT section in an acquired immunodeficiency syndrome (AIDS) patient shows ill-defined areas of ground-glass attenuation, especially in the left upper lobe. Note the presence of a subtle, “occult” PTX (arrows). These two cases point out the potential contribution of CT both to detect and to characterize PTXs. |
The Major (Oblique) Fissure
The major fissures serve to separate the lower lobe from the upper lobe on the left, and from the upper and middle lobes on the right. However, many patients have incomplete major fissures, with some contiguity between the parenchyma of adjacent lobes. In anatomic studies, the right major fissure is complete in only 30% of patients (32,33), although in an additional 30%, near complete separation is present. The right major fissure is more often complete inferiorly; complete separation of the right lower and middle lobes is present in about 53% of patients (32,33). On the left, the major fissure has been reported to be complete in 27% to 60% of patients, although the extent of contiguity between lobes is often minimal (32,33).
On CT obtained by using thin collimation or high-resolution technique, the major fissures usually appear as thin, well-defined lines, surrounded by a plane of avascular lung measuring about 1 cm in thickness (Fig. 9-9). If the fissure is invisible on high-resolution CT (HRCT), it may be incomplete. In some cases, cardiac motion during the scan results in a confusing artifact termed the “double-fissure” sign (34). When present, this artifact is easily identifiable, as the fissure is visible in two locations on the same scan. Recognition of this artifact is most important in cases in which detailed high-resolution imaging of the airways and parenchyma is performed. With MDCT scanners, it is now possible to obtain high-quality sagittal multiplanar reconstructions through the entire length of the major fissures, in selected cases simplifying localization of parenchymal abnormalities.
The Minor (Horizontal) Fissure
The minor or horizontal fissure separates the superior aspect of the right middle lobe from the right upper lobe. Incompleteness of the minor fissure is common, occurring in 78% to 88% of patients. The minor fissure is most often incomplete laterally, with contiguity of the parenchyma of the upper and middle lobes (32).
The minor fissure is rarely visible on routine axial images, as its position generally parallels the scan plane. Characteristically, however, the position of the minor fissure can be inferred by identifying a broad avascular band in the anterior portion of the right lung, anterior to the major fissure, at the level of the bronchus intermedius (Fig. 9-9). This avascular region represents peripheral lung on each side of the fissure, lying in or near the plane of scan. The avascular band is often triangular, with one corner of the triangle at the pulmonary hilum, and the other two laterally, but considerable variation in the appearance of the minor fissure can be seen owing to variations in its orientation and curvature. Less frequently, the avascular region of the minor fissure appears rectangular or round or elliptical. This appearance has been labeled the “right midlung window.” (28).
The appearance of the minor fissure on scans obtained by using thin-section or HRCT technique is quite variable (Figs. 9-10 and 9-11) (26,35,36). Depending on its orientation and contour, the fissure may appear as (a) a thick or thin linear opacity, directed from anterior to posterior, and either medial or lateral in location; (b) a thick or thin linear opacity, extending from medial to lateral, paralleling and anterior to the major fissure; (c) an ill-defined opacity resulting from the fissure lying in the plane of scan; (d) a circle or ring; or (e) a combination of these findings (Figs. 9-10 and 9-11). Interestingly, in one study, the minor fissure appeared to be absent in 20% of cases and incomplete in 72% (35). Similar findings using 1.5-mm sections have been reported by Frija et al. (26), who also found that the minor fissure was incomplete in 76% of cases.
Recently it has become apparent that whereas the fissures characteristically have smooth margins along most of their length, it is common to identify focal areas of nodular thickening, especially in the mid portions of the major fissures and anterior aspect of the minor fissure (Fig. 9-12) (37).
These pseudotumors should not be mistaken for true nodules, as long-term follow-up CT scans fail to document any change in the vast majority of cases. Differentiation between these pseudo fissural nodules and true lung nodules is best accomplished with contiguous high-resolution 1-mm images.
These pseudotumors should not be mistaken for true nodules, as long-term follow-up CT scans fail to document any change in the vast majority of cases. Differentiation between these pseudo fissural nodules and true lung nodules is best accomplished with contiguous high-resolution 1-mm images.
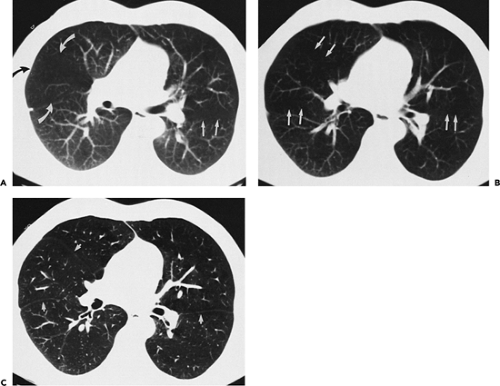 Figure 9-9 Normal pleural fissures. A, B: The 10-mm sections are through the bronchus intermedius and origin of the middle lobe bronchus, respectively. The appearance on CT of the fissures is variable, depending on their axis relative to the plane of cross section. As shown in A and B, the major fissures most often are identifiable as broad avascular bands within the pulmonary parenchyma (straight arrows in A and B). The minor fissure appears as a broad, triangular, or ovoid band in the anterior portion of the right lung, typically located at the level of the bronchus intermedius (curved arrows in A). C: A 1.5-mm-thick section at the same level as shown in B. Note that with thin sections, the fissures now appear as sharply etched thin lines (arrows). |
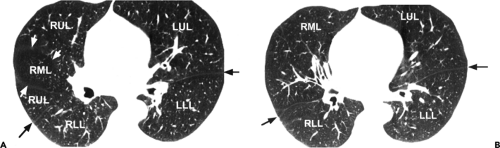 Figure 9-10 Major and minor fissures; appearance on high-resolution CT. A–D: On sequential high-resolution CT images, the major fissures (black arrows) and minor fissure (white arrows) are visible as thin white lines. The major fissures tend to bow anteriorly. The appearance of the minor fissure is variable, depending on its orientation to the plane of scan. In this patient (A), the minor fissure outlines a roughly circular portion of right middle lobe. RUL, right upper lobe; LUL, left upper lobe; RML, right middle lobe; RLL, right lower lobe; LLL, left lower lobe. E: In another patient, the minor fissure (arrow) is incomplete, being visible only in its lateral aspect. |
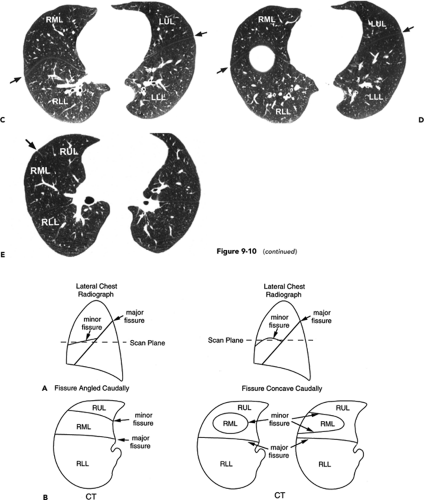 Figure 9-11 Diagrammatic representation of the minor fissure, its orientation relative to the scan plane, and its appearance on high-resolution CT. If the minor fissure often angles caudally (A), the major and minor fissures can have a similar appearance, with the major fissure being posterior and the minor fissure anterior; in this situation, the lower lobe is most posterior, the upper lobe is most anterior, and the middle lobe is in the middle. If the minor fissure is concave caudally (B), the minor fissure can be seen in two locations or can appear ring-shaped or triangular, with the middle lobe between the fissure lines or in the center of the ring, and the upper lobe anterior to the most anterior part of the fissure. RUL, right upper lobe; RML, right middle lobe, RLL, right lower lobe. |
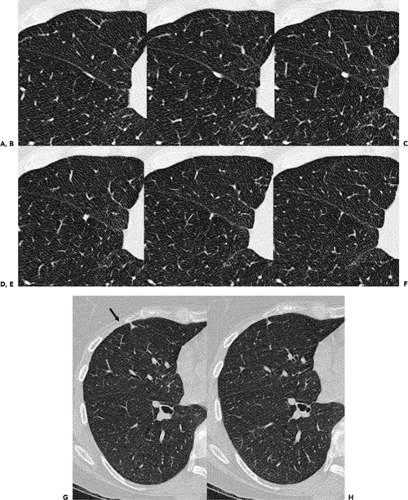 Figure 9-12 Perifissural opacities. A–F: Magnified contiguous 1-mm images through the lower aspect of the right major fissure show typical high-resolution CT appearance of focal fissural nodularity, most likely due to scarring with focal fibrosis. This appearance should not be misinterpreted as a pulmonary nodule. G, H: Magnified views in a different patient from the one in A through F show characteristic triangular scar in the lateral and inferior portion of the minor fissure (arrow in G). Although the fissure itself is not well seen on these images, the configuration and location of this density are characteristic. |
Accessory Fissures
Any segment of lung can be separated from adjacent segments by an accessory fissure; numerous accessory fissures have been identified (38, 39, 40, 41). As many as 50% of lungs show some accessory fissure, although these are rarely of clinical significance.
An azygos fissure and azygos lobe are most commonly seen, occurring in fewer than 0.4% of subjects. The azygos fissure consists of four layers of pleura (two parietal and two visceral), as the azygos vein originates in an extrapulmonary location (Fig. 9-13) (39). The azygos fissure limits the lateral margin of the azygos lobe, which frequently extends well behind the trachea and sometimes the esophagus. The azygos fissure extends from the brachiocephalic vein, anteriorly, to a position adjacent to the right posterolateral aspect of the T4 or T5 vertebral body; it is usually identifiable on CT as a thin, curved line. An azygos lobe represents parts of the apical or posterior segments of the right upper lobe. Although the bronchial supply of an azygos lobe is variable, an apical or anterior subsegmental branch of the apical segment is always present (42).
The inferior accessory fissure separates the medial basilar segment of either lower lobe from the remaining basal segments. It is present anatomically in 30% to 45% of lobes, although it is less commonly seen on CT (Fig. 9-14) (40). It extends laterally and anteriorly from the region of the inferior pulmonary ligament to join the major fissure.
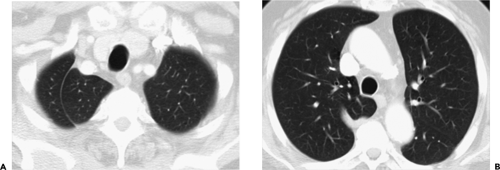 Figure 9-13 Azygos fissure: 5-mm sections. Note that the azygos fissure courses from the lateral aspect of the right brachiocephalic vein anteriorly to the right superior intercostal vein posteriorly. As the fissure contains four pleural layers, it is normally thicker than the two-pleural-layer major and minor fissures—compare with the contralateral major fissure (A). The fissure is thickest inferiorly where the actual azygos vein runs (B). |
Other accessory fissures that have been described include (a) the left minor fissure, anatomically present in approximately 15% of normal lungs, separating the anterior segment of the left upper lobe from the lingula (Fig. 9-15) (41); (b) a left “azygos” fissure, analogous to the more typical right azygos lobe, in which a malpositioned left superior intercostal vein is found (476); (c) the superior accessory fissure, demarcating the superior segment from the remainder of the lower lobes (40); and (d) a rudimentary fissure occasionally identifiable subtending an anomalous cardiac bronchus (Fig. 9-16). Identification of these accessory fissures rarely presents diagnostic difficulties; their recognition is of obvious benefit in identifying pathology related to the fissures (Fig. 9-13), including loculated interfissural fluid collections. Although identification of benign processes involving both normal and accessory fissures is generally straightforward, it is unfortunate that identification of transfissural extension of tumor is more problematic. This is even more pertinent in cases in which fissures are incomplete (Fig. 9-17).
Inferior Pulmonary Ligaments and Phrenic Nerves
The inferior pulmonary ligaments represent reflections of the parietal pleura that extend from just below the inferior margins of the pulmonary hila caudally and posteriorly to the diaphragm, and serve to anchor the lung to the mediastinum (43,44). The ligament can terminate before reaching the diaphragm, or extend over the medial diaphragmatic surface. The inferior pulmonary ligament is often contiguous with the intersublobar septum, dividing the medial from the posterior basal lung segments.
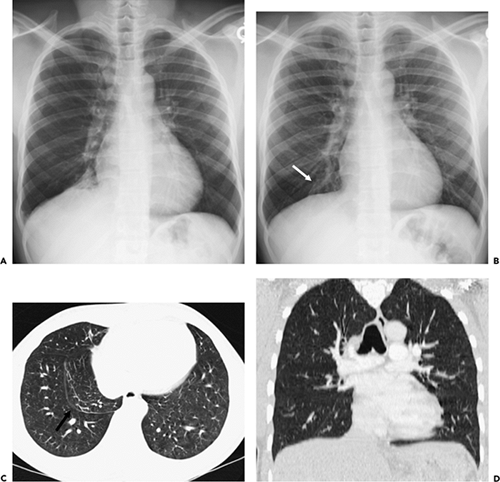 Figure 9-14 Right inferior accessory fissure. Medial basilar segment pneumonia. A: Chest radiograph (CXR) in a febrile patient demonstrates a focus of infective consolidation silhouetting the diaphragm, with a well-demarcated lateral margin. After antibiotic therapy and consolidation clearance, note the typical obliquely oriented inferior accessory fissure demonstrated on repeat CXR (arrow) (B). A 5-mm axial CT (C) with 5-mm coronal multiplanar reconstructions (MPRs) (D) performed for persistent symptoms confirm the typical thin curved fissure line separating the medial basilar segment from the remainder of the basilar segments without residual lung pathology (arrow). |
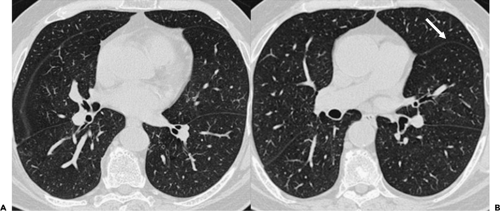 Figure 9-15 Left minor fissure: 1-mm noncontiguous sections demonstrate a left-sided minor fissure (A) analogous to the right minor fissure slightly more inferiorly (B, arrow). Left-sided minor fissures are variable in appearance and frequently incomplete. Their presence may alter the chest radiograph and CT appearances of pathology; in particular, the classic appearances of left upper lobe collapse may become a mirror image of right upper lobe collapse. |
In a review of 100 CT studies using 10-mm sections, Cooper et al. (45) identified at least one of these ligaments in 42% of cases. With 10-mm sections, Rost and Proto (44) could identify the left pulmonary ligament in 67% of cases and the right inferior pulmonary ligament in 37% of cases. It is expected that with use of high-resolution imaging, these ligaments can be identified if desired in nearly all cases. The inferior margins of these ligaments are variable; in their most caudal extension, they may assume a triangular configuration as they reflect onto the diaphragm (Fig. 9-18).
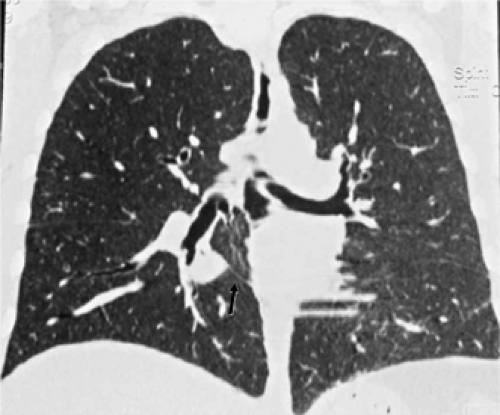 Figure 9-16 Accessory fissure: 5-mm coronal multiplanar reconstruction demonstrates an accessory fissure (arrow) dividing a right lower lobe superomedial rudimentary lobe supplied by an unusually patent cardiac bronchus from the rest of the right lower lobe. The use of multidetector CT has enabled us to visualize many accessory fissures and airways that often have no set defined terminology. (Courtesy of Jane P. Ko, MD, New York University, New York.) |
It should be emphasized that the inferior pulmonary ligaments must be distinguished from the phrenic nerves, which may run nearby (Figs. 9-18 and 9-19). Although the left phrenic nerve generally can be identified as a 1- to
3-mm rounded structure lying adjacent to the pericardium, identification of the right phrenic nerve typically proves more difficult (46). The relation between the right inferior pulmonary ligament and right phrenic nerve has been examined in detail (47). With anatomic specimens, it has been shown that the right inferior pulmonary ligament appears as a thin, high-attenuation line frequently identifiable above or at the level of the diaphragm, usually extending from the region of the esophagus. Accurate identification of the inferior pulmonary ligaments is important, as alterations in the normal appearance of these ligaments typically are produced by pleural effusions, pneumothoraces, and lobar collapse (35,40,48).
3-mm rounded structure lying adjacent to the pericardium, identification of the right phrenic nerve typically proves more difficult (46). The relation between the right inferior pulmonary ligament and right phrenic nerve has been examined in detail (47). With anatomic specimens, it has been shown that the right inferior pulmonary ligament appears as a thin, high-attenuation line frequently identifiable above or at the level of the diaphragm, usually extending from the region of the esophagus. Accurate identification of the inferior pulmonary ligaments is important, as alterations in the normal appearance of these ligaments typically are produced by pleural effusions, pneumothoraces, and lobar collapse (35,40,48).
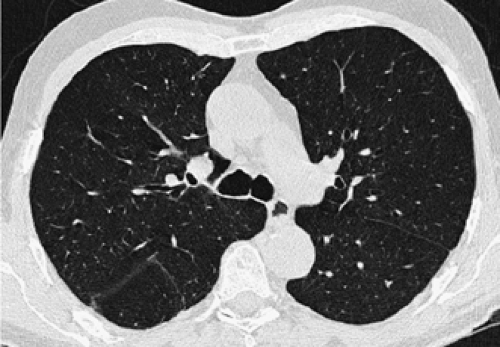 Figure 9-17 Incomplete fissures: CT detection. High-resolution image through the carina demonstrates that the fissures are incomplete bilaterally. A small amount of linear atelectasis is incidentally noted in the superior segment of the right lower lobe. The fissures may be incomplete in 30% to 40% of patients and can account for variations in the spread of both neoplastic and benign disease and their radiographic manifestations. The presence of incomplete fissures is a contributory factor to the maintenance of aeration in lobes whose airways are proximally occluded. |
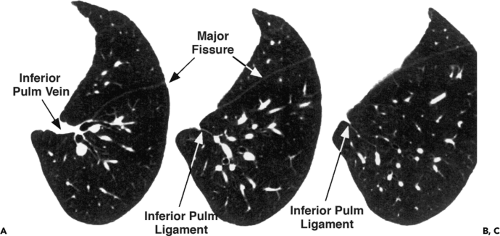 Figure 9-18 A–C: High-resolution CT scans at 1-cm intervals showing the left inferior pulmonary ligament. A: The left inferior pulmonary vein and left major fissure are visible at the most cephalad level. B, C: The left inferior pulmonary ligament is visible as a triangular structure arising immediately caudal to the inferior pulmonary vein. This relation is characteristic. A thin soft tissue septum within the adjacent lung represents the intersublobar septum. |
Pleural Surfaces and Adjacent Chest Wall
A number of structures, arranged in layers, surround the lung and line the inner aspect of the thoracic cavity (Fig. 9-20). Some can be identified on CT, and knowledge of their anatomy is helpful in understanding normal CT findings and the appearances of pleural diseases.
The combined thickness of the layers of visceral and parietal pleura that surround the lung, and the fluid-containing pleural space, is approximately 200 to 400 μm (0.2 to 0.4 mm). The parietal pleura consists of four layers and measures approximately 100 to 200 μm; the visceral pleura is anatomically similar to but somewhat thicker than the parietal pleura (49,50). The width of the pleural space, in studies of frozen thoraces, has been estimated to be 10 to 20 mm (51,52).
External to the parietal pleura is a layer of loose areolar connective tissue, which separates the parietal pleura from the endothoracic fascia. This fatty layer averages 250 μm in thickness in most locations (49,50), but can be markedly thickened over the lateral or posterolateral ribs, resulting in extrapleural fat pads several millimeters in thickness (53,54). The thoracic cavity is lined by the fibroelastic endothoracic fascia (approximately 250 μm in thickness) (49,50), which covers the surface of the intercostal muscles and intervening ribs, blends with the perichondrium and periosteum of the costal cartilages and sternum anteriorly, and posteriorly, and is continuous with the prevertebral fascia, which covers the vertebral bodies and intervertebral disks.
External to the endothoracic fascia are a layer of fatty connective tissue and the three layers of the intercostal muscles. The innermost intercostal muscle (intercostales intimi) passes between the internal surfaces of adjacent ribs and is relatively thin; it is separated from the inner and external intercostal muscles by the intercostal vessels and nerve. Although the innermost intercostal muscles are incomplete in the anterior and posterior thorax, other muscles (the transversus thoraces and subcostalis) can occupy the same relative plane and are considered by some authors to be parts of the innermost intercostal muscles. Anteriorly, the transversus thoracis muscle consists of four or five slips, which arise from the xiphoid process or lower sternum and pass superolaterally from the second to sixth costal cartilages. The internal mammary vessels lie external to the transversus thoracis.
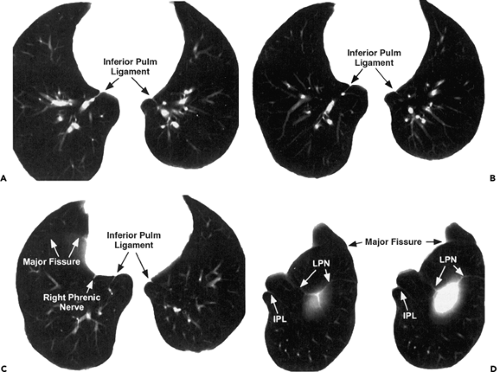 Figure 9-19 Spiral CT in two patients showing the relationsships between the inferior pulmonary ligaments, phrenic nerves, and major fissures. A–C: The inferior pulmonary ligaments arise below the level of the inferior pulmonary veins (A), and extend inferiorly (B and C), lying near the esophagus. The right phrenic nerve (C) results in a similar opacity anterior to the inferior pulmonary ligament, adjacent to the inferior vena cava. The right major fissure is visible more anteriorly. D: In another patient, two adjacent scans through the left lung show the location of the inferior pulmonary ligament (IPL), and the pleural reflections associated with the left phrenic nerve (LPN), just above the left hemidiaphragm. The major fissure is more anterior. |
Posteriorly, the subcostal muscles are thin, variable muscles, which extend from the inner aspect of the angle of the lower ribs, crossing one or two ribs and intercostal spaces, to the inner aspect of a rib below.
Computed Tomography Appearances
On HRCT in normal individuals, a 1- to 2-mm-thick soft tissue density line is visible in the anterolateral and posterolateral intercostal spaces, at the point of contact between lung and chest wall (Figs. 9-21 and 9-22). This line primarily represents the innermost intercostal muscle but also reflects the combined thicknesses of visceral and parietal pleura, the fluid-filled pleural space, endothoracic fascia, and fat layers. Although the pleurae, extrapleural fat, and endothoracic fascia pass internal to the ribs, they are not visible in this location on HRCT unless they are abnormally thickened. Similarly, on conventional CT, a visible soft tissue stripe, internal to a rib, is used to diagnose pleural thickening or effusion.
Normal extrapleural fat can be seen on HRCT internal to ribs in several locations, and can mimic pleural thickening (Fig. 9-23) (7,53,54). The normal layer of extrapleural fat between the parietal pleura and the endothoracic fascia is notably thicker adjacent to the lateral ribs than in other sites (7,53,54). It is most abundant over the posterolateral fourth to eighth ribs and can result in fat pads several millimeters thick, which extend into the intercostal spaces. In normal subjects, these costal fat pads can be difficult to distinguish from pleural thickening or plaques when extended window settings (width, 2,000 HU) are used, but are very low in attenuation and difficult to see with soft tissue window settings. In one study, extrapleural fat could be seen by using extended windows in 12 of 15 normal subjects (7).
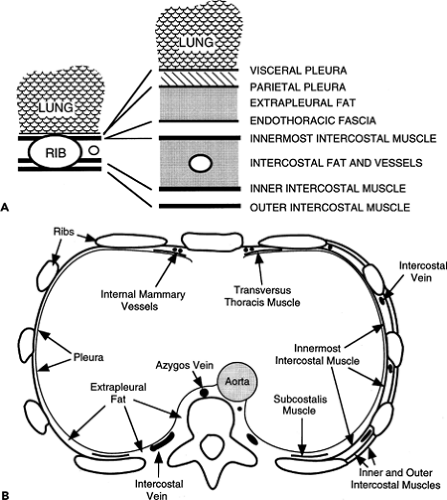 Figure 9-20 A, B: Diagrammatic representations of structures of the chest wall and the pleural surface. All structures internal to the innermost intercostal muscle pass internal to the ribs. |
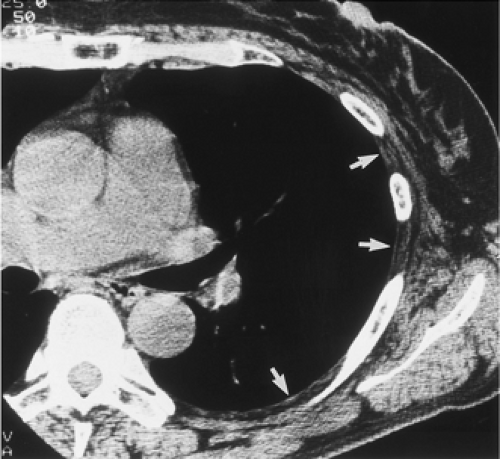 Figure 9-21 Normal CT of the pleural surface and chest wall. On a high-resolution CT scan, a thin line visible in the intercostal spaces (arrows) primarily represents the innermost intercostal muscle, but is also made up of the combined thicknesses of visceral and parietal pleura, the fluid-filled pleural space, endothoracic fascia, and fat layers. Although the pleurae, extrapleural fat, and endothoracic fascia pass internal to the ribs, they are not visible in this location on high-resolution CT unless they are abnormally thickened. |
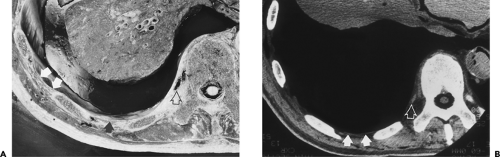 Figure 9-22 CT appearance of the normal pleura and chest wall. A: On a section of a cadaver, the parietal pleura and endothoracic fascia are visible as a white line (white arrows) at the internal surface of the chest wall. The innermost intercostal muscle (black arrow) lies external to these. Although the pleura and fascia pass internal to the ribs, they are not visible in this location on high-resolution CT (HRCT). In the paravertebral regions, the internal intercostal muscle is absent. Intercostal vessels (open arrow) lie within the paravertebral fat. B: HRCT of the cadaver at the same level, photographed by using mediastinal window settings. A 1-mm to 2-mm line (white arrows) at the internal surface of the chest wall, in the intercostal spaces, represents the combined thicknesses of the parietal pleura, endothoracic fascia, and the innermost intercostal muscle. In a paravertebral location, the innermost intercostal muscle is absent, and the combined parietal pleura and fascia are invisible or result in a very thin line. Intercostal vessels (open arrows) are visible within the fat external to the intercostal muscle or fascia. |
The transversus thoracis and subcostalis muscles can also mimic pleural thickening in some patients. Anteriorly, at the level of the heart and adjacent to the lower sternum or xiphoid process, the transversus thoracis muscles are nearly always visible internal to the anterior ends of ribs or costal cartilages (Fig. 9-24) (7). Posteriorly, at the same level, a 1- to 2-mm-thick line is sometimes seen internal to one or more ribs, representing the subcostalis muscle; this muscle is present in only a small percentage of patients (Fig. 9-25) (7). In contrast to pleural thickening, these muscles are smooth, uniform in thickness, and symmetric bilaterally.
Segments of intercostal veins are commonly visible in the paravertebral regions and can mimic focal pleural thickening (Figs. 9-25 and 9-26). Continuity of these opacities with the azygos or hemiazygos veins can sometimes allow them to be correctly identified (7). Furthermore, when viewed by using lung window settings, intercostal vein segments do not indent the lung surface; pleural plaques of the same thickness nearly always will.
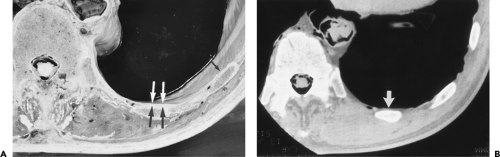 Figure 9-23 Normal extrapleural fat. A: A cadaver section shows a fat pad (large arrows) internal to the posterior rib. More laterally, only a thin white stripe (small arrow) is seen internal to rib, representing the parietal pleura and endothoracic fascia. B: High-resolution CT of the cadaver by using a wide window width. The fat pad (arrow), internal to the most posterior rib segment, is several millimeters thick. Note that fat pads are not visible internal to more lateral ribs. |
Pleural Effusions: Clinical Characterization
Pleural effusions have traditionally been defined as either transudative or exudative (10,55). Transudative effusions result from systemic abnormalities that lead to an imbalance in hydrostatic and osmotic forces, resulting in the
formation of protein-poor pleural fluid (Figs. 9-27, 9-28, 9-29, 9-30). Common causes include congestive heart failure, cirrhosis, and nephrotic syndrome. In distinction, exudative effusions are usually associated with conditions that result either in increased permeability of abnormal pleural capillaries or in lymphatic obstruction with resultant formation of protein-rich fluid (Fig. 9-31). Although the list of causes of an exudative effusion is quite long, most important are those caused by infection and malignancy (55).
formation of protein-poor pleural fluid (Figs. 9-27, 9-28, 9-29, 9-30). Common causes include congestive heart failure, cirrhosis, and nephrotic syndrome. In distinction, exudative effusions are usually associated with conditions that result either in increased permeability of abnormal pleural capillaries or in lymphatic obstruction with resultant formation of protein-rich fluid (Fig. 9-31). Although the list of causes of an exudative effusion is quite long, most important are those caused by infection and malignancy (55).
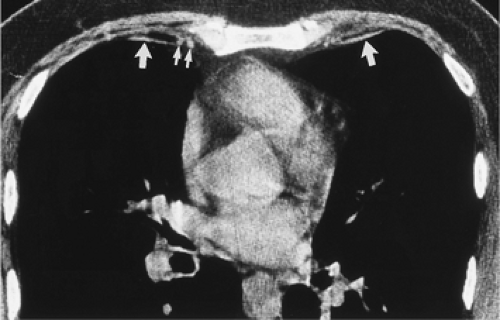 Figure 9-24 High-resolution CT in a normal subject shows the transversus thoraces muscles (large arrows). These lie internal to the innermost intercostal muscles and internal mammary vessels (small arrows). |
Traditionally, differentiation between transudative and exudative effusions has usually required thoracentesis. With original criteria established by Light et al. (56), exudative effusions must meet one of the following criteria: (a) pleural fluid/serum total protein ratio greater than 0.5; (b) pleural fluid lactate dehydrogenase (LDH)/serum LDH ratio greater than 0.6; or (c) pleural fluid LDH greater than two thirds of the upper limit of normal for serum LDH. Transudative effusions are those that do not meet these criteria. With these criteria, although the overall sensitivity has been reported to be as high as 98%, specificity has been reported to be only 82% (55). One cause of lower specificity is that transudative effusions in patients with congestive heart failure may be misinterpreted as exudative, especially after diuresis. Alternative measurements have been evaluated, including quantifying pleural fluid cholesterol and
bilirubin and assessing the serum–pleural fluid albumin gradient; to date, most of these have not proved of routine clinical use (57).
bilirubin and assessing the serum–pleural fluid albumin gradient; to date, most of these have not proved of routine clinical use (57).
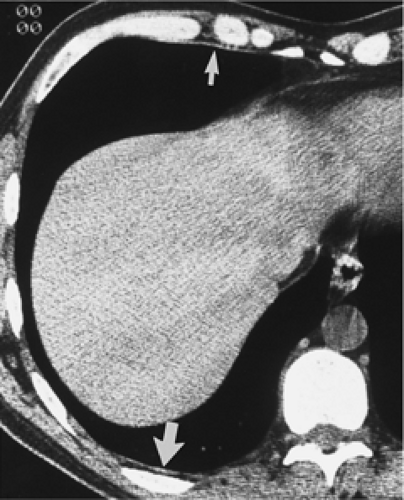 Figure 9-25 Normal subcostalis and transversus thoraces muscles. High-resolution CT in a normal subject at the level of the heart shows a well-defined linear opacity (large arrow), internal to the posterior rib, and separated from it by a fat pad. This represents the subcostalis muscle. Its location and appearance are characteristic. Anteriorly (small arrow), the transversus thoracic muscle is visible passing internal to calcified costal cartilage. Paravertebral vein segments are also seen, joining azygos and hemiazygos veins. |
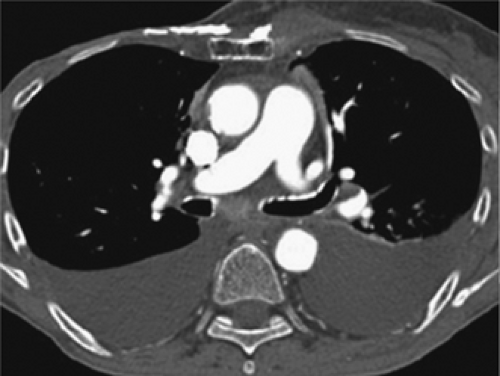 Figure 9-26 Normal enhancing intercostal arteries and veins adjacent to bilateral simple effusions, mimicking pleural enhancement. These structures may be normally visualized along the posteromedial surface of the extrapleural space, most prominently on studies acquired early in arterial enhancement, such as this 2-mm collimation CT pulmonary angiography (CTPA) study with clot in the left lower lobe artery. As opposed to true pleural enhancement, these structures are irregular, discontinuous, and do not indent the pleural surface. |
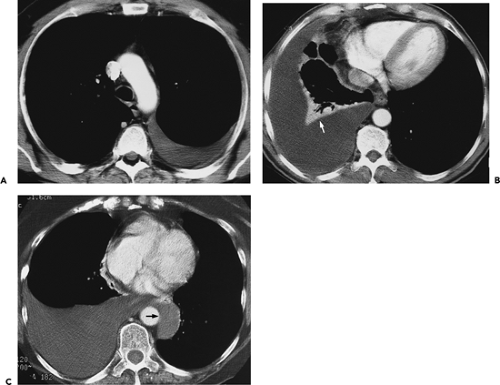 Figure 9-27 Transudative effusions. A: Contrast-enhanced CT shows simple left-sided transudative effusion. Note that neither the parietal nor visceral pleura is thickened and that the effusion has a typically meniscoid configuration conforming to the shape of the posterior pleural space. B: Contrast-enhanced CT in a different patient from the one in A shows a larger effusion, this time causing marked compression atelectasis of the right lower lobe (arrow). Despite the large size of this effusion, again note lack of enhancement of the pleural surfaces, consistent with a transudative effusion. C: Contrast-enhanced CT section in a different patient from that in A or B again shows a large right-sided effusion. In this case, the effusion actually extends to the left hemithorax (arrow), presumably the result of fusion of pleural membranes with resultant direct communication between the right and left pleural spaces. Despite the large size of this effusion, there is no evidence of underlying compression atelectasis (compare with B). Again note lack of evidence of either visceral or parietal pleural thickening in this patient with a transudative effusion. Although an absence of pleural thickening is compatible with either a transudative or exudative effusion (including those associated with metastatic disease), this effectively eliminates an empyema. |
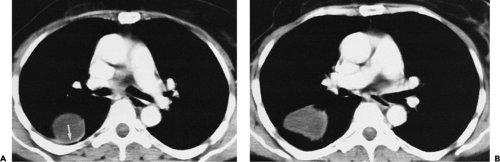 Figure 9-28 Fissural pseudotumor: CT appearance. A, B: Sequential CT scans through the middle thorax show typical appearance of a loculated pseudotumor in the superior portion of the right major fissure. Characteristically, these conform to the expected position of the fissure, the posterior margin of which can be identified superiorly (arrow in A). |
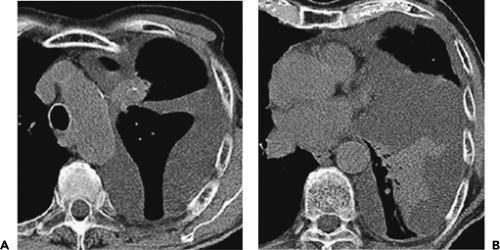 Figure 9-29 Loculated effusions: CT evaluation. A, B: 5-mm unenhanced images in a patient with lung cancer. The presence of discrete pleural collections with intervening areas of normal or thickened pleura without fluid indicates loculation, a feature of exudative effusions. Significant intrafissural or antidependent collections also indicate the complex nature of fluid. CT-guided drainage may be advantageous in these cases to avoid tethered atelectatic lung and guide catheter placement into the largest, most interconnecting locule. |
In addition to being classified as either transudative or exudative, effusions are also defined as either parapneumonic or as an empyema (Fig. 9-32). Parapneumonic effusions are exudative effusions associated with an underlying parenchymal infection, most often pneumonia or a lung abscess, and are further subdivided as either simple or complicated. Complicated parapneumonic effusions are usually defined by one of the following criteria: (a) elevated pleural LDH greater than 1,000; (b) low pH (usually <7.1); or (c) low pleural glucose (<40 mg/dL). In distinction, effusions are considered empyemas only when cultures are positive.
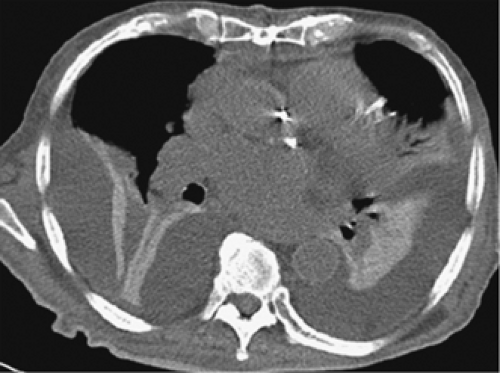 Figure 9-30 Pleural adhesions: CT evaluation. Patient with trans-udative effusions associated with heart failure after valvular surgery. The presence of pleural adhesions does not necessarily indicate an exudative effusion in the absence of pleural enhancement or thickening. In this case, the atelectatic middle lobe and right lower lobe are tethered posteriorly by a pre-existing postinflammatory adhesion, whereas the atelectatic “free” left lower lobe floats on the left effusion. The presence of pleural adhesions may contribute to chronic atelectasis and scarring, including the nonexpanding “trapped” lung that occasionally occurs after prolonged atelectasis. |
The incidence of exudative parapneumonic effusions is dependent to some degree on the infecting organism, ranging from about 10% for pneumonias caused by Streptococcus pneumoniae to more than 50% for those caused by Staphylococcus pyogenes (58). Regardless of the infecting organism, parapneumonic effusions have been noted to follow a natural history. Three stages have been described, each of which is pathophysiologically and therapeutically distinct (59).
Exudative or simple parapneumonic stage. In this stage, an underlying pneumonic process causes inflammation of the visceral pleura, resulting in the accumulation of thin, uninfected pleural fluid, usually the result of increased capillary permeability, with resultant protein loss. A thoracentesis at this stage reveals a simple exudative parapneumonic effusion. Such uncomplicated or simple exudative parapneumonic effusions resolve without drainage, provided that the underlying cause of infection is adequately treated with appropriate antibiotics (10).
Fibrinopurulent or complicated parapneumonic stage. In this stage, large numbers of polymorphonucleocytes (PMNs) and bacteria accumulate in the pleural space, and sheets of fibrin are deposited over the visceral and parietal pleura. As a consequence, a progressive tendency toward fluid loculation exists as fluid resorption is impaired, presumably because of decreased lymphatic drainage (Fig. 9-32).
If the underlying infection is not adequately treated, the pleural fluid becomes infected. Furthermore, there is a tendency for progressive thickening of the extrapleural subcostal tissues to develop as well, presumably secondary to spread of infection and edema to the adjacent chest wall tissues (Figs. 9-32 and 9-33). A thoracentesis performed at this stage reveals features characteristic of a complicated parapneumonic effusion as defined earlier. There is a tendency toward an increasing white blood cell count, decreasing glucose levels, and a decreased pH. Although controversial, in many centers, complicated parapneumonic effusions are treated with immediate closed-tube drainage.
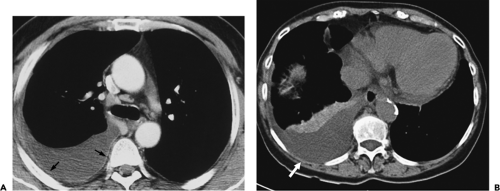
Figure 9-31 Exudative effusion: metastatic breast cancer. A: Contrast-enhanced CT in a patient with known metastatic breast cancer. A right-sided effusion is present, associated with mild thickening and enhancement of the parietal pleura (arrows; compare with Fig. 9-27). Note presence of minimally enlarged mediastinal nodes. The finding of thickened parietal pleura is indicative of an exudative effusion and may be due to an empyema. B: Exudative effusion from metastatic breast carcinoma in a different patient demonstrates that pleural thickening, suggestive of the exudative nature of an effusion, may be apparent on unenhanced images alone, although the sensitivity and specificity of this finding increase with intravenous contrast administration.
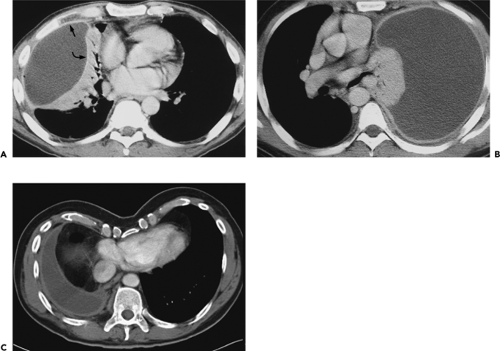
Figure 9-32 Complicated parapneumonic effusions. A: Contrast-enhanced CT section shows loculated right effusion, causing compression atelectasis of adjacent portions of the right middle and lower lobes. In this case, smooth enhancement of both the parietal (arrow) and visceral (curved arrow) pleura gives rise to the so-called “split pleura” sign. Thoracentesis in this case confirmed that this was a complicated parapneumonic effusion requiring tube drainage. B: Contrast-enhanced CT in a different patient from that in A shows similar if more extensive changes than in A. A massive left-sided effusion is present with evidence of uniformly thickened and enhancing parietal pleura. Although thoracentesis in this case was consistent with a simple parapneumonic effusion (pH, 7.32; protein, 5; glucose, 97; and LDH, 432), sputum cultures proved positive for Mycobacterium avium-intercellulare; subsequent pleural biopsy revealed noncaseating granulomas. C: Contrast-enhanced section in a different patient from that in A or B again demonstrates marked pleural thickening and enhancement, resulting in the split pleura appearance. In this patient with an incidental marked pectus excavatum, the chronicity of this empyema is reflected by the presence of extrapleural fat noted not only posteromedially but also most notably centrally over the right hemidiaphragm.
Organizing stage. In this stage, there is an ingrowth of fibroblasts along the fibrin sheets lining the visceral and parietal pleura. The result is pleural fibrosis, which acts as an inelastic membrane trapping the adjacent lung (10). Progression from the fibrinopurulent to the organizing stage may be quite rapid, occasionally occurring in the course of therapy with closed pleural tube drainage. In most cases, however, the organizing phase typically occurs within 2 to 3 weeks after initial pleural fluid formation. Eventually, especially if the infection is inadequately treated, the pleura may calcify, appearing initially as small, punctate foci involving both the visceral and parietal pleura, progressing to form a calcified rind of pleura (Fig. 9-33). Often the result of tuberculous empyema in the past after pneumothorax therapy, tuberculosis of the pleura still remains problematic, even in the era of antituberculous chemotherapy (60,61). Re-gardless of the etiology, with the formation of a fibrothorax, contraction of the involved hemithorax and an expansion of the extrapleural fat occur. The underlying lung can no longer expand. Expansion of the extrapleural fat is especially characteristic and may be accompanied by periosteal changes in the adjacent ribs (Fig. 9-33).
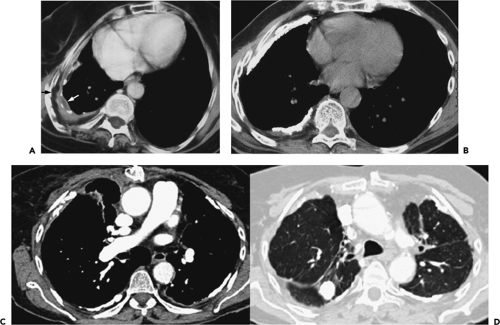 Figure 9-33 Chronic tuberculous empyema. A: Contrast-enhanced section shows thickening and calcification of the pleura associated with marked expansion of the extrapleural space with fat (black arrow). Thickening of the cortex of the adjacent ribs and marked volume loss of the ipsilateral hemithorax are apparent. These findings are all characteristic of chronic pleural and periosteal inflammation, in this case, caused by tuberculosis. Note the small residual collection of fluid within the pleural space (white arrow). This represents a potential source of reactivation. B: Non–contrast-enhanced section in a different patient from that in A shows more extensive pleural calcifications, again associated with pleural thickening and expansion of the extrapleural space with fat. This appearance is also consistent with chronic inflammation, in this case, also caused by prior tuberculosis. C, D: Contrast-enhanced 5-mm sections in a different patient from that in A or B. Bilateral thick rinds of pleural calcification are secondary to prior tuberculous pleural disease (C, mediastinal windows). When bilateral, tuberculous calcific pleural disease may be difficult to differentiate from asbestos-related disease. The presence of upper lobe scarring with a large granuloma helps confirm the postgranulomatous nature of pleural disease (D, lung windows). |
 Figure 9-34 Chronic tuberculous empyema. Contrast-enhanced CT section shows large loculated right-sided effusion with extensive rind of calcification. A discrete fat-fluid level (arrow) can be identified within the pleural space, which can occasionally be identified in patients with long-standing chronic tuberulous empyemas. Note as well the presence of expansion of the extrapleural fat and ipsilateral volume loss, all consistent with chronic inflammation. |
Despite extensive pleural calcification, residual pleural fluid may be identified in a surprisingly high percentage of cases, especially when evaluated by CT (Figs. 9-33 and 9-34) (62). In one study of 140 patients with calcification of both the parietal and visceral pleura, persistent pleural effusions could be identified in 22 (15%) of cases. This finding is especially important, given the propensity for residual infection to result in either a bronchopleural fistula (Figs. 9-35 and 9-36) or a chest-wall infection (empyema necessitatis) (Figs. 9-37 and 9-38) (63). Similar findings have been reported for tuberculous empyemas (60,64).
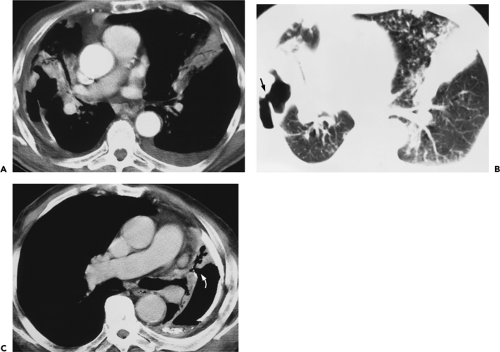 Figure 9-35 Tuberculous empyema—bronchopleural fistula. A, B: Identical sections imaged with narrow and wide windows, respectively, show appearance of chronic loculated tuberculous effusion with calcifications of the parietal and visceral pleural surfaces, expansion of the extrapleural fat, and ipsilateral volume loss. In this case, an obvious bronchopleural fistula, best seen with wide windows (arrow in B), is associated with extensive consolidation of both the middle lobe and left upper lobe. A small left effusion is also present. C: CT section in a different patient from that in A and B also shows evidence of a bronchopleural fistula (curved arrow) appearing in this patient with history of chronic tuberculous empyema. As shown in these cases, there is a propensity for chronic tuberculous empyemas to reactivate, resulting in either a bronchopleural fistula or chest-wall infection (empyema necessitatis; see Fig. 9-37). |
Computed Tomography Evaluation of Complex Pleuro-Parenchymal Disease
CT has been documented to be of considerable value in assessing all aspects of complex pleuro-parenchymal disease (8,11,12,60,61,65, 66, 67, 68). In our experience, CT has been of greatest value in (a) differentiation of pleural from parenchymal disease; (b) characterization of underlying parenchymal disease, including identification of necrotizing pneumonias, lung abscesses, and pulmonary infarcts; (c) characterization of pleural fluid as either free or loculated, as well as characterization of the appearance of the pleural membranes themselves; and (d) assessment and guidance of therapy.
It cannot be overemphasized that optimal evaluation of complex pleuro-parenchymal disease requires the use of a bolus of IV contrast media (Fig. 9-39) (9). Besides allowing
precise localization of fluid collections, intravenous contrast media may enhance both pleural membranes, especially when inflamed, and adjacent lung tissue. In most cases in which suppurative lung disease is present, characteristic patterns of enhancement may be identified, allowing more precise determination of the nature and extent of underlying lung disease.
precise localization of fluid collections, intravenous contrast media may enhance both pleural membranes, especially when inflamed, and adjacent lung tissue. In most cases in which suppurative lung disease is present, characteristic patterns of enhancement may be identified, allowing more precise determination of the nature and extent of underlying lung disease.
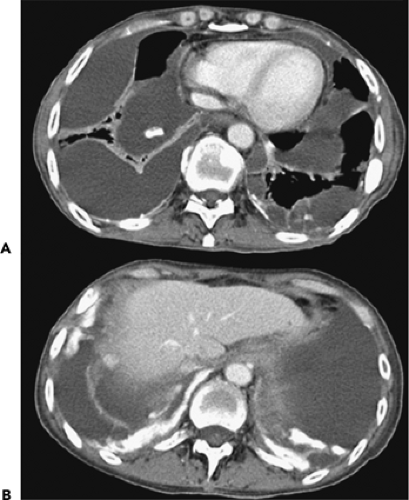 Figure 9-36 Pleurodesis sequela. CT evaluation. A: 5-mm contrast-enhanced CT section in a 45-year-old patient with metastatic breast carcinoma, multiloculated effusions, and underlying pulmonary atelectasis. More inferior CT section (B) demonstrates that multiple high-density areas of residual talc are present. These appearances may mimic prior tuberculous disease but are usually in the dependent pleural spaces and loculations. Unfortunately, distinction from concurrent pleural metastatic disease can become problematic, especially as areas of pleural talc may demonstrate elevated standard uptake values on positron emission tomography examinations for many years. |
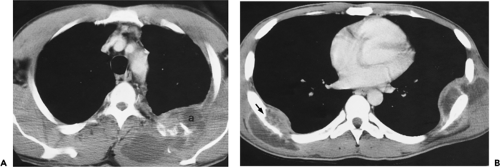 Figure 9-37 Tuberculous empyema: chest-wall infection. A: Contrast-enhanced section shows evidence of extensive lytic destruction of posterior ribs associated with a multiloculated chest-wall abscess (a). B: Contrast-enhanced CT section in a different patient from that in A shows presence of bilateral chest-wall abscesses, again associated with lytic rib destruction on the right side (arrow). Both of these patients proved to have prior pleural disease with evidence of reactivation and extension into the chest wall (so-called empyema necessitatis). In the case illustrated in B, presumably this was associated with hematogenous seeding, resulting in tuberculous osteomyelitis on the right side. |
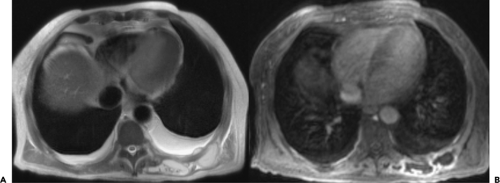 Figure 9-38 Empyema necessitatis: MRI evaluation. The 56-year-old patient with chronic renal failure and immune compromise status demonstrated CT appearances of multiloculated pleural effusions similar to the prior case (not shown). On axial T2-weighted MRI (A) a high-signal-intensity pleural fluid collection is seen with soft tissue elements in the pleura. The collection transgresses the chest wall into the posterior subcutaneous tissues. Rim enhancement of this infected self-decompressing pleural collection is demonstrated on accompanying T1 fat-suppressed gadolinium-enhanced image (B). Unusual to this case, the ultimate etiology proved to be secondary to Aspergillus. |
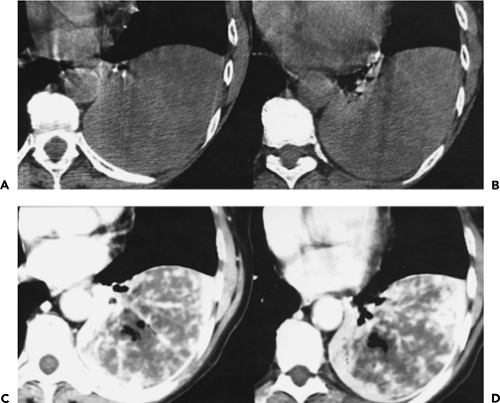 Figure 9-39 Complex pleuroparenchymal disease: role of intravenous contrast administration. A, B: Non–contrast-enhanced sections show apparent uniform soft tissue density throughout the left lower lobe. C, D: Sections obtained at the same level as A and B, after a bolus of intravenous contrast media. Evidence of extensive necrotizing pneumonitis appears throughout the left lower lobe. Contrast within intraparenchymal vessels is easily identified because of the uniform low density of the surrounding lung, a sign of extensive edema and/or necrosis. This case clearly demonstrates the value of contrast enhancement for differentiating pleural from parenchymal disease, as well as a means for further characterizing parenchymal abnormalities when present. |
Differentiation of Pleural from Parenchymal Disease
The role of CT in differentiating pleural from parenchymal disease has been well established (10,11,13,69). Lung abscesses, for example, characteristically appear spherical with an irregularly thick wall and cause little compression of the adjacent pulmonary parenchyma. By comparison, empyemas are usually lenticular with a smooth wall, conform to the shape of the chest wall, and, if sufficiently large, cause compression of the adjacent lung (Fig. 9-40). Unfortunately, not all cases fall into such easily classifiable subgroups. In our experience, in a small but significant percentage of cases, even using strict CT criteria, differentiation between lung abscesses and loculated pleural fluid collections/empyemas may be difficult (Fig. 9-41). In selected cases, of course, both lung abscesses and empyemas may coexist, further complicating interpretation (Fig. 9-42). This differentiation may prove difficult even at surgery. In addition to occasional cases in which empyemas and lung abscesses appear to share similar characteristics, fluid within pre-existing pulmonary cavities also may pose problems. Even the split-pleura sign may be misleading, as fluid within a bulla may have an identical appearance (Fig. 9-5) (17).
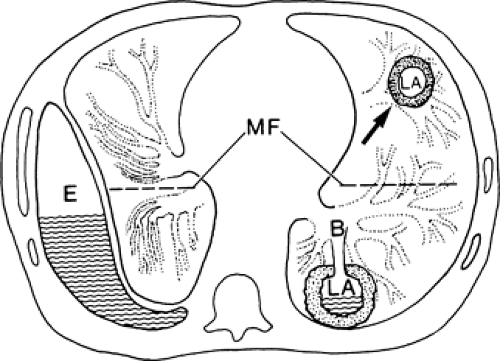 Figure 9-40 CT differentiation between loculated pleural fluid collections/empyemas and lung abscess. Empyemas (E) typically appear lenticular with a smooth wall, conform to the shape of the chest wall, and, if sufficiently large, cause compression of the adjacent lung with displacement of vessels and airways. Unlike infected bullae, empyemas may extend past the margins of the adjacent major fissure (MF). In distinction, lung abscesses (LA) lie within the substance of the lung. Initially, lung abscesses are smooth walled, and before communication either with an airway or the pleural space, contain no air (arrow). At this stage, administration of intravenous contrast may be invaluable, owing to marked enhancement of the abscess wall. Later, after communication with an adjacent bronchus (B), however, abscesses generally cause little displacement of surrounding structures within the lung. Although as drawn, lung abscesses appear to form acute angles with the adjacent pleura and chest wall, in our experience, absence of this sign is unreliable. |
It should also be noted that, rarely, tumor may also mimic the appearance of loculated pleural fluid (Fig. 9-43). The key to diagnosis in these cases is to note the presence of nodularity along the apparent pleural surfaces after contrast enhancement.
Characterization of Underlying Parenchymal Disease
In addition to differentiating pleural from parenchymal pathology, CT offers a unique opportunity to characterize lung disease. Given the spectrum of potential parenchymal causes of parapneumonic effusions, identification of the underlying disease process may have both prognostic and therapeutic value.
CT is especially valuable for identifying lung abscesses. Lung abscesses are part of a spectrum of pulmonary suppurative processes characterized by necrosis and cavitation, most commonly associated with Staphylococcus aureus, Pseudomonas aeruginosa, Klebsiella pneumoniae, and anaerobes (70). The most common pathogenic mechanisms in their development are aspiration of oral flora, necrosis within an antecedent pneumonia, bronchial obstruction, septic emboli, and penetrating trauma. The necrosis and
cavitation that frequently are associated with these infections tend to take several forms. Development of multiple small areas of necrosis, or cavitation within a larger area of necrosis, is generally termed necrotizing pneumonitis (70). By comparison, a lung abscess is characterized by a dominant focus of suppuration surrounded by a containing wall composed of well-vascularized fibrous and granulation tissue (Fig. 9-40), supplied by hypertrophied bronchial arteries. This accounts for the association between lung abscesses and hemoptysis. Although the abscess is initially self-contained, communication is eventually established with nearby airways or with the adjacent pleural space into which the abscess contents are expelled. Rarely, these infections lead to pulmonary gangrene, characterized by still more extensive necrosis with resultant sloughing of lung tissue. As previously discussed, all of these manifestations of pulmonary suppuration are frequently accompanied by parapneumonic effusions or empyema.
cavitation that frequently are associated with these infections tend to take several forms. Development of multiple small areas of necrosis, or cavitation within a larger area of necrosis, is generally termed necrotizing pneumonitis (70). By comparison, a lung abscess is characterized by a dominant focus of suppuration surrounded by a containing wall composed of well-vascularized fibrous and granulation tissue (Fig. 9-40), supplied by hypertrophied bronchial arteries. This accounts for the association between lung abscesses and hemoptysis. Although the abscess is initially self-contained, communication is eventually established with nearby airways or with the adjacent pleural space into which the abscess contents are expelled. Rarely, these infections lead to pulmonary gangrene, characterized by still more extensive necrosis with resultant sloughing of lung tissue. As previously discussed, all of these manifestations of pulmonary suppuration are frequently accompanied by parapneumonic effusions or empyema.
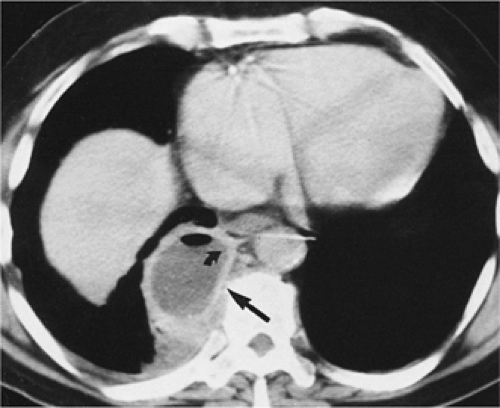 Figure 9-41 Lung abscess versus empyema: limitation in CT diagnosis. Contrast-enhanced CT section through the lower lobes shows a well-defined, smooth-walled fluid collection with a small air-fluid level within marginating the posterior mediastinum on the right (arrow). Despite the suggestion of a split-pleura sign (curved arrow) and the appearance of oblique angles along the margins of this lesion, at surgery, this proved to be a thick-walled lung abscess associated with adjacent pleural thickening but without evidence of an empyema. |
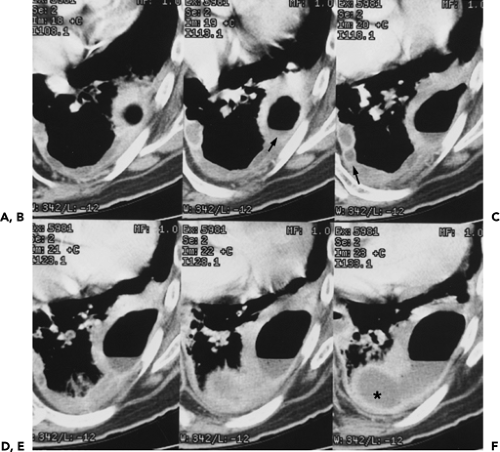 Figure 9-42 CT differentiation: lung abscess versus empyema. A–F: Sequential enlargements of views through the left lung base show findings suggestive of both a lung abscess and empyema. Superiorly a slightly irregular cavity is seen, with an air-fluid level within what appears to be the peripheral portion of the left lower lobe (arrow in B); more inferiorly, however, this cavity merges with what appears to be a loculated pleural effusion with an air-fluid level (asterisk in F). Note that medially, there are multiple small thick-walled fluid collections (arrow in C), which also have features suggestive of both lung abscesses and loculated effusions. In this case, a presumed lung abscess had ruptured into the pleural space, resulting in a large bronchopleural fistula. After therapy with a chest tube, these findings resolved. This case illustrates that despite strict adherence to established criteria, differentiation between lung abscesses and empyemas (especially those associated with a bronchopleural fistula) may be difficult if not impossible. In most of these cases, successful treatment requires that both abnormalities are assumed to be present. |
Each of these forms of suppurative lung disease has a characteristic CT appearance. Lung abscesses are easily recognized as homogeneous areas of low density surrounded by a markedly enhancing wall, usually associated with a smooth inner contour (Fig. 9-44). Because of the presence of hypertrophied bronchial arteries, the wall of most lung abscesses tends to be extremely hypervascular (Fig. 9-45). This is especially the case in patients with superimposed fungal infections. For this reason, optimal evaluation of lung abscesses is accomplished by using a bolus injection of IV contrast, optimally timed to coincide with the early arterial phase of enhancement. After communication with the pleural space or adjacent airways, lung abscesses cavitate; at this time, their walls become thick and irregular (Fig. 9-46). In contrast, necrotizing pneumonitis is characterized by multiple, poorly defined foci of low density, unassociated with enhancing margins (Figs. 9-39 and 9-47). When extensive, this appearance merges with that of
pulmonary gangrene. Although in typical cases, differentiation between patients with lung abscesses and necrotizing pneumonitis is not associated with significant differences in therapy, this differentiation is of importance in those cases for which percutaneous drainage of lung abscesses may be considered (71). CT may also be valuable in detecting complications that may occur within abscesses, including the presence of intracavitary fungus balls. It should be noted that although cavitary lung neoplasms may mimic the appearance of a lung abscess, in most cases, only minimal enhancement of the tumor wall is seen, as compared with lung abscesses, especially in squamous cell carcinomas (72).
pulmonary gangrene. Although in typical cases, differentiation between patients with lung abscesses and necrotizing pneumonitis is not associated with significant differences in therapy, this differentiation is of importance in those cases for which percutaneous drainage of lung abscesses may be considered (71). CT may also be valuable in detecting complications that may occur within abscesses, including the presence of intracavitary fungus balls. It should be noted that although cavitary lung neoplasms may mimic the appearance of a lung abscess, in most cases, only minimal enhancement of the tumor wall is seen, as compared with lung abscesses, especially in squamous cell carcinomas (72).
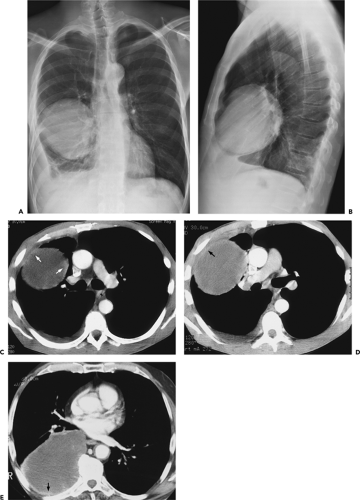 Figure 9-43 Lung cancer mimicking loculated pleural fluid. A, B: Posteroanterior and lateral radiographs show a well-defined mass on the right side, thought possibly to represent loculated fluid within the minor fissure. C, D: Sequential sections show an apparently well defined fluid collection present anteriorly, associated with a small quantity of free pleural fluid posteriorly. This appearance mimics that of a fluid collection within the minor fissure. In retrospect, slight nodular thickening of the “pleural surfaces” is seen (arrows in C and D). After unsuccessful attempts at thoracentesis, this patient underwent an exploratory thoracotomy, at which time, this mass proved to be a necrotic non–small cell lung cancer. E: Contrast-enhanced CT section in a different patient from that in A to D also shows an apparent loculated pleural effusion on the right side. Note again, however, subtle nodular thickening of the “pleura” (arrow). This also proved to be a necrotic non–small cell lung cancer. |
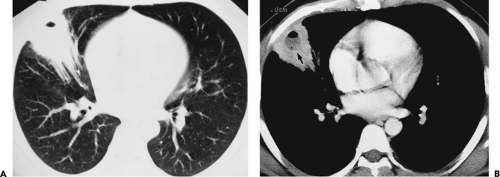 Figure 9-44 Lung abscess. A, B: Identical sections imaged with wide and narrow windows, respectively, after a bolus of intravenous contrast media show characteristic appearance of a lung abscess within a focal area of parenchymal consolidation (arrow in B). |
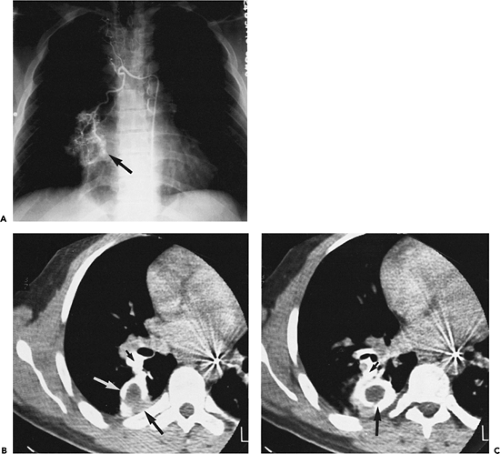 Figure 9-45 Lung abscess: CT demonstration of hypertrophied bronchial arteries. A: Posteroanterior radiograph ob-tained after catheterization of the right bronchial artery. A focal area of hyperemia can be identified on the right, associated with considerable hypertrophy of the distal bronchial arteries (arrow). B, C: Enlargements of sequential sections through the right lower lobe in the same patient. In this case, CT scans were obtained with the catheter still in place within the right bronchial artery, using a slow drip infusion of intravenous contrast media. Hypertrophied bronchial arteries can be identified within the right hilum (small arrows in B and C), leading to a well-defined, smooth-walled fluid collection in the right lower lobe (large arrows). Note that the wall of this lesion is dramatically enhancing, consistent with a bronchial arterial blood supply. Surgically documented lung abscess. |
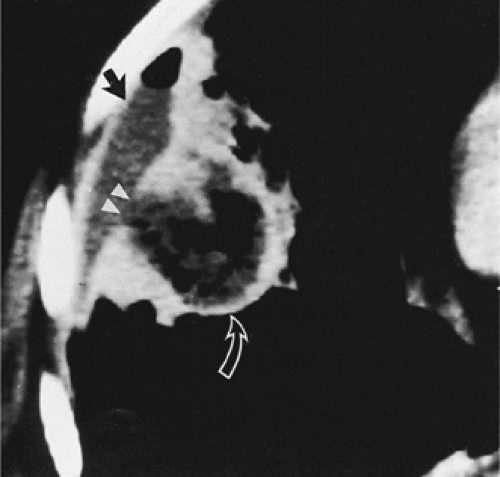 Figure 9-46 Lung abscess: communication with the pleural space. Enlargement of a contrast-enhanced CT section through the right middle lung shows a typical lung abscess (curved arrow). In this case, the abscess is beginning to communicate with the adjacent pleural space (arrowheads), within which a small, loculated pleural fluid collection is beginning to form (straight arrow). Note the presence of air within both the pleural fluid collection and the abscess. (Case courtesy of Peter Nardi, MD, Brooklyn, New York.) |
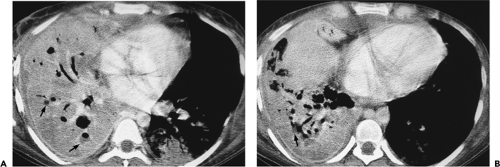 Figure 9-47 Necrotizing pneumonia. A, B: Sequential contrast-enhanced sections show extensive consolidation throughout the entire right lung. Note that the right lung has heterogeneous low density, with scattered small fluid collections easily identified (arrows in A and B) associated with small air-fluid collections. These findings are consistent with a necrotizing pneumonia associated with multiple small “microabscesses.” Vessels are easily identified traversing the right lung (so-called “positive angiogram” sign). Note that only a small quantity of pleural fluid is left after drainage with a pleural tube. The pleural surfaces are clearly enhancing. Both blood cultures and pleural cultures were positive for Streptococcus pneumoniae. It cannot be overemphasized that this appearance is distinctly separate from that seen in patients with compressive atelectasis caused by an effusion in which no underlying infection is found. In these cases, after intravenous contrast enhancement, uniform density is seen throughout the collapsed lung (compare with Figs. 9-27B and 9-32). |
Pleural Effusions: Computed Tomography Evaluation
Free Versus Loculated Effusions
Free pleural fluid has a characteristic appearance when seen in cross section. Fluid typically looks “meniscoid,” occupying the posterior pleural space in patients scanned in the supine position (Fig. 9-27). As effusions increase in size, they conform to the natural boundaries of the pleura. If sufficiently large, effusions usually result in compression atelectasis of the underlying lung (Fig. 9-27); this is not invariable, however, with large effusions often causing minimal, if any, change to the adjacent lung parenchyma (Fig. 9-27). Rarely, direct communication may be identified between the right and left pleural spaces, presumably the result either of congenital communications or after prior surgery (Fig. 9-27). In a surprising number of cases, small effusions may prove difficult to differentiate from pleural thickening and/or fibrosis. In these cases, scans obtained with the patient in the lateral decubitus and/or prone position can be extremely helpful. Fissural pseudotumors are also common and are usually secondary to congestive heart failure (73).
Radiographically, fissural fluid usually is easily identified because (a) the fluid collection lies in the expected region of the fissures; and (b) unless the fissure lies exactly perpendicular to the plane of the radiograph, the margins of the fluid collection appear hazy or poorly defined. These principles apply to the appearance of fluid within fissures on CT (Figs. 9-28, 9-29 and 9-30) (74).
Computed Tomography Characterization
Numerous reports have examined the CT characteristics in patients with pleural effusions (11,75, 76, 77). In an early retrospective evaluation of 48 patients with pleural effusions who had a sonographically directed thoracentesis, Himmelman and Callen (78) found a significant correlation between pleural fluid loculation and exudative pleural fluid chemistries. In addition, patients with loculated effusions tended to have larger effusions and longer hospitalizations, and more frequently required tube drainage. Seven of nine empyemas (78%) and 10 of 28 exudates (36%) were loculated. In 30% of cases, pleural fluid loculation was identified, only by CT in 8%. None of these findings was noted in any patient with a transudative effusion.
Waite et al. (76) reported evidence of pleural thickening after contrast enhancement on CT in nearly all patients with either empyemas or complicated parapneumonic effusions. Among 35 patients with documented thoracic empyema, 30 patients with malignant pleural effusions, and 20 patients with transudative effusions, Waite et al. found that enhancement of the parietal pleura was present in 96% of 25 patients with empyema who underwent contrast-enhanced CT scans. Whereas 86% showed thickening of the parietal pleura, 60% showed thickening of the extrapleural subcostal tissues, and 35% showed increased attenuation of the extrapleural fat (Figs. 9-32 and 9-48) (76). Of 14 patients with complicated parapneumonic effusions, the thickness of the parietal pleura and extrapleural tissues averaged 3 mm and 3.5 mm, respectively, whereas in eight patients requiring decortication, the average thickness of these layers was 4 mm and 4.5 mm, respectively. In distinction, none of these findings were present in the 20 patients with transudative effusions (76).
 Figure 9-48 Complicated parapneumonic effusion. A: Fibrinopurulent stage. Contrast-enhanced CT scan in a patient who had received antibiotics before admission. A moderate-sized right pleural effusion is associated with volume loss and consolidation in the right lower lobe (curved arrow). The parietal pleura is slightly thickened and is clearly enhancing (arrows). Thoracentesis yielded clear pleural fluid without organisms. pH, 6.72; glucose, 22 mg/dL; protein, 5.4 g/dL; LDH, 518 IU; WBC, 3400/mm3 with 70% polymorphonuclear leukocytes. This patient was subsequently successfully treated with closed-tube drainage. B: Fibrinopurulent stage. Contrast-enhanced CT scan in a different patient from that shown in A. A loculated pleural effusion is present on the right side, compressing the adjacent right lower lobe. Marked thickening of both the visceral and parietal pleura (arrows) is present. In addition, there is considerable thickening of the extrapleural subcostal tissues and increased attenuation of the extrapleural fat (curved arrow), presumably secondary to spread of infection or edema to the adjacent chest-wall tissues. |
Aquino et al. (77) also evaluated CT findings in 80 consecutive patients (86 effusions) in whom correlative thoracenteses were performed. Specific CT signs evaluated included evidence of both parietal and visceral pleural thickening (further classified as either focal or diffuse, smooth or irregular), loculation, and evidence of expansion or edema of the extrapleural space. Of 59 proved exudative effusions, 36 (61%) showed evidence of parietal pleural thickening. All cases of empyema (n = 10) and 56% of patients with exudative parapneumonic effusions, including all five patients with complicated parapneumonic effusions, had evidence of parietal pleural thickening. Overall, the specificity of this finding for exudative effusions proved to be 96%, with a corresponding positive predictive value for 97% (77). Also of value was the finding of thickening and increased attenuation within the extrapleural fat, identifiable in 8 of 10 patients with
empyemas. In distinction, the size or shape of effusions did not prove of diagnostic value. Based on these data, Aquino et al. (77) drew the following conclusions: (a) pleural thickening in association with an effusion in a patient with pneumonia indicates the presence of an exudative effusion; and (b) conversely, the absence of pleural thickening makes the likelihood of either a complicated parapneumonic effusion or empyema extremely unlikely.
empyemas. In distinction, the size or shape of effusions did not prove of diagnostic value. Based on these data, Aquino et al. (77) drew the following conclusions: (a) pleural thickening in association with an effusion in a patient with pneumonia indicates the presence of an exudative effusion; and (b) conversely, the absence of pleural thickening makes the likelihood of either a complicated parapneumonic effusion or empyema extremely unlikely.
More recently, in a prospective study of 211 consecutive effusions with documented etiologies, Arenas-Jimenez et al. (11) re-evaluated the ability of CT to differentiate between tranudative and exudative effusions. Similar to previous reports, these authors noted that pleural fluid loculation, pleural thickening, pleural nodules, and increased density in the adjacent extrapleural fat were findings identified only in patients with exudative effusions. Of these, pleural thickening proved to be the most sensitive [sensitivity, 42%; specificity, 100%; positive predictive value (PPV), 100%; and negative predictive value (NPV), 25.8%].
In this same study, when effusions due to proved infection were evaluated separately, only visceral pleural thickening and increased density in the extrapleural fat proved of diagnostic value, with the PPV of both findings of approximately 75%. Visceral pleural thickening was identified in 20% of patients with infectious etiology, similar to findings previously reported by Aquino et al. (77). As is discussed later, this same finding is also seen in patients with malignant effusions, rendering it less significant (69).
Although the thickness of the parietal pleura appears to correlate with the stage of parapneumonic effusions, little correlation is found between this appearance and the ability to predict which patients ultimately will require either chest tube insertion, thoracoscopy, or decortication. In a prospective study of serial CT scans in 10 patients after radiologic catheter drainage of empyemas, Neff et al. (79) found that although the pleura was noticeably thickened 4 weeks after catheter removal in all patients, at 12 weeks, the pleura was essentially normal in four patients and showed only minimal or mild residual pleural thickening in the remainder (79).
Assessment and Guidance of Therapy
In cases in which exudative effusions are the result of infection, differentiation between parapneumonic effusions and empyemas is critical to guide appropriate management. As a general rule, antibiotic therapy is the initial treatment of choice in patients with uncomplicated parapneumonic effusions (67). Although consensus indicates that patients with empyemas require drainage, in the absence of frankly purulent effusions, indications for fluid drainage are less clear. In this setting, pleural fluid pH has usually been the decisive factor, although a precise threshold is still debated, with most investigators using a threshold pH of 7.21 to 7.29, whereas others argue for drainage only for effusions with a pH less than 7.0 (80). Pleural fluid loculation is also cited as a reason for drainage.
The role of CT for distinguishing between simple parapneumonic effusions and empyemas is controversial. Evans et al. (13), for example, argued that CT is not required in the management of most patients with parapneumonic effusions or empyemas, especially when ultrasound is used to confirm the presence and to identify optimal sites for chest tube placement (13). Most other investigators have reported a role for contrast-enhanced CT studies (77), but it should be noted that CT is limited in differentiating between parapneumonic effusions and empyemas. As documented by Arenas-Jiminez et al. (11), although the finding of diaphragmatic, mediastinal, or circumferential pleural thickening in patients with effusions due to suspected infection proves a reliable means for diagnosing empyema, this occurs in a small minority of cases. In distinction, the presence of fluid loculation, thickening of the costal or visceral pleural, or abnormalities involving the extrapleural fat, although suggestive, are seen in patients with both parapneumonic effusions and empyemas. In particular, although costal pleural thickening has been previously reported to occur in between 96% and 100% of cases (76,77,81), in Arenas-Jiminez’ study (11), this finding was identified in only 75% of cases. Similarly, although the finding of increased attenuation of extrapleural fat is often identified in patients with empyemas, these findings are also nonspecific, with sensitivities ranging from 30% to 72% (11,76,77,82), presumably reflecting differences in timing, with CT studies performed earlier in the course of disease being less specific.
In cases for which pleural drainage is indicated, a number of alternative approaches are available, including repeated thoracenteses as well as image-guided percutaneous catheter drainage performed by using fluoroscopy, ultrasound, or CT, as well as video-assisted thoracotomy (VATS) and thoracotomy with drainage or, if indicated, decortication. Choice between these modalities reflects individual practitioners’ experience.
To date, numerous studies have shown an advantage to image-guided catheter placement over blind placement of large-bore chest tubes (67). In addition to ensuring accurate tube placement, image-guided drainage has the additional advantage of directing individual drainage of multiple loculations when present. Although image guidance can be successfully performed by using either ultrasound or CT, ultrasonic guidance has the advantage of being relatively inexpensive and portable, allowing studies to be performed even in intensive care units. However, ultrasound is far more operator dependent than is CT. Furthermore, despite claims to the contrary, CT is far more accurate in detecting underlying lung pathology, as well as in identifying multiple areas of loculation, especially when these are paramediastinal. Additionally, CT is not limited by the presence of bandages, drains, or tubes.
Merriam et al. (83), by using a combination of imaging modalities, retrospectively reviewed the outcome of percutaneous catheter drainage of pleural fluid collections in 18 patients, including 16 patients with documented empyemas, nine of whom had previous unsuccessful surgical chest tube drainage. Twelve (80%) of 15 patients who had an adequate trial of guided drainage were cured. VanSonnenberg et al. (84) reported similar results by using both CT and ultrasound to drain 17 patients in whom previous conventional chest tube drainage had proven unsuccessful. In this study, 15 (88%) of patients were successfully drained, averting the need for open drainage (84). By using fluoroscopic guidance, Westcott (85) successfully drained 11 of 12 patients with documented empyemas; in five of these patients, percutaneous fluid drainage was used as the sole means of drainage (85). Percutaneous catheter placement may also be accompanied by the installation of fibrinolytic agents, including streptokinase, urokinase, or tissue plasminogen activator, with relatively few adverse reactions (86).
CT is of proven efficacy for both directing and assessing the response of patients to therapy. By identifying areas of loculated fluid, CT can be used to guide the appropriate placement of chest tubes in cases for which tube thoracostomy is indicated. In patients with chest tubes, CT can be especially valuable by disclosing chest tubes inadvertently placed within the major fissures or within the lungs, as well as those inadequately positioned to ensure proper drainage (Fig. 9-49) (87,88). In one retrospective study, CT revealed 28 malpositioned chest tubes among 76 chest tubes placed in 54 patients, including 20 intraparenchymal and 3 intrafissural tubes, as well as 5 chest tubes in extrathoracic locations, including 4 in the mediastinum and 1 in the chest wall (66). In distinction, frontal radiographs disclosed malpositioned tubes in none. Similar findings have been documented by Stark et al. (87), who reported, in a study of 26 patients with tube thoracostomies for treatment of empyema, that frontal radiographs were of value in identifying malpositioned chest tubes in only 1 of 21 patients.
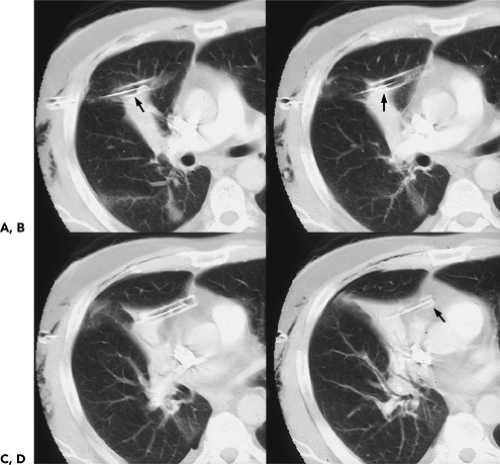 Figure 9-49 Chest-tube placement: CT evaluation. A–D: Enlargements of sequential images in a patient with atelectasis of the middle lobe shows a chest tube entering from the lateral chest wall, traversing the right upper lobe to end with its distal tip in the anterior mediastinal fat (arrows). The clinical significance of such misplacement is variable and relates predominantly to whether functional drainage of pleural fluid or air exists. Despite the apparent intraparenchymal course of many chest drains, significant parenchymal lacerations are unusual. |
CT also can help detect more serious complications of chest tube placement, including significant chest wall hemorrhage (Fig. 9-50). In addition to assessing the adequacy of chest tube placement, CT has also been proven effective in identifying residual changes caused by previous pleural tubes. CT may play an especially important role in the evaluation of patients who have undergone surgical therapy, including thoracoplasties (Fig. 9-51), open drainage procedures including Eloesser window thoracostomies (Fig. 9-52) (89), and even in patients who have been treated with oleothoraces or plombage (Fig. 9-53) (90, 91, 92). It should be noted that in selected cases,
especially in those for whom there is a contraindication for the use of IV contrast media, MR may be of value in differentiating pleural from parenchymal pathology, as well as detecting lung abscesses (Fig. 9-54).
especially in those for whom there is a contraindication for the use of IV contrast media, MR may be of value in differentiating pleural from parenchymal pathology, as well as detecting lung abscesses (Fig. 9-54).
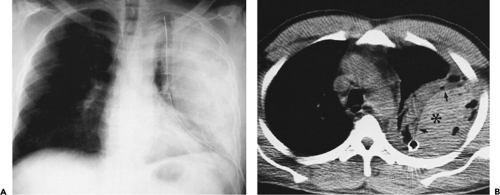 Figure 9-50 Complication of closed chest-tube placement: CT evaluation. A: Posteroanterior radiograph obtained shortly after placement of a left-sided chest tube shows nonspecific increased density on the left, suggestive of a loculated pleural collection. B: Non–contrast-enhanced CT section shows that the pleural tube is displaced medially by a large, high-density, extrapleural fluid collection compressing and displacing the adjacent lung and pleura (arrows and asterisk), consistent with extrapleural hemorrhage. At surgery, these findings were confirmed to be secondary to traumatic injury to an intercostal artery that presumably occurred at the time of chest-tube insertion. |
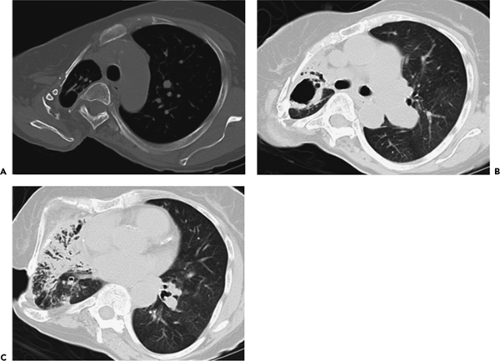 Figure 9-51 Postsurgical assessment: thoracoplasty. 5-mm unenhanced images in a patient after prior thoracoplasty for advanced pleuroparenchymal tuberculosis. The resection of multiple ribs with deformity of the chest and collapse of the ipsilateral hemithorax is best noted on bone windows (A). The patient initially had fevers and weight loss; the presence of advanced bronchiectasis with infective consolidation, including a cavity that was colonized with Aspergillus, is confirmed on corresponding lung windows (B and C). |
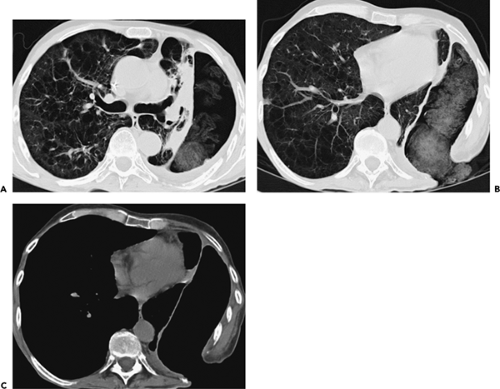 Figure 9-52 Postsurgical assessment: Eloesser window thoracostomy, with 5-mm sections just inferior to the carina (lung windows, A) and at a level in the inferior hemithorax (lung and mediastinal windows, B and C) in a patient after Eloesser flap thoracostomy. The purpose of this procedure is to provide continued drainage of the pleural space in patients with intractable chronic empyemas. Despite the presence of surgically created open communication to the exterior (B and C), the lung does not collapse, largely because of the marked thickening of the visceral pleura with adjacent chronically scarred and atelectatic parenchyma (A and B). Packing material in the pleural space is periodically replaced to absorb pleural secretions. Centrilobular emphysema is noted in the contralateral lung. |
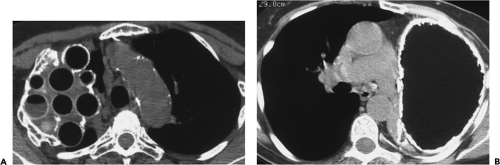 Figure 9-53 Postoperative evaluation: tuberculous empyemas. A: Non–contrast-enhanced CT section shows multiple rounded lucencies within the right hemithorax in a patient previously treated with plombage. Note the marked distortion of the ribs on the right side, consistent with prior thoracoplasty. B: Non–contrast-enhanced section through the middle lung, in a different patient from that in A, shows that the entire left hemithorax is filled with uniform fat density, surrounded by a dense rim of calcification. This is the result of prior oleothorax. Similar to plombage, oleothorax was formerly used in the therapy of tuberculosis and may occasionally still be identified in elderly patients. |
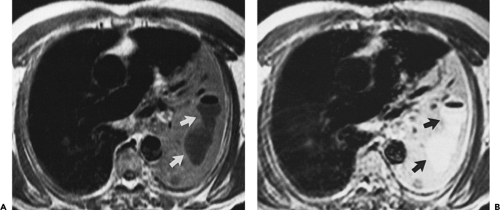 Figure 9-54 Lung abscess: MR evaluation. A, B: T1- and T2-weighted MR scans, respectively, through the mid thorax show extensive consolidation throughout the entire left lung. A well-defined, smooth-walled, fluid-filled cavity can be identified, within which a discrete air–fluid level is seen (arrows in A and B). A central mass is also present, obliterating the left lower lobe bronchus and significantly narrowing the left upper lobe bronchus. In this case, MR clearly discloses the presence of a lung abscess developing distal to a central obstructing lesion. |
Although most investigators advocate the use of closed pleural drainage in the initial management of complicated parapneumonic effusions, adequate treatment of empyemas usually requires surgical intervention. This is especially true in patients in whom initial trials with antibiotics and closed pleural drainage have proved unsuccessful. In one series of 70 patients with thoracic empyemas, closed tube thoracostomy was successful in only 35% of cases, whereas rib resection proved curative in 91% (93). Recently, attention has focused on the use of VATS for both drainage and decortication in patients with empyema (94,95). Advantages cited for VATS compared with open thoractomy are less pain and shorter hospital stays, especially when performed early in the course of infection (76). In one retrospective study, VATS debridement and decortication were successfully performed in 65 of 70 consecutive cases (96). Unfortunately, CT has proved relatively insensitive for predicting the outcome of therapy, especially which patients will ultimately require decortication. The presence of thickened costal pleura in children in particular has proved of limited value, as this may resolve with return of normal lung function when monitored for up to 18 months (97).
Asbestos-Related Pleural Disease
Benign pleural manifestations of asbestos exposure include (a) circumscribed pleural plaques; (b) benign exudative effusions; and (c) diffuse pleural fibrosis (98). Although these may be associated with underlying parenchymal abnormalities, they frequently occur independently (99). Of these, CT has proven most valuable in identifying pleural plaques and diffuse pleural thickening (100, 101, 102, 103, 104, 105, 106). The subject of CT findings in asbestosis is covered in detail in Chapter 8.
Circumscribed Pleural Plaques
Pleural plaques are the most common benign pleural manifestations of asbestos exposure (Figs. 9-55 and 9-56). They occur after a latency period of between 20 and 40 years, and generally are asymptomatic. Presumably these are the result of parietal pleural irritation caused by asbestos fibers protruding from the visceral pleural surface; it has also been hypothesized that fibers could pass from the lung via chest wall lymphatics to the parietal pleura (98). Typically, plaques appear as discrete, elevated, sharply defined foci of pleural thickening up to 15 mm thick (Fig. 9-55) (103,107). Although usually found posterolaterally along the inferior costal margins as well as along the diaphragm, rarely plaques may involve the visceral pleura within fissures (108). Characteristically bilateral, some have observed a distinct unilateral, left-sided predominance (109). Calcifications occur in approximately 10% of plaques (105). These may appear punctate, linear, or occasionally “cakelike,” especially when located along the diaphragmatic surfaces. Less commonly, calcified plaques may be pedunculated, in which case they may be mistaken for intraparenchymal nodules (Fig. 9-56). Histologically, plaques are composed of
predominantly acellular bundles of collagen usually described as having an undulated or “basketweave” configuration (99,109,110). Although plaques have been attributed to other causes, including previous empyema and hemothorax, correlation between the presence of bilateral plaques and asbestos exposure is sufficiently high to warrant defining them as markers of previous dust exposure. A history of asbestos exposure can be elicited in more than 80% of individuals with pleural plaques (99,109,110). Pleural plaques are always benign.
predominantly acellular bundles of collagen usually described as having an undulated or “basketweave” configuration (99,109,110). Although plaques have been attributed to other causes, including previous empyema and hemothorax, correlation between the presence of bilateral plaques and asbestos exposure is sufficiently high to warrant defining them as markers of previous dust exposure. A history of asbestos exposure can be elicited in more than 80% of individuals with pleural plaques (99,109,110). Pleural plaques are always benign.
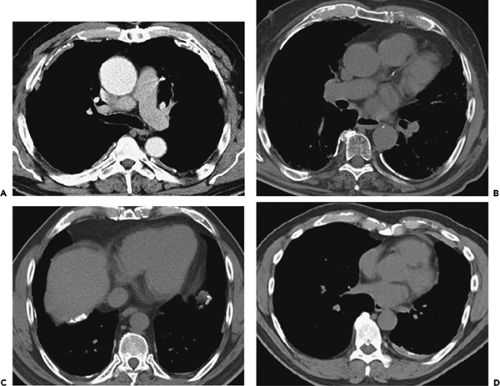 Figure 9-55 Asbestos-related pleural plaque disease: range of appearances using 5-mm axial CT sections with mediastinal windows in four different patients. A: Typical bilateral distribution of disease is demonstrated, including a combination of calcified and noncalcified posteromedial and anterolateral plaques bilaterally. B: Predominantly calcified pleural plaques. Note the presence of extrapleural fat along the posteromedial left hemithorax, indicating the chronicity of the process. C: Calcified pleural plaques along the diaphragmatic pleural surfaces, including the posterior right hemidiaphragm. This region corresponds to the bare area of the liver and therefore in the absence of peritoneum in this region, calcifications identified in this area must be pleural in nature. This feature may be of use in isolated calcifications occasionally noted in this area. D: Unilateral predominantly soft tissue plaques. A unilateral distribution of plaque disease may make the differentiation from postgranulomatous or post-traumatic pleural thickening problematic; however, such unilateral predominance of asbestos-related pleural disease is well described, particularly on the left side. |
Benign Exudative Effusions
Benign exudative effusions generally occur considerably earlier than other pleural manifestations of asbestos-related pleural disease, usually within 10 to 20 years after exposure (98). They may be unilateral or bilateral, and recur in up to 30% of patients. As these effusions are usually nondescript and self-limited, their true incidence is difficult to determine. Epler et al. (111) reported identifying 35 cases (3.1%) of benign asbestos effusion among a survey group of 1135 asbestos-exposed workers (111).
Although the relationship between benign exudative effusions and the subsequent development of malignancy is unclear, it is unlikely that they represent a significant risk factor for mesothelioma (112). Nonetheless, as noted by Gefter et al. (113), extra caution is probably warranted in those individuals with histories of asbestos exposure in whom a benign exudative effusion is identified.
Although the relationship between benign exudative effusions and the subsequent development of malignancy is unclear, it is unlikely that they represent a significant risk factor for mesothelioma (112). Nonetheless, as noted by Gefter et al. (113), extra caution is probably warranted in those individuals with histories of asbestos exposure in whom a benign exudative effusion is identified.
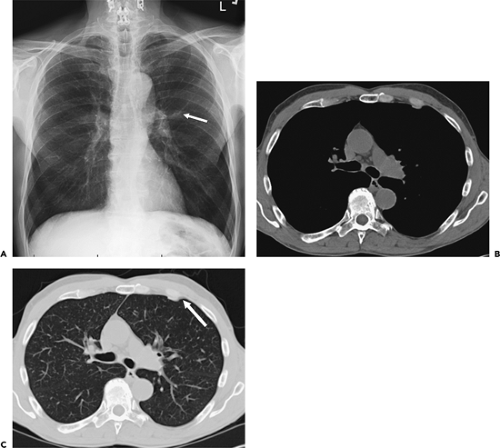 Figure 9-56 Benign pleural plaque mimicking a nodule. A chest radiograph performed in a 55-year-old man as part of a preoperative evaluation for coronary artery disease demonstrated an ill-defined nodule in the left mid lung (A, arrow) that was considered suggestive of a neoplasm. CT performed using 5-mm sections through this region demonstrated no pulmonary abnormality (B). A thin pleural plaque (B and C, arrow in C) accounted for the pulmonary “pseudonodule.” In the absence of chest-wall invasion or the presence of pleural fluid, such plaques are almost always benign. |
Diffuse Pleural Thickening
In addition to pleural plaques and benign exudative effusions, diffuse pleural thickening may also result from asbestos exposure (Fig. 9-57) (98). Radiographic differentiation between these entities may be problematic. McLoud et al. (107) defined diffuse pleural thickening as a smooth, noninterrupted pleural density extending over at least one fourth of the chest wall, with or without costophrenic angle obliteration. Unlike pleural plaques, diffuse pleural fibrosis presumably involves both the visceral and parietal pleural surfaces. The exact mechanism by which this occurs is controversial. It has been postulated that diffuse fibrosis results from an extension of underlying parenchymal disease to involve the adjacent visceral pleura (114). The frequency with which this occurs has been challenged, however. As documented by McLoud et al. (107), in a study of 185 individuals with diffuse pleural thickening, this radio-graphic appearance proved to be the residue of a prior benign asbestos effusion in 31% of cases, and the result of
confluent pleural plaques in 25%. In this study, only 10% of cases with diffuse pleural fibrosis proved to have underlying diffuse parenchymal fibrosis with extension to the visceral and parietal pleura. Differentiation between pleural plaques and diffuse pleural thickening is important, as the latter may be associated with significant alterations in pulmonary function (115,116).
confluent pleural plaques in 25%. In this study, only 10% of cases with diffuse pleural fibrosis proved to have underlying diffuse parenchymal fibrosis with extension to the visceral and parietal pleura. Differentiation between pleural plaques and diffuse pleural thickening is important, as the latter may be associated with significant alterations in pulmonary function (115,116).
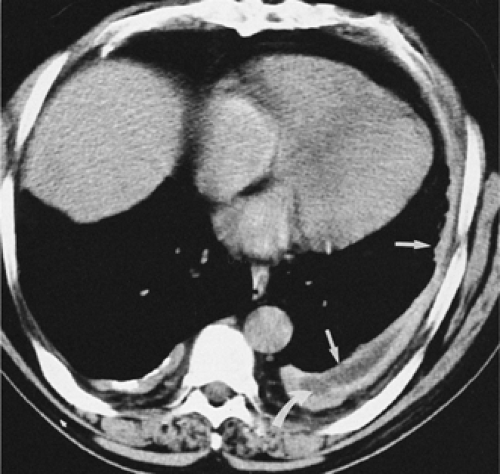 Figure 9-57 Asbestos-related pleural disease: diffuse pleural fibrosis. Enlargement of a CT section through the left lung base shows a markedly thickened pleural rind, associated with marked expansion of the extrapleural fat (arrows). In addition, a small, residual pleural fluid collection is identifiable (curved arrow). The presence of residual fluid suggests the possibility of a mesothelioma; however, pleural aspiration and biopsy showed only dense fibrosis and noninfected nonmalignant fluid. It is probable that with CT, small, residual pleural fluid collections will be recognized more commonly in patients with asbestos-related pleural fibrosis. |
Computed Tomography Evaluation of Benign Asbestos-Related Pleural Disease
As early as the late 1970s, Kreel and Katz (2,117,118) showed CT to be significantly more sensitive than plain radiographs in the detection of asbestos-related pleural disease. In their series of 36 patients with known asbestos exposure, 27 (75%) individuals were found to have abnormal pleural thickening on CT, whereas 24 (66%) individuals had abnormalities detected on chest radiographs (118). In this same series, CT was 50% more sensitive in detecting pleural calcifications than were conventional radiographs.
It is apparent that a significant advantage exists in visualizing the pleural surfaces without superimposition of densities (119,120). Not only does CT allow a more precise assessment of the extent of pleural disease, but in a significant percentage of cases, CT can clarify otherwise indeterminate chest radiographic findings (100,103,121). As documented by Sargent et al. (53), in a study of 30 patients with known asbestos exposure in whom radiographic interpretations were equivocal for the presence of pleural plaques, in 14 (48%) cases, CT confirmed that the changes were caused by increased amounts of subpleural fat (Fig. 9-58) (53). Similar findings have been reported by Friedman et al. (104). In a study of 60 individuals with histories of occupational exposure to asbestos comparing the value of HRCT scans with routine radiographs for diagnosing pleural abnormalities, these authors showed the positive predictive value of chest radiographs to be 79%, compared with a positive predictive value of 100% for HRCT. Of eight cases, false-positive chest radiographs proved to be secondary to extra subpleural fat in seven, and a prominent intercostal muscle in one.
The role of HRCT in the evaluation of benign asbestos-related pleural disease has also been evaluated by Aberle et al. (101). In a study of 29 subjects with histories of occupational exposure to asbestos, pleural thickening was identified in 100% of cases by using HRCT, compared with 93% by using routine 10-mm-thick CT sections. In addition to identifying pleural plaques, CT can be of value by disclosing diffuse pleural fibrosis. Gamsu et al. (105) suggested a useful CT definition of diffuse thickening: a continuous sheet of increased density at least 5 cm broad, 8 to 10 cm long, and more than 3 mm thick. It should be emphasized that care must be taken in assessing pleural thickness, especially when using HRCT. As shown by Im et al. (7), in normal patients, identification of the usually pencil-thin line of the normal pleural surfaces may be obscured, especially in the paravertebral regions, because of a normal increase in the amount of extrapleural soft tissue caused by the incorporation of adjacent intercostal vessels (Figs. 9-21, 9-22, 9-23, 9-26). As a consequence, the diagnosis of diffuse pleural thickening with HRCT requires that abnormalities be identified at several levels, preferably identifiable in other than just the paraspinal region.
Adequate visualization of both pleural and parenchymal changes in asbestos-exposed patients can be achieved with a low-dose technique. As documented by Remy-Jardin et al. (8), no significant differences were observed in the identification of parietal pleural plaques or most findings consistent with parenchymal fibrosis when low-dose (60 to 100 mAs, depending on individual body habitus) images were obtained on a four-detector CT scanner using 4 × 2.5-mm collimation to reconstruct contiguous 5-mm sections. It may be anticipated that similar, if not superior, results can be obtained on newer-generation MDCT scanners, allowing the reconstruction of contiguous 1-mm images while still using low-dose technique.
The appearance of diffuse pleural thickening generally is easily differentiated from mesothelioma. Rabinowitz et al. (122), however, drew attention to a variant of asbestos-related pleural fibrosis that closely mimics the appearance of malignant mesothelioma. In their series of 40 patients with known asbestos exposure, seven had
diffusely thickened, nodular pleural surfaces, indistinguishable from malignant mesotheliomas. None of these patients, however, had evidence of malignant transformation detected by multiple biopsies or by surgery. The significance of this type of fibrosis has yet to be established, as long-term follow-up studies of these patients were not undertaken (Fig. 9-57).
diffusely thickened, nodular pleural surfaces, indistinguishable from malignant mesotheliomas. None of these patients, however, had evidence of malignant transformation detected by multiple biopsies or by surgery. The significance of this type of fibrosis has yet to be established, as long-term follow-up studies of these patients were not undertaken (Fig. 9-57).
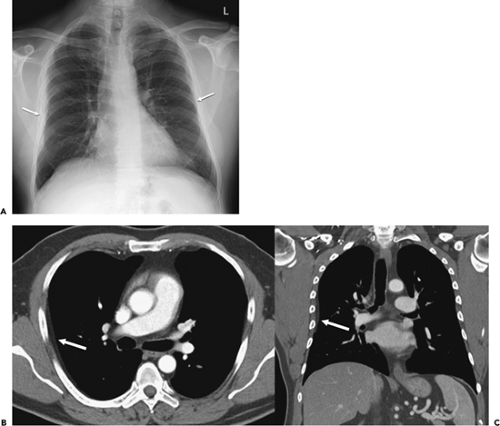 Figure 9-58 Prominent extrapleural fat: CT evaluation. Chest radiograph initially interpreted as demonstrating pleural thickening (arrows; A) in a patient with asbestos-exposure history. The 5-mm axial images after intravenous contrast (B) and 3-mm coronal multiplanar reconstruction (C) demonstrate that the finding is due to extrapleural fat, asymmetrically prominent on the right side (arrows). The presence of extrapleural fat should be considered when the apparent chest radiographic thickening is bilateral, most marked in the middle third of the hemithorax without effusions or costophrenic angle involvement. The presence of notable subcutaneous body fat and male gynecomastia, not prominent in this case, are ancillary supporting findings. |
Round Atelectasis
A variety of terms, including folded lung, atelectatic pseudotumor, shrinking pleuritis with atelectasis, pleuroma, and round atelectasis (the most commonly used descriptive), refer to what is most often a manifestation of asbestos-related parenchymal and pleural disease (123). First described in this century, round atelectasis has been recognized with increasing frequency, especially with increasing use of CT to evaluate asbestos-exposed patients (103,105). Radiologically, round atelectasis usually is an incidental finding on routine chest radiographs (Figs. 9-59 and 9-60) (124,125). A distinct preponderance in men has been identified (126). Typically, conventional radiographs reveal a sharply defined pleural-based mass, ranging between 2 and 7 cm in size, usually located posteriorly in the lower lobes adjacent to an area of pleural thickening. Air bronchograms may be present within. Characteristically, the mass is associated with vessels and bronchi that have a curvilinear appearance, coursing like a comet tail toward the hilum. These findings are associated with focal volume loss and often with hyperlucency of adjacent lung segments.
Stay updated, free articles. Join our Telegram channel

Full access? Get Clinical Tree


