Pharmacology
Jonathan B. Wagner
Gregory L. Kearns
Michael Artman
Introduction
The use of drugs for patient treatment carries a single therapeutic imperative: namely, selecting the best drug and administering it in a dosing regimen that is predictive of efficacy and safety. While a “one size fits all” approach to drug dosing in adults is the norm, pediatrics represents the exception whereby development requires that drug dosing be individualized. A safe, therapeutic drug regimen for children must account for the impact of ontogeny and other factors which contribute to variability in the exposure–response relationship.
Human development represents a continuum of biologic events which includes somatic growth, neurobehavioral development, and eventual reproduction. During the process of maturation over the first 15 years of life, profound physiologic changes occur in a variety of processes that can alter both drug disposition and action (1). Moreover, during the first 2 years of life, many of these changes are dynamic and their association with body size can be nonlinear; a situation which precludes the use of fixed (i.e., age-independent) drug–dosing regimens and in some instances, the application of simple allometric scaling to predict age-appropriate drug dose. Therefore, safe and effective drug therapy for children requires a fundamental and integrative understanding of how ontogeny contributes to the other factors (e.g., genetic constitution, the role of environment, the impact of concomitant disease, and its treatment) capable of influencing both drug disposition and action and thereby, the relationship between drug dose, concentration, effect, and efficacy. Such considerations collectively represent the essence of pediatric clinical pharmacology. A sound understanding of basic pharmacology principles is necessary for facilitating individualization of drug treatment in infants, children, and adolescents.
Over the past 30 years, pediatric clinical pharmacology has evolved from an area of research emphasis/focus within pediatrics to a sub-discipline of clinical pharmacology with demonstrated therapeutic importance to the medical care of pediatric patients. The large amount of knowledge generated in the field of pediatric clinical pharmacology during this time precludes the presentation of a comprehensive, content-based review, or treatise in this chapter. Rather, it is our intention to provide the reader with a “primer” on pediatric clinical pharmacology and in particular, its relationship to the practice of pediatric cardiology through a presentation of fundamental principles and their illustration using relevant therapeutic examples. We also present summary information pertaining to the clinical pharmacology of drugs commonly used in pediatric cardiology. Collectively, this will equip the reader with a solid foundation for further inquiry and also, provide a fundamental, conceptual framework upon which sound therapeutic decision making in pediatric cardiology can be based.
Common Definitions of Terms in Clinical Pharmacology
As is the case with many disciplines, clinical pharmacology has its own lexicon, an understanding of which is fundamental to the clinical application of its principles to therapeutic decision making. The following paragraphs represent a glossary of common terms in clinical pharmacology, each of which is accompanied by a conceptual summary derived from information contained in a recent textbook (2).
Absolute bioavailability (F) is the fraction of a drug dose administered by an extravascular route which is absorbed into the systemic circulation. It is determined within a given individual by comparing the area under the plasma concentration versus time curve (area under the curve [AUC]) following an oral dose of the drug to that resulting from an intravenous dose (where bioavailability is generally 100% given that no absorption occurs).
Relative bioavailability is similarly determined by comparing the AUC following extravascular administration of a “test” formulation and a “reference” drug formulation (e.g., comparing the AUC from an extemporaneously formulated liquid to that from a marketed oral solid dosage form of a given drug).
Absorption of drugs describes the process of drug uptake from a site of extravascular administration (e.g., oral, intramuscular, subcutaneous, intraperitoneal, intraosseous, intratracheal, etc.) into the systemic circulation. The majority of drug absorption occurs via passive diffusion although for some compounds, carrier-mediated and/or active transport (e.g., via a transporter such as P-glycoprotein) can occur. As a drug must generally exist in a true solution to be absorbed, liberation of the active drug from a drug product (e.g., release of a calcium channel blocker from a sustained-release dose formulation) can be a rate-limiting event for absorption. Drug absorption is most accurately conceptualized by considering both rate (e.g., absorption half-life, time to peak concentration) and extent (e.g., bioavailability), either of which can be influenced by biopharmaceutical (e.g., drug formulation), physicochemical (e.g., pH, solubility, hydro- and lipophilicity, protein binding, complexation characteristics with food or drugs, etc.), and physiologic factors (e.g., barrier integrity, motility, volume and pH of body fluids at absorptive site, protein-binding capacity, degradation/biotransformation potential, etc.).
Area under the curve is a concentration and time-dependent parameter which reflects systemic exposure to a drug. Mathematically, AUC represents the integral of drug blood levels over time from zero to either a pre-determined post-dose time point (i.e., AUC0→tx) or extrapolated to infinity (i.e., AUC0→∞) which is done by using the apparent terminal elimination rate constant (similarly calculated from the observed plasma concentration vs. time plot) (Fig. 82.1).
Bioequivalence of a drug product reflects an assessment of whether one drug formulation (e.g., a generic drug) produces a rate and extent of absorption that is comparable to that of the reference formulation. It assumes that effect and toxicity profiles of the two drugs will be virtually identical if the systemic exposures (as determined from AUC) are comparable. The determination of bioequivalence as defined in current regulatory guidelines is purely pharmacokinetic in nature in that it does not involve a relative assessment of drug effect from a given drug product and/or dose.
Clearance (Cl) of a drug is conceptually represented by the volume of blood from which a certain amount of un-metabolized drug is removed (i.e., cleared) per unit time by all pathways capable of
drug removal (e.g., renal, hepatic, biliary, pulmonary). Clearance is generally represented as either total body (or plasma) clearance, renal clearance (Clren) or nonrenal clearance (Clnr). The calculation of Cl is made from knowledge of the AUC and for Clren, from knowing the total amount of drug excreted unchanged in the urine over a 24 or more hour period. For drugs administered by any extravascular route, Cl yields an “apparent” value (e.g., Cl/F) which must be corrected for the extent of absolute bioavailability. Finally, it should be noted that Cl can be influenced by ex vivo procedures (e.g., extracorporeal membrane oxygenation, dialysis [hemodialysis, peritoneal dialysis, continuous hemofiltration with dialysis]).
drug removal (e.g., renal, hepatic, biliary, pulmonary). Clearance is generally represented as either total body (or plasma) clearance, renal clearance (Clren) or nonrenal clearance (Clnr). The calculation of Cl is made from knowledge of the AUC and for Clren, from knowing the total amount of drug excreted unchanged in the urine over a 24 or more hour period. For drugs administered by any extravascular route, Cl yields an “apparent” value (e.g., Cl/F) which must be corrected for the extent of absolute bioavailability. Finally, it should be noted that Cl can be influenced by ex vivo procedures (e.g., extracorporeal membrane oxygenation, dialysis [hemodialysis, peritoneal dialysis, continuous hemofiltration with dialysis]).
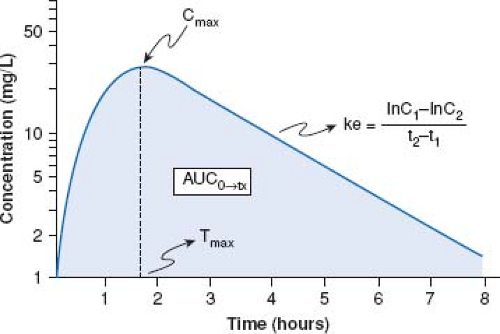 Figure 82.1 Representative plasma concentration versus time curve. Illustrated are commonly referenced pharmacokinetic parameters including AUC, area under the curve; Cmax, maximal plasma drug concentration; ke, the apparent first order elimination rate constant and Tmax, the time to achieve apparent peak plasma concentrations. (From Abdel-Rahman SM, Kearns GL. The pharmacokinetic-pharmacodynamic interface: Determinants of anti-infective drug action and efficacy in pediatrics. In: Feigin RD, Cherry JD, Demmler-Harrison GJ, Kaplan SL, eds. Feigin and Cherry’s Textbook of Pediatric Infectious Disease. 6th ed. Philadelphia, PA: Saunders-Elsevier; 2009:3158.) |
Disposition refers to the collective processes of drug absorption, distribution, metabolism, and excretion/elimination, all of which occur simultaneously after drug administration as opposed to being discrete events. Pharmacokinetic behavior for a given drug is a common surrogate for disposition in that the concentration versus time profile for a given drug is determined by the aforementioned processes.
Elimination half-life (T½) is defined as the time following drug absorption required for blood or plasma drug concentrations to be reduced by 50%. It is calculated from the apparent elimination rate constant (ke) which is the slope of the apparent drug elimination phase from blood/plasma (see Fig. 82.1). While T½ is frequently considered as a “surrogate” for Cl, it should be noted that it is dependent both upon Cl and the apparent volume of distribution. Practically, T½ is an important pharmacokinetic parameter in that it can be used to predict when steady state drug concentrations are attained (e.g., steady state reached at a time equal to four to five times the T½ following the initiation of drug treatment or a change in dose/dosing regimen) or alternatively, when a drug should be eliminated from the body (e.g., 75% elimination in a period equal to three times T½).
Peak concentration (Cmax) represents the highest concentration of drug attained in a particular biologic fluid following the administration of a drug dose. As illustrated in Figure 82.1, Cmax occurs at a corresponding post-dose time (Tmax) which temporally reflects the time required for drug absorption following a dose administered by an extravascular route.
Pharmacodynamics of a drug reflects a relationship between drug exposure (i.e., concentration), time, and drug effect (both intensity and duration). Simply stated, pharmacodynamics is a reflection of what a given drug/dose does to the body and the association of the effect(s) with time of drug administration. In the context of clinical pharmacology, pharmacodynamics refers to the exposure–response (i.e., concentration–effect) relationship for a given drug.
Pharmacokinetics reflects a quantitative approach used to describe the movement of a drug throughout the body and also, concentrations (or amounts) of drug which reside in a given body space (e.g., fluid spaces, tissue, etc.). Pharmacokinetics is conceptualized by considering those characteristics which are the determinants of drug disposition.
Pharmacogenetics can be defined as the study or clinical testing of variations of specific genes that impact upon either the pharmacokinetics and/or pharmacodynamics of a given drug. In contrast, pharmacogenomics represents a focus on events at the level of the genome (e.g., gene–gene interaction) and how, in an integrated context, genetic constitution contributes to the variability in the exposure–response relationship.
Presystemic clearance (first-pass effect) occurs when a drug is either catabolized (e.g., through chemical degradation) or metabolized before it reaches the systemic circulation. Examples associated with oral drug administration include the pH-sensitive degradation of specific drugs in the stomach, drug biotransformation by enterocytes, enteral drug translocation by transporters, enterohepatic drug recirculation. Presystemic drug clearance can also occur ex vivo (e.g., drug degradation and/or adsorption to tubing associated with cardiopulmonary bypass, extracorporeal membrane oxygenation). Drugs subject to first-pass effect (a classic example is propranolol) generally have a reduced rate and/or extent of relative bioavailability when compared to that achieved with parenteral administration.
Protein binding results when a drug combines with plasma, extracellular, or tissue proteins to form a reversible drug–protein complex. In general, drug–protein binding is usually nonspecific and depends on the drug’s affinity for the protein molecule (i.e., binding site), the number of protein-binding sites and the drug and protein concentration. With few exceptions, drugs that are bound to proteins are pharmacologically inactive and cannot be readily metabolized and/or excreted. Protein and/or tissue drug binding can also influence both the apparent volume of distribution and elimination T½ of drugs that are extensively (i.e., >70%) bound, as well as their concentration–effect profiles (e.g., extent of plasma protein binding for amiodarone = 93% to 97%, sildenafil = 96%, warfarin = 99%).
Steady state reflects a level of drug accumulation in blood and tissue upon multiple dosing when the rate of input (i.e., the amount of drug placed into the systemic circulation) and output (i.e., drug clearance) are at equilibrium. When drugs are given at fixed doses and dosing intervals, the steady state concentrations in blood or plasma fluctuate between a maximum (Cmax) and minimum (Cmin) within a given dose interval. The inter-dose values of Cmax and Cmin should be identical provided that dose size, method of drug administration, dosing interval, and/or drug pharmacokinetics do not change between doses. In general, the pharmacokinetics of a drug at steady state provides the most accurate means to assess drug effect(s) given that a proportional equilibrium between drug concentrations in the plasma and those at the effector sites(s) (i.e., receptors) should exist.
Therapeutic range represents a range of plasma drug concentrations (i.e., systemic exposure) associated with desirable therapeutic effect(s) and absent or minimal adverse effects. It may be influenced by factors that can modulate pharmacodynamics (e.g., age, disease, concomitant drugs, environmental exposures). Generally, the therapeutic range for a given drug is determined from studies conducted in adults. Thus, it can vary in children consequent to either developmentally related alterations in pharmacokinetics and/or pharmacodynamics. The therapeutic index for a given drug reflects the relationship between the systemic exposure associated with desirable effects versus that associated with the production of adverse effects. For drugs with a narrow therapeutic index such as digoxin, the difference between the systemic exposure (plasma levels) associated with therapeutic and adverse effects is small.
Trough drug concentrations (Cmin) represent those concentrations in plasma which occur immediately prior to a scheduled dose
for drugs that are administered in repeated dosing regimens. The inter-dose excursion between Cmax and Cmin is a reflection of systemic drug exposure and in some instances, is associated with a “target” dosing strategy (e.g., cases where a specific plasma drug concentration or AUC is associated with a desired pharmacodynamic effect).
for drugs that are administered in repeated dosing regimens. The inter-dose excursion between Cmax and Cmin is a reflection of systemic drug exposure and in some instances, is associated with a “target” dosing strategy (e.g., cases where a specific plasma drug concentration or AUC is associated with a desired pharmacodynamic effect).
Volume of distribution (apparent volume of distribution) represents a hypothetical volume of body fluid that would be required to dissolve the total amount of drug at the same concentration as that found in the blood. For drugs that do not distribute extensively or associate with great affinity to proteins and/or tissue, the VD may dimensionally correspond to a physiologic/anatomic body spaces (e.g., VD <0.1 L/kg ∼ intravascular space, 0.1 to 0.3 L/kg ∼ extracellular space, 0.6–0.7 L/kg ∼ total body water space). An apparent VD of >1 L/kg is suggestive of drugs with significant tissue binding (e.g., digoxin) which can influence its residence time in the body. Following extravascular drug administration, the apparent VD is impacted by the extent of drug absorbed (i.e., VD/F). In those instances where a drug has incomplete absorption, it may underestimate the true value of the VD.
The Exposure–Response Relationship
Drug action results only when an exposure (both extent and duration of) occurs that is sufficient to translate a drug–receptor interaction into a physiologic response. Thus, the exposure–response relationship for a given drug represents an interface between pharmacokinetics and pharmacodynamics that can be conceptualized by simultaneous consideration of two profiles: (a) plasma concentration versus time (Figs. 82.1 and 82.2) and (b) plasma concentration versus effect (Fig. 82.2).
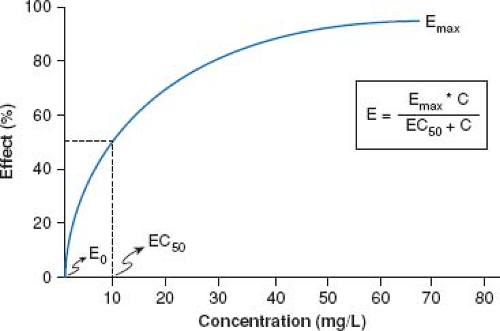 Figure 82.2 Representative nonlinear concentration (C) versus effect profile. Illustrated are Emax, maximal effect; E0, the baseline effect associated with the absence of drug concentration and EC50, the concentration which is associated with an observed effect that is 50% of Emax. (From Abdel-Rahman SM, Kearns GL. The pharmacokinetic-pharmacodynamic interface: determinants of anti-infective drug action and efficacy in pediatrics. In: Feigin RD, Cherry JD, Demmler-Harrison GJ, Kaplan SL, eds. Feigin and Cherry’s Textbook of Pediatric Infectious Disease. 6th ed. Philadelphia, PA: Saunders-Elsevier; 2009:3158.) |
In the vast majority of instances, the relationship between drug concentration and effect is not linear. As illustrated in Figure 82.2, in the absence of drug in the body (i.e., at a concentration of zero), there is no discernable drug effect (E0). Following drug administration, the concentration (both in the plasma and by inference, also at the receptor) increases as does the effect; first in an apparent linear fashion (at low drug concentrations) followed by a nonlinear increase in effect to an asymptotic point which reflects the maximal effect (Emax) after which, further increases in drug concentration are not associated with an increase in the desired drug effect. The drug concentration corresponding to 50% of the maximal effect is defined as the EC50 (Fig. 82.2); a pharmacodynamic term reflective of drug potency that is used to compare concentration–effect relationships between individuals and in some instances, between drugs in a given drug class. With rare exception, both Emax and EC50 are rarely determined during therapeutic drug administration but rather, are calculated pharmacodynamic parameters from research aimed at characterizing the dose–concentration–effect relationship. For example, when plasma drug concentration versus effect data are plotted, a negative hysteresis often results which is a consequence of the delay between peak plasma concentrations and peak drug effect. The Sigmoid-Emax model (based on the Hill equation) is most often used to derive important pharmacodynamic parameters (Emax, EC50) from concentration versus effect data.
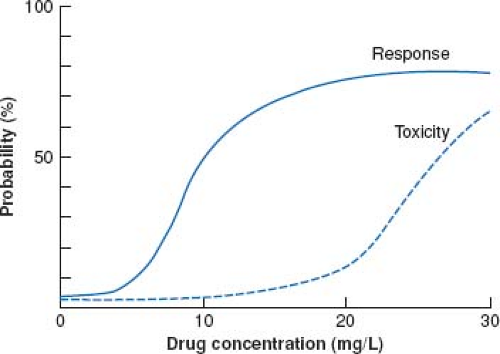 Figure 82.3 Relationship between drug concentration and drug effects for a hypothetical drug. (From Evans WE, ed. General principles of applied pharmacokinetics. Applied Pharmacokinetics. 3rd ed. Vancouver, WA: Applied Therapeutics; 1992:1–3.) |
Another consideration in pharmacodynamics deals with the relationship between drug concentration (in the plasma and by inference, at the receptor) and toxicity. When the dose of a given drug is escalated, the dose versus response curve shifts to the right. As with therapeutic effect, a toxic drug response has its own dose versus response curve. This is illustrated by Figure 82.3 which represents the intersection between the dose versus concentration and dose versus toxicity curve. For some drugs (e.g., phenytoin, tricyclic antidepressants, selective serotonin re-uptake inhibitors, statins), toxic effects are an extension of effect when a drug acts at a single receptor. It should be recognized that there are drugs which act on multiple receptors. This is exemplified by the opiate analgesics where the concentration versus effect curve for analgesic effects and that for the respiratory depressant effects are different and modulated by two distinct receptors. A clinical example of this later situation is seen with the rapid onset of respiratory depression after dose escalation of opiates as tolerance develops to the analgesic effects.
With few exceptions, it is rarely possible to measure drug concentrations at or near the receptor given that their primary location is in the tissue biophase, not in the plasma. Therefore, it is necessary to utilize a surrogate measurement (e.g., direct measurement of blood pressure, blood glucose, electrocardiogram, echocardiography, functional MRI) to assess exposure–response relationships. In most instances, a change in a given surrogate measurement is examined in association with the plasma drug concentration versus time curve to assess pharmacodynamic properties. For drugs whose pharmacokinetic properties are best described by first-order (as opposed to zero- or mixed-order) processes, a semi-logarithmic plot of plasma drug concentration versus time data for an agent given by an extravascular route of administration (e.g., intramuscular, subcutaneous, intracisternal, intraperitoneal, peroral, transmucosal, transdermal, rectal) produces a pattern depicted by Figure 82.1. The ascending portion of this curve represents a
time during which the liberation of a drug from its formulation, dissolution of the drug in a biologic fluid (e.g., gastric or intestinal fluid) and absorption of a drug are rate-limiting relative to its elimination. After the time where maximal plasma concentrations (Cmax) are observed, the plasma concentration decreases as metabolism and elimination become rate limiting; the terminal portion of this segment of the plasma concentration versus time curve being representative of drug elimination from the body. Finally, the AUC can be determined by integrating the plasma concentration data over time.
time during which the liberation of a drug from its formulation, dissolution of the drug in a biologic fluid (e.g., gastric or intestinal fluid) and absorption of a drug are rate-limiting relative to its elimination. After the time where maximal plasma concentrations (Cmax) are observed, the plasma concentration decreases as metabolism and elimination become rate limiting; the terminal portion of this segment of the plasma concentration versus time curve being representative of drug elimination from the body. Finally, the AUC can be determined by integrating the plasma concentration data over time.
By being able to characterize the pharmacokinetics of a specific drug, the clinician can use the data to individualize drug–dosing regimens so as to compensate for factors that can influence pharmacokinetics (e.g., development, disease, concomitant treatment). For drugs where a therapeutic plasma concentration range and/or “target” systemic exposure (i.e., AUC) is known, a priori knowledge of pharmacokinetic parameters for a given patient can facilitate the selection of a drug–dosing regimen and thereby, optimize therapeutic response (e.g., cyclosporine, tacrolimus) (3). When linked with information regarding the pharmacodynamic behavior of a drug and the status of the patient (e.g., age, organ function, disease state, concomitant medications), the application of pharmacokinetics affords the practitioner the ability to exercise therapeutic decision making by enabling the selection of a drug and dosing regimen that has the greatest likelihood of producing both efficacy and safety.
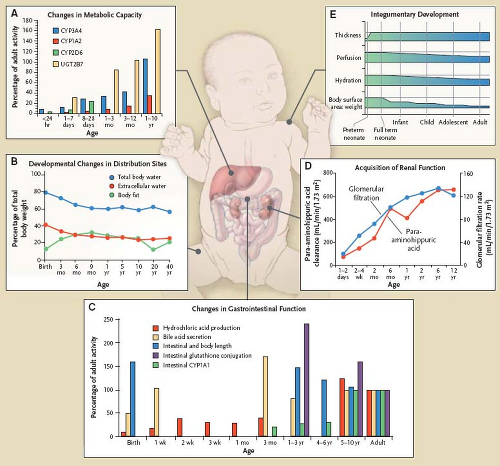 Figure 82.4 Developmental changes in physiologic factors that influence drug disposition in infants, children, and adolescents. Panel A illustrates age-dependent activity (relative to adult values) for important phase I and phase II enzymes responsible for drug biotransformation. Panel B illustrates developmental differences in body composition which can influence the apparent volume of distribution for drugs. Panel C illustrates the ontogeny of factors pertaining to gastrointestinal physiologic function, one or more of which can influence either the rate and/or extent of drug absorption. Panel D illustrates the acquisition of renal function (both glomerular filtration rate and active tubular secretory capacity reflected by para-aminohippuric acid clearance, a validated biomarker) during development. Panel E illustrates the impact of development on aspects of the integumentary system which collectively, can modulate the systemic absorption of drugs applied to the skin. (From Kearns, GL, Abdel-Rahman SM, Alander SW, Blowey DL, Leeder JS, Kauffman RE. Developmental pharmacology—drug disposition, action and therapy in infants and children. N Engl J Med. 2003;349:1157–1167.) |
Developmental Pharmacokinetics
For well over three decades, it has been known that physiologic changes that occur during human development produce alterations in drug disposition. As illustrated in Figure 82.4, maturation can produce, especially in early life, dramatic physiologic changes that
impact drug absorption, distribution, metabolism, and excretion. Accumulated information supports that many of these changes are indeed predictable (4) and consequently, they can be used to inform the design of pediatric clinical trials through the use of modeling and simulation and also, to clinically individualize drug treatment for a given patient based on known or expected pharmacokinetic behavior of a given drug (5). An example of therapeutic utility of pharmacokinetic-based optimization of drug treatment has been recently illustrated in the provision of antiretroviral therapy in children (6).
impact drug absorption, distribution, metabolism, and excretion. Accumulated information supports that many of these changes are indeed predictable (4) and consequently, they can be used to inform the design of pediatric clinical trials through the use of modeling and simulation and also, to clinically individualize drug treatment for a given patient based on known or expected pharmacokinetic behavior of a given drug (5). An example of therapeutic utility of pharmacokinetic-based optimization of drug treatment has been recently illustrated in the provision of antiretroviral therapy in children (6).
For the clinical application of such data, it is important for the clinician to have a conceptual understanding of how development influences both drug disposition and effect. In the following paragraphs, we provide a summary of developmental pharmacokinetics, much of which has been excerpted (with permission) from previous works (1,7,8) published by one of the co-authors (G.L.K.). These publications can be referred to for reference to citations in the primary literature upon which the following summaries are based.
Drug Absorption
Absorption of drugs administered by extravascular routes occurs largely via passive diffusion. At certain anatomical sites where drug transport proteins are expressed, absorption can occur via active transport or facilitated diffusion. In addition to physiologic changes that occur during development, the concomitant presence of certain disease states (e.g., inflammatory bowel disease, diarrhea) can produce changes in either the rate or extent of drug absorption. A summary of important factors that can influence drug absorption in neonates, infants, and children is provided in Table 82.1.
TABLE 82.1 Summary of Important Factors that Influence Drug Absorption in Neonates, Infants, and Children | ||||||||||||||||||||||||||||||||||||||||||||||||||||||||||||||||||||
|---|---|---|---|---|---|---|---|---|---|---|---|---|---|---|---|---|---|---|---|---|---|---|---|---|---|---|---|---|---|---|---|---|---|---|---|---|---|---|---|---|---|---|---|---|---|---|---|---|---|---|---|---|---|---|---|---|---|---|---|---|---|---|---|---|---|---|---|---|
| ||||||||||||||||||||||||||||||||||||||||||||||||||||||||||||||||||||
Oral Absorption
As is the case in adults, the majority of therapeutic drugs administered in the outpatient setting are given by the oral route. During development, maturational changes of gastric, intestinal, and biliary tract function (Fig. 82.4 C) occur and either singly or collectively, can impact the rate and extent of drug absorption.
Given that most orally administered drugs have the physicochemical property of being either a weak acid or weak base, pH within the gastrointestinal tract can influence the amount of potentially absorbable drug (i.e., the un-ionized moiety existing in a true solution) available. As illustrated in Figure 82.4 (panel C), gastric hydrochloric acid production changes as a function of age. Gastric pH changes significantly throughout development with the highest values occurring during the neonatal period. In the fully mature neonate, the gastric pH ranges from 6 to 8 at birth and drops to 2 to 3 within a few hours of birth. However, after the first 24 hours of postnatal life, the gastric pH increases due to the immaturity of the parietal cells and gradually reaches expected adult values (e.g., gastric pH 2–3) by approximately 2 to 3 years of age. As a result of these developmental differences, the bioavailability of acid-labile drugs (e.g., penicillin, ampicillin) is increased (relative to older children and adults) in neonates and young infants whereas the absorption of weak organic acids is decreased. For drugs with a relatively narrow therapeutic index (e.g., phenytoin), the ontogeny of gastric pH can produce significant age-associated alterations in bioavailability which may necessitate more frequent alterations in drug–dosing regimens required to achieve therapeutic plasma levels.
During development, one of the most important physiologic changes capable of altering the rate of drug absorption resides with gastrointestinal motility. During early infancy, gastric emptying
time is prolonged, which can delay delivery of orally administered drugs to the small intestine where the majority of absorption takes place. By 6 to 8 months of age, gastrointestinal transit times may be shorter than those observed for older children and adults; a situation which can significantly influence both the rate and extent of bioavailability of drugs with limited water solubility (e.g., phenytoin, carbamazepine) by reducing residence time at the absorptive sites in the small intestine. Finally, immature biliary function in neonates and young infants in the first few months of life has the potential for reducing the extent of oral bioavailability of lipophilic drugs which are dependent upon bile acids for their solubility in the small intestine (e.g., fat-soluble vitamins).
time is prolonged, which can delay delivery of orally administered drugs to the small intestine where the majority of absorption takes place. By 6 to 8 months of age, gastrointestinal transit times may be shorter than those observed for older children and adults; a situation which can significantly influence both the rate and extent of bioavailability of drugs with limited water solubility (e.g., phenytoin, carbamazepine) by reducing residence time at the absorptive sites in the small intestine. Finally, immature biliary function in neonates and young infants in the first few months of life has the potential for reducing the extent of oral bioavailability of lipophilic drugs which are dependent upon bile acids for their solubility in the small intestine (e.g., fat-soluble vitamins).
Developmental differences in the activity of intestinal drug-metabolizing enzymes (e.g., CYP3A4/5, CYP1A, N-acetyltransferase, xanthine oxidase, glutathione-S-transferase) and efflux transporters (e.g., P-glycoprotein or MDR1, multidrug resistance protein-MRP2, breast cancer resistance protein [BCRP]) can markedly alter the bioavailability of some orally administered drugs. For example, intestinal expression of CYP3A and CYP1A1 both appear to increase with increasing age (9). The clinical consequence of this observation of diminished expression in neonates and infants would be reduced presystemic clearance of substrates for these drug-metabolizing enzymes and higher circulating concentrations of the active compound in plasma (e.g., alprazolam, amlodipine, dexamethasone). Conversely, if the medication is administered as a prodrug which is activated by these enzymes, we would expect reduced concentrations of the active compound in the plasma (e.g., simvastatin, lovastatin). While the patterns of ontogeny for these enzymes and transporters are not concordant, the majority appear to have adult expression within the first 6 to 12 months of postnatal life at which time, the influence of development on their activity as a determinant of bioavailability would be expected to be minimal (9,10).
Extravascular Drug Absorption
As is the case with oral drug absorption, development can influence the bioavailability of drugs administered by other extravascular routes (e.g., subcutaneous, intramuscular, intraosseous, intratracheal, intraperitoneal, rectal, dermal) largely as a result of changes in regional blood flow and tissue composition (Table 82.1). In the neonate, muscular blood flow is reduced in the first few days of life, as is the relative efficiency of muscular contractions. Furthermore, neonates and young infants have greatly reduced muscle mass (compared to older infants and children) an increased percentage of water per unit of muscle mass. Collectively, these developmental changes can produce variable and delayed rates of absorption of drugs given by the intramuscular route.
In contrast, mucosal (rectal and buccal) and dermal permeability in the neonate and young infant is increased and thus, may result in enhanced absorption by these routes. In the case of transdermal drug absorption, a more highly perfused and hydrated stratum corneum (Fig. 82.4, panel E) facilitates drug absorption in the neonate and very young infant. In addition, the ratio of body surface area to body weight is greater in infants and children as compared to adults. Collectively, these developmental differences may predispose infants and young children in the first 8 to 12 months of life to increased exposure and risk for toxicity for drugs/chemicals placed on the skin (e.g., silver sulfadiazine, topical corticosteroids, benzocaine, diphenhydramine, isopropyl alcohol).
Normal developmental differences in drug absorption from most all extravascular routes of administration can influence the dose–plasma concentration relationship in a manner sufficient to alter pharmacodynamics. Disease states that affect the integrity of the physiologic barriers that drugs given by extravascular routes must traverse prior to their translocation to the vascular space must be considered, as they can influence both the rate and extent of drug absorption. Finally, with regard to extravascular drug administration, it must be recognized that the onset of drug effect is directly dependent upon the route of administration. For example, the onset of effect for most drugs given intravenously in most cases, virtually instantaneous. This is contrasted with drugs given by inhalation (onset ∼ 2 to 3 minutes), sublingual administration (onset ∼ 3 to 5 minutes), intramuscular injection (onset ∼ 10 to 20 minutes), subcutaneous injection (onset ∼ 15 to 30 minutes), rectal (onset ∼ 30 minutes), oral (onset ∼ 30 to 90 minutes), and transdermal (onset ∼ minutes to hours) routes.
Drug Distribution
Drug distribution is influenced by a variety of factors which include drug-specific physiochemical properties, tissue composition (e.g., water, fat, and lean muscle content) and perfusion, the role of drug transporters, blood/tissue protein binding, blood and the pH of blood and tissue fluids. To a great degree, changes in drug distribution during development are associated with changes in body composition and the quantity of plasma proteins capable of drug binding. As well, certain disease states (e.g., ascites, dehydration, burn injuries involving large surface area, sepsis with capillary leak syndrome) can influence body water compartment sizes and thereby, the distribution of drugs with an apparent volume of distribution less than or equal to the total body water space (i.e., 0.6 L/kg).
As illustrated in Figure 82.4 (panel B), neonates and young infants have significantly higher total body water and extracellular water spaces than older infants and children. The reduction in relative total body water occurs rapidly during the first year of life and by 12 years, adult values (i.e., ∼60% of lean muscle mass) are attained. In contrast, the percentage of intracellular water as a function of body mass remains stable from the first months of life through adulthood. For drugs that are primarily distributed to a space which approximates the extracellular fluid pool and are not highly bound to plasma proteins (e.g., aminoglycoside antibiotics), their weight-adjusted apparent volumes of distribution (i.e., L/kg) are larger (e.g., approximately 0.4 to 0.6 L/kg in neonates and infants vs. 0.2 to 0.3 L/kg in adults) which necessitates the administration of higher weight-adjusted (mg/kg) doses in order to attain target plasma (blood) levels.
Despite the relatively low body fat content in the neonate (∼16%, Fig. 82.4, panel B), the developing central nervous system (CNS) has a relatively high lipid content in early life; a condition with implications for the distribution of lipophilic drugs capable of acting in the CNS. The body fat percentage tends to increase up to about 10 years of age and then changes composition with respect to puberty and sex. In normal children and adolescents with age-appropriate body habitus, changes in body composition beyond the first 3 months of life do not appear to produce profound developmental differences in drug disposition. This does not appear to be the case for obese children where increased body fat appears to require adjustment in the normal age-appropriate dosing regimen for several drugs (e.g., aminoglycosides, carbamazepine, phenytoin, benzodiazepines, digoxin, lithium, opiates) (11).
Of the circulating proteins in plasma, albumin (which preferentially binds weak acids) and α1-acid glycoprotein (which preferentially binds weak bases) are quantitatively the most important for drug binding. As summarized in Table 82.2, the concentration of these proteins changes over development with low concentrations in the neonate and young infant (∼80% of adult), increasing to adult values by approximately 1 year of age. A similar pattern of maturation is observed with α1-acid glycoprotein where neonatal plasma concentrations are approximately three times lower than in maternal plasma and attain adult values by approximately 1 year of age. Additionally, specific conditions (e.g., malnutrition, protein loosing enteropathy, nephrotic syndrome, large burn injuries, extravascular translocation of proteins, sepsis, acidosis, protracted hyperglycemia, chronic renal failure with uremia) can reduce the absolute concentration of drug-binding proteins and in some instances (e.g., acidosis, glycation of albumin associated with
chronic hyperglycemia, carbamylation of albumin associated with uremia), the binding affinity of a given drug for a protein. Binding affinity for acidic drugs is also reduced in the neonate as a consequence of the higher concentrations of fetal albumin (which has a lower binding capacity) and endogenous substances (e.g., bilirubin) that can compete with drugs for albumin-binding sites. For example, circulating fetal albumin in the neonate has significantly reduced binding affinity for acid drugs such as phenytoin which is extensively (∼94% to 98%) bound to albumin in adults as compared to 80% to 85% in the neonate. The resultant six- to eightfold difference in the free fraction can result in CNS adverse effects in the neonate when total plasma phenytoin concentrations are within the generally accepted “therapeutic range” (10 to 20 mg/L), thereby influencing the pharmacodynamics of this agent.
chronic hyperglycemia, carbamylation of albumin associated with uremia), the binding affinity of a given drug for a protein. Binding affinity for acidic drugs is also reduced in the neonate as a consequence of the higher concentrations of fetal albumin (which has a lower binding capacity) and endogenous substances (e.g., bilirubin) that can compete with drugs for albumin-binding sites. For example, circulating fetal albumin in the neonate has significantly reduced binding affinity for acid drugs such as phenytoin which is extensively (∼94% to 98%) bound to albumin in adults as compared to 80% to 85% in the neonate. The resultant six- to eightfold difference in the free fraction can result in CNS adverse effects in the neonate when total plasma phenytoin concentrations are within the generally accepted “therapeutic range” (10 to 20 mg/L), thereby influencing the pharmacodynamics of this agent.
TABLE 82.2 Ontogenic Influences of Plasma Drug–Protein Binding and Drug Distribution | ||||||||||||||||||||||||||||||||||||||||||||||||||||||||||||||||||||||||||||||||
|---|---|---|---|---|---|---|---|---|---|---|---|---|---|---|---|---|---|---|---|---|---|---|---|---|---|---|---|---|---|---|---|---|---|---|---|---|---|---|---|---|---|---|---|---|---|---|---|---|---|---|---|---|---|---|---|---|---|---|---|---|---|---|---|---|---|---|---|---|---|---|---|---|---|---|---|---|---|---|---|---|
| ||||||||||||||||||||||||||||||||||||||||||||||||||||||||||||||||||||||||||||||||
Transporter proteins are distributed throughout the body and contribute to the uptake and efflux of substrates to and from tissues. Drug transporters from two distinct superfamilies, ATP-binding cassette (ABC) and solute carrier (SLC), can also influence drug distribution. The ABC transporters (e.g., P-glycoprotein or MDR1, MRP2, BCRP) expel drugs, xenobiotics, and metabolites by an ATP-dependent manner from various locations in the body, including the intestinal tract, liver, and kidney (12). The SLC transporters (e.g., OATP1B1, OATP1B3) move drugs, xenobiotics, and metabolites according to a concentration gradient with increased concentrations present on hepatocytes. These drug transporters can markedly influence the extent to which drugs cross membranes in the body and whether drugs can penetrate or are secreted from the target sites. For example, several hydrophilic HMG-CoA reductase inhibitors (e.g., pravastatin, rosuvastatin) used to treat dyslipidemia and prevent post-transplant coronary–allograft vasculopathy in children and young adults are dependent on the OATP1B1 protein to deliver the drug to its site of action within the hepatocyte. Alteration of this process via decreased expression of the protein during development or polymorphisms of the genes encoding for the transporter could modify the quantity or rate of drug delivery, thereby affecting the drug’s disposition in the patient (13). While there are limited data on the ontogeny of drug transport proteins, available information demonstrates their presence in enterocytes and hepatocytes as early as 18 weeks of gestation and low levels in the neonatal period which increase to adult values at varying ages during childhood (10,14,15). There remains a significant paucity of data regarding individual transporter function and transporter protein expression during childhood, and these knowledge gaps that directly influence drug disposition in the growing child, require further elucidation.
Drug Metabolism
Metabolism reflects the biotransformation of an endogenous or exogenous molecule by one or more enzymes to moieties which generally are more polar (hydrophilic) and thereby, more easily
eliminated via excretion, secretion, and/or exhalation. While in many cases, drug metabolism results in pharmacologic inactivation of a drug, there are instances where it can either contribute to or be a determinant of drug action. The former situation is illustrated by drugs which have pharmacologically active metabolites (e.g., metabolism of amitriptyline to nortriptyline, codeine to morphine) and the latter, by the example of prodrugs where an inactive moiety is biotransformed to an active agent (e.g., enalaprilat). It should be noted that metabolic activation for some drugs has been identified as a mechanism underlying toxicity (e.g., acetaminophen-associated hepatotoxicity; Steven–Johnson syndrome associated with sulfonamides, phenytoin, and carbamazepine; halothane-associated hepatitis).
eliminated via excretion, secretion, and/or exhalation. While in many cases, drug metabolism results in pharmacologic inactivation of a drug, there are instances where it can either contribute to or be a determinant of drug action. The former situation is illustrated by drugs which have pharmacologically active metabolites (e.g., metabolism of amitriptyline to nortriptyline, codeine to morphine) and the latter, by the example of prodrugs where an inactive moiety is biotransformed to an active agent (e.g., enalaprilat). It should be noted that metabolic activation for some drugs has been identified as a mechanism underlying toxicity (e.g., acetaminophen-associated hepatotoxicity; Steven–Johnson syndrome associated with sulfonamides, phenytoin, and carbamazepine; halothane-associated hepatitis).
Quantitatively, the most important organ responsible for drug biotransformation is the liver. However, drug-metabolizing enzymes (e.g., phosphatases, esterases) also exist in the blood, brain, lung, small intestine, adrenal glands, kidney, and skin. Drug metabolism has historically been conceptualized as occurring via two general classes of enzymatic processes: phase I, or nonsynthetic reactions (e.g., oxidation, reduction, hydrolysis, hydroxylation) and phase II, or synthetic (e.g., glycine, glucuronide, glutathione, sulfate conjugation) reactions. It is important to note that in many instances, phase I and phase II reactions can occur sequentially (e.g., hydroxylation of drug molecule followed by glucuronidation of the primary metabolite) as most therapeutic drugs are polyfunctional substrates for a variety of drug-metabolizing enzymes. At birth, the concentration of drug-oxidizing enzymes in fetal liver (corrected for liver weight) appears similar to that in adult liver. However, the activity of these oxidizing enzyme systems is reduced, which results in slow clearance (and prolonged elimination) of many drugs. Finally, as illustrated by Figure 82.4 (panel A), both phase I and II drug-metabolizing enzymes have an ontogenic profile which generally is reflective of maturation over a period of months to years with different enzymes having specific developmental trajectories. For example, alcohol dehydrogenase (ADH1C) is expressed at extremely low levels in the fetus but increases dramatically in the first 1 to 2 years after birth. In contrast, CYP3A7, a cytochrome P450 responsible for the biotransformation of the endogenous substrate dehydroepiandrosterone sulfate (DHEA-S) is expressed at the highest level during the first trimester whereas its activity at 1 to 2 years of age is virtually absent in most individuals. Finally, one of the isoforms of sulfotransferase (SULT1A1) is expressed at relatively constant levels during gestation and postnatal life (9).
The impact of ontogeny on the activity of human drug-metabolizing enzymes has been the topic of several reviews (16,17,18). Of the many enzymes capable of metabolizing drugs and other small molecules, the cytochrome P450 (CYP450) supergene family is quantitatively the most important. Specific CYP450 isoforms (and prototypical drug substrates) responsible for the majority of drug metabolism in humans include CYP1A2 (caffeine), CYP2C9 (warfarin, losartan, phenytoin), CYP2C19 (proton pump inhibitors, clopidogrel), CYP2D6 (codeine, tamoxifen), CYP2E1 (ethanol), CYP3A5 (tacrolimus), and CYP3A4 (midazolam, cyclosporine).
Compared to phase I drug-metabolizing enzymes, the impact of development on the activity of phase II enzymes is not as well characterized. However, studies to date indicate that in general, phase II enzyme activities are decreased in the newborn and increase into childhood. For example, conjugation of compounds metabolized by UDP-glucuronosyltransferase (UGT) isoforms (e.g., morphine, bilirubin, and chloramphenicol) illustrates reduced metabolic capacity at birth which in turn, can dramatically reduce drug plasma clearance (e.g., the gray baby syndrome tragedy associated with excessive systemic exposure to chloramphenicol following the administration of “normal” pediatric doses to neonates and young infants). Development of metabolic competence for most phase II drug-metabolizing enzymes occurs rapidly during the first year of life and for selected enzymes, can exceed adult values by 3 to 4 years of age (17). As illustrated by data for human glucuronosyltransferases (19), the impact of ontogeny on drug-metabolizing enzyme activity can be isoform specific. For example, the activity of the UGT isoforms responsible for acetaminophen metabolism (UGT1A1 and UGT1A9) is markedly reduced in neonates and infants and as a result, conjugation of the metabolites of the drug is primarily dependent upon glutathione transferase and sulfotransferase isoforms. As infants develop, UGT activity increases and by the first year of life, these enzymes become the most quantitatively important for acetaminophen metabolism. A similar developmental profile exists for morphine, a drug whose metabolism is largely dependent upon two polymorphically expressed UGT isoforms, UGT2B7 and UGT1A1 (20).
Many drug-metabolizing enzymes represent the products of genes that in some instances, are polymorphically expressed, with the variant alleles often conveying reduced and/or absent activity. A notable exception is exemplified by the CYP2C19*17 allele which appears to convey increased catalytic activity to the enzyme (21). Similarly, polymorphic expression of genes responsible for regulation of specific drug transporter proteins also exists. Together with drug-metabolizing enzymes, their activities are often the rate-limiting event for metabolic clearance of a drug from the body and in some instances, for drug action. Thus, genetic polymorphisms can influence both the pharmacokinetics and pharmacodynamics of drugs.
The potential clinical importance of genetic polymorphisms for a drug-metabolizing enzyme has been recently illustrated by a comprehensive review published by Swen et al. (22) which discusses CYP2D6 phenotype and its relevance to the therapeutic use of flecainide, metoprolol, and propafenone. As illustrated by Table 82.3, differences in the pharmacokinetics of these drugs associated with CYP2D6 phenotype (i.e., poor-metabolizer, intermediate metabolizer, or ultra-rapid metabolizer; each conveyed by specific allelic variants of the CYP2D6 gene) must be considered in the selection of a dosing regimen so as to prevent either therapeutic failure (e.g., sub-therapeutic systemic exposure resulting from a “normal” dose given to an individual with rapid drug clearance consequent to having an ultra-rapid CYP2D6 metabolizer phenotype) or therapeutic misadventure (e.g., increased systemic exposure associated with drug toxicity in individuals having a poor-metabolizer CYP2D6 phenotype). A recent review published by Visscher et al. (23) also highlights the importance of polymorphic expression of genes responsible for the expression of drug-metabolizing enzymes, transporters, and receptors. As summarized in Table 82.4 with the example of warfarin, allelic variants of the enzyme primarily responsible for its metabolism (i.e., CYP2C9) and also, for its mechanism of action (i.e., VKORC1 or vitamin K epoxide reductase) require therapeutic dose adjustment so as to prevent excessive coagulation. In contrast, the example of clopidogrel illustrates that polymorphic expression of both the primary drug-metabolizing enzyme (i.e., CYP2C19) and the efflux transporter ABCB1 (also called MDR1 or p-glycoprotein) serve as determinants of therapeutic dosing regimens. Finally, the importance of genetic polymorphism on pharmacodynamics is well illustrated by the β-adrenergic receptor blockers where variant alleles of the β receptor are associated with either an improved response to therapy or alternatively, an increased likelihood of adverse events that are dependent upon a specific genotype.
In addition to their importance in removing drugs from the body, it is important to recognize that both drug-metabolizing enzymes and transporters that exist predominantly in the small intestine and both their polymorphic and ontogenic expression can alter the absolute bioavailability of drugs. Like drug-metabolizing enzymes, the activity of intestinal drug transporters (MDR1 or P-glycoprotein) is low at birth (relative to adults) and increases throughout the first 2 years of life (24). Given that the activity of most drug-metabolizing enzymes is markedly reduced in the neonate, the extent of bioavailability of drugs which are substrates for drug-metabolizing enzymes (e.g., CYP3A4, CYP3A5) and transporters (ABCB1) in the small intestine would be expected to be increased during the first weeks of
life. Presystemic clearance (also described as first-pass effect) would increase as the functional capacity of these proteins increases, with the potential for reducing the bioavailability of drugs given by the oral route. Unfortunately, very few bioavailability studies are conducted in infants and children; thus, assumptions regarding the impact of ontogeny on presystemic drug clearance must be made based on the known developmental profiles and pharmacogenomics for the drug-metabolizing enzymes and transporters involved (5). Accordingly, estimates of how presystemic clearance may influence drug bioavailability derived from adult studies cannot be accurately applied to extrapolate how a drug dose given by the oral route may need to be age adjusted for a neonate or infant.
life. Presystemic clearance (also described as first-pass effect) would increase as the functional capacity of these proteins increases, with the potential for reducing the bioavailability of drugs given by the oral route. Unfortunately, very few bioavailability studies are conducted in infants and children; thus, assumptions regarding the impact of ontogeny on presystemic drug clearance must be made based on the known developmental profiles and pharmacogenomics for the drug-metabolizing enzymes and transporters involved (5). Accordingly, estimates of how presystemic clearance may influence drug bioavailability derived from adult studies cannot be accurately applied to extrapolate how a drug dose given by the oral route may need to be age adjusted for a neonate or infant.
TABLE 82.3 Examples of Cardiovascular Drugs Where Polymorphic Gene Expression of CYP2D6 in Adults Supports Modification of Dosing Regimen | |||||||||||||||||||||||||||||||||||||||||||||||||||||||
|---|---|---|---|---|---|---|---|---|---|---|---|---|---|---|---|---|---|---|---|---|---|---|---|---|---|---|---|---|---|---|---|---|---|---|---|---|---|---|---|---|---|---|---|---|---|---|---|---|---|---|---|---|---|---|---|
| |||||||||||||||||||||||||||||||||||||||||||||||||||||||
TABLE 82.4 Overview of Drug-Metabolizing Enzyme and Transporter Gene Variants and their Association with Cardiovascular Drug Response | ||||||||||||||||||||||||||||||||||||||||||||||||||||||||
|---|---|---|---|---|---|---|---|---|---|---|---|---|---|---|---|---|---|---|---|---|---|---|---|---|---|---|---|---|---|---|---|---|---|---|---|---|---|---|---|---|---|---|---|---|---|---|---|---|---|---|---|---|---|---|---|---|
| ||||||||||||||||||||||||||||||||||||||||||||||||||||||||
TABLE 82.5 Drug Metabolism in the Neonate, Infant, and Child | ||||||||||||||||||||||||||||||||||||||||||||||||||||
|---|---|---|---|---|---|---|---|---|---|---|---|---|---|---|---|---|---|---|---|---|---|---|---|---|---|---|---|---|---|---|---|---|---|---|---|---|---|---|---|---|---|---|---|---|---|---|---|---|---|---|---|---|
| ||||||||||||||||||||||||||||||||||||||||||||||||||||
Stay updated, free articles. Join our Telegram channel

Full access? Get Clinical Tree


