Fig. 1 a–i.
A 27-year-old male who underwent staging PET-CT for nodular sclerosing Hodgkin lymphoma. a A 3D-maximum intensity projection (MIP) image shows a bulky, markedly hypermetabolic mediastinal mass (SUVmax 9.4) and matted mediastinal lymph nodes. b Contrast-enhanced CT performed at the same setting shows a heterogeneously enhancing mass. c Fused axial PET-CT shows the hypermetabolic mass with central area of reduced uptake. d-f End-chemotherapy PET-CT scans of the MIP image (d), and fused PET-CT of two axial sections (e, f) show a residual anterior mediastinal mass with minimal residual uptake (Deauville 5-point score 3). The patient underwent radiation therapy (RT) of the mediastinal mass. A post-RT treatment scan 3 months after the end of RT was performed. MIP image (g) and fused axial PET-CT image (h) show a reduction in the size of the mass and a complete metabolic response (CMR). Routine surveillance PET-CT scan was obtained 5 years later. Fused axial PET-CT image (i) shows a persistent residual mediastinal mass that has further reduced in size and CMR
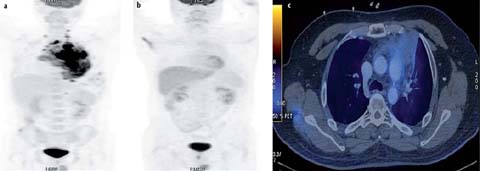
Fig. 2 a–c.
A 31-year-old male with nodular sclerosing Hodgkin lymphoma. a Staging PET-CT was performed. MIP image (b) shows a hypermetabolic mediastinal mass with lower cervical, mediastinal, and diaphragmatic lymphadenopathy (SUVmax 11.7). He was treated with ABVD (adriamycin, bleomycin, vinblastine and darcarbacine) 8 and radiotherapy. Subsequent recurrent disease in the left lower chest wall was treated with DHAP (dexamethasone, cytarabine, cisplatin) and autologous bone marrow transplantation (BMT). PET-CT was performed post-BMT. MIP image (b) and fused axial PET-CT image (c) show a residual mediastinal mass with minimal residual up-take (Deauville 5-point score 2). Punch biopsy showed fibrofatty tissue only, with no malignancy
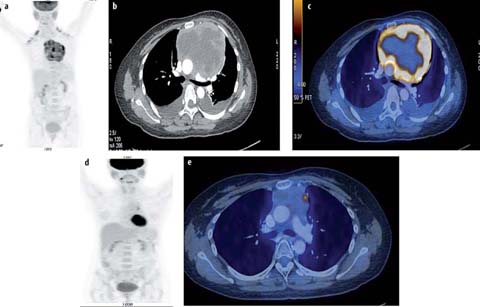
Fig. 3 a–e.
A 37-year-old female with primary mediastinal B-cell lymphoma. Staging PET/CT was performed. MIP image (a), contrast-en-hanced CT (b) and fused axial PET-CT image (c) show a heterogeneously contrast-enhancing mass in the anterior and middle mediastinum that extends from the thoracic inlet to the lower end of the sternum. The lesion shows central necrosis and peripheral contrast enhancement (SUVmax 10.6). The end-chemotherapy PET scan shows a complete metabolic response with residual mass. The mediastinal mass was treated with radiotherapy (RT). PET-CT was performed 3 months after end of RT. MIP image (d) and fused axial PET-CT image (e) show suspicious focal uptake in the mass. Follow-up PET-CT 3 months later shows resolution of the focal uptake suggesting false positive findings in the previous scan (d, e)
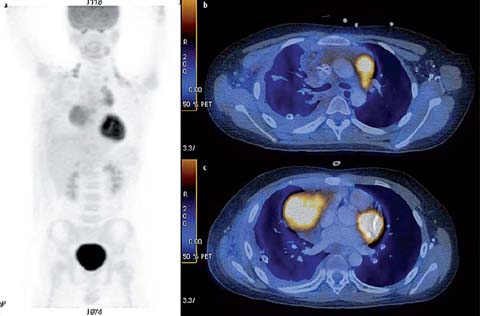
Fig. 4 a–c.
A 10-year-old male with T-lymphoblastic lymphoma. Staging PET/CT scan was performed. MIP image (a), fused axial PET-CT image of 2 sections (b, c) show a hypermetabolic anterior mediastinal mass (SUVmax 6.4). The patient responded poorly to chemotherapy and died from progressive disease 2 years later
For disease staging, compared to conventional CT, FDG-PET/CT may lead to a change in disease stage, more often upstaging [4, 5]. This is particularly important before consideration of radiotherapy (RT), because the PET/CT findings may have an impact on RT planning and design of the RT field. A single nodal mass/mediastinal mass should be measured on the CT scan across the longest measurement. In HL, tumor bulk ≽10 cm is defined as bulky disease and has prognostic and therapeutic implications. Moreover, contrast-enhanced CT, if not already performed, should ideally be done as part of a “one-stop” approach during a single imaging session combined with PET/CT [6]. Baseline findings should be used to determine whether contrast-enhanced CT or lower dose and non-enhanced PET/CT will suffice for additional imaging examinations. A bone marrow biopsy is no longer indicated for routine staging of HL or most DLBCLs [7].
For response assessment, conventional morphologic imaging using CT or magnetic resonance imaging was shown to lack specificity in the characterization of residual masses that often remain after treatment. However, FDG-PET allows better discrimination between viable tissue and fibrotic residual masses, by showing the altered metabolism of the former (Figs. 1–3). Thus, FDG-PET/CT was incorporated into the 2007 International Working Group guidelines for response assessment of these malignant lymphomas [8]. In the previous guidelines, visual interpretation of positive or negative PET/CT scans was based on comparison with the mediastinal blood pool for end-of-treatment response assessment [8]. For HL, end-of-treatment scans were shown to carry a high negative predictive value (80–100%), although the positive predictive value is more variable (25–100%). In the recent updated recommendation, a 5-point scale (5-PS) based on visual assessment is used to assess response to PET/CT [7]. The 5-PS score assesses uptake at the site of initial disease as follows: 1, no uptake; 2, uptake ≼mediastinum, 3, uptake >mediastinum but liver; ≼4, uptake moderately higher than liver; 5, uptake markedly higher than liver (2-to 3-fold higher than a large region of normal liver) and/or new lesions. In the recommendation, a score of 1 or 2 represents a complete metabolic response (CMR); a score 3 of represents a probable CMR in patients receiving standard treatment (Fig. 1); and a score of 4 or 5 with reduced uptake from baseline is considered a partial metabolic response, but if the assessment is at the end of treatment it represents residual metabolic disease. An increase in FDG uptake to a score of 5, or a score of 5 with no decrease in uptake, and new FDG-avid foci consistent with lymphoma represent treatment failure and/or progression.
For interim assessment, patients should undergo scanning as long after the previous chemotherapy administration as possible, since non-specific FDG uptake may occur with treatment-related inflammation. A minimum of 3 weeks but preferably 6–8 weeks after the completion of the last chemotherapy cycle, 2 weeks after granulocyte colony-stimulating factor treatment, or 3 months after RT is recommended (Fig. 3).
Early treatment assessment is potentially of importance for response-adapted treatment, both to optimize treatment and to avoid unnecessary toxicity. For HL, it has been found that early metabolic changes are highly predictive of final treatment response and progression-free survival [9]. Currently, based on interim PET findings after two courses of ABVD (adriamycin, bleomycin, vinblastine, and darcarbacine) chemotherapy, early treatment intensification with BEACOPPesc (bleomycin, etoposide, adriamycin, cyclophosphamide, vincristine, procarbazine, and prednisone escalated regimen) should be instituted in patients with a positive PET scan. Multiple clinical trials are on-going to determine the value of early PET in response-adapted therapy for the identification of patients with poor treatment response who may benefit from escalation to more aggressive therapy, and for patients with good treatment response who can be cured with less than standard therapy, including omission of RT to the mediastinum.
In children, FDG accumulation in the thymus is a common, normal finding and thymic rebound hyperplasia can be observed after chemotherapy (Fig. 5), which may be a potential pitfall in the interpretation of FDG-PET/CT in pediatric patients. Thymic rebound may reflect a hematological rebound phenomenon, characterized by lymph follicles with large nuclear centers and plasma cell infiltration. Although thymic rebound usually appears within 6–12 months after cessation of chemotherapy, it can develop over a period as short as 1 week. The time course of FDG uptake in the thymus is such that it is usually not apparent at cessation of therapy, with uptake reaching a peak within 12 months after treatment (10 months in a few reported series), with a slow decline thereafter [10, 11]. Moreover, there is often a concurrent increase in bone marrow uptake due to increased bone marrow stimulation from cytokine therapy [11]. Generally, it is of diffuse low metabolic activity compared to malignant mediastinal soft tissue. Although there is considerable overlap in SUV values, thymic rebound is of homogenous soft-tissue density, with a typical shape and convex margins [12] (Fig. 5). It is important to also be aware of normal-variant, whereby thymic tissue extends superiorly and thus appears as a superior mediastinal nodule, in which case it may be confused with superior mediastinal adenopathy (Fig. 6).
Stay updated, free articles. Join our Telegram channel

Full access? Get Clinical Tree


