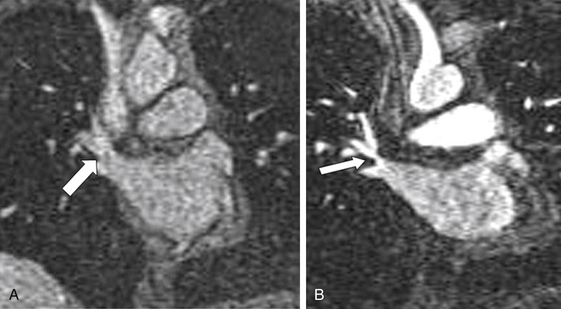
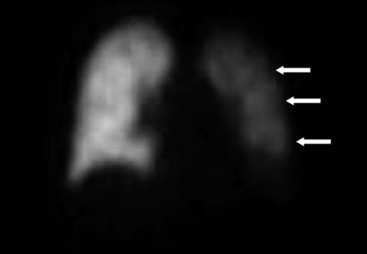
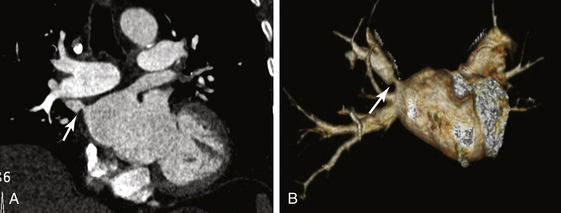
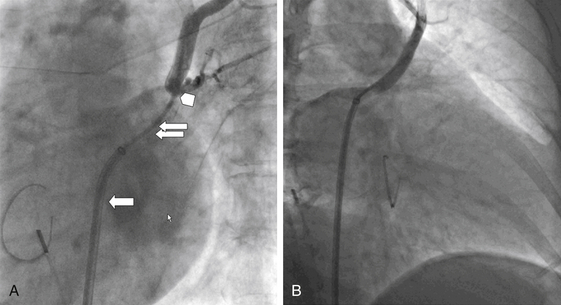
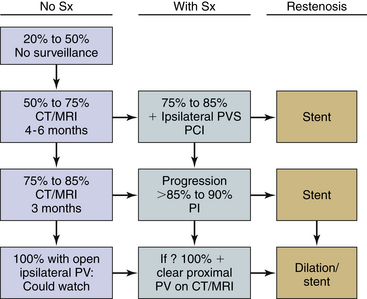
Chapter 19 Atrial fibrillation (AF) remains the most common arrhythmia encountered in clinical practice; it is estimated that by the year 2050 the number of patients in the United States may exceed 12 million.1 Traditionally, AF has been treated medically with the aim of either restoring sinus rhythm or slowing down the arrhythmia to levels tolerated by the cardiovascular system. More recently, catheter mapping and utilization of surgically or catheter-based ablation strategies to the left atrial wall and pulmonary veins (PVs) have been developed and are quite successful in restoring sinus rhythm to a significant number of patients with this arrhythmia.2–5 However, this does not eliminate the issue of thromboembolic events. Currently 40,000 to 50,000 ablation procedures are performed yearly in the United States, and this number is expected to increase. PV stenosis (PVS) has emerged as a rare but serious complication of AF ablation. The emergence of this entity altered the way ablative procedures are now performed. Initial studies of PV ablation were performed with focal ablation within the PVs; this led to a high incidence of PVS. Subsequently, segmental ostial PV ablation was proposed and performed with the aim of isolating the PVs and avoiding ablation within the veins. This reduced but did not eliminate PVS, thereby leading to modification of the ablation technique. Currently, most ablative procedures are performed within the left atrium (LA), where the PVs are isolated by ablating around the PV using wide encircling lesions. Despite this technique of avoiding the PVs in their entirety, PVS remains a complication of AF ablation, but the incidence has been reduced considerably.3 The true incidence and prevalence of PVS remain undetermined; this is in part dependent on the diagnostic technique used for ascertainment. Rates have varied based on the technique of AF ablation, as mentioned previously. In the early series in which PV isolation was performed within the PVs, an incidence of 42.4% was documented.6 With improvements in procedural techniques the incidence of PVS has fallen. A worldwide survey of 188 centers performing AF ablation revealed the incidence of PVS to be around 1.3%.7 Good understanding of pulmonary venous anatomy is crucial for interventionalists wishing to undertake PV interventions. In a study using gadolinium-enhanced magnetic resonance imaging (MRI), Kato et al8 examined PV anatomy in 28 patients with AF and 27 control patients. They found that there was significant variability in PV anatomy, with 38% of patients demonstrating variant anatomy. Typical PV anatomy involves four PVs with separate ostia: two left superior and inferior PVs, and two right superior and inferior PVs. In some patients the left superior and inferior PVs drain into a common antrum/ostia, which may have a short or long trunk. Another variant involves the right PV, in which there are one or two right middle veins. Occasionally, in addition to the right superior and inferior PVs, there is a right middle PV and a right “upper” PV that arises above the right superior PV (RSPV) (Figure19–1). This variability was also shown by Marom et al9 In their study involving 201 patients who underwent computed tomography (CT) scanning, they found that 71% of patients had two right PVs: the RSPV and the right inferior PV (RIPV); 28% of patients had 3 to 5 PVs on the right side secondary to the middle PV, and 2% had a single PV on the right. The majority of patients (86%) had two ostia on the left: the left superior PV (LSPV) and the left inferior PV (LIPV), and the remainder (24%) had single ostia draining the two PVs on the left.9 Figure 19–1 Branching pattern of the pulmonary veins (PVs) in patients with atrial fibrillation (AF) and in a control group. Other findings by Kato et al8 include close proximity between the ostia of the right and left PV; separation of the mouth of the LSPV from the left atrial appendage by a thin rim of tissue; and no differentiation of size in the diameters of the PV with little variation in size of the PV in a given patient. They also found that the left PV has a longer neck, and that the PV ostia are usually oblong with the anteroposterior diameter less than the superoinferior diameter.8 There is significant variability in clinical symptomatology of patients with PVS, ranging from an absence of symptoms to significant life-threatening disease. This variability is based on several factors, including the number of PVs involved, the severity of stenosis, the response of the pulmonary vasculature to the lesion, the time course of stenosis, the clinical setting, and the presence/extent of collaterals.10–13 In a study by Packer et al,13 symptomatic patients most commonly experienced dyspnea on exertion (83%), followed by dyspnea at rest (30%), recurrent cough (39%), chest pain (26%), flulike symptoms (13%), and hemoptysis (13%). Given the variability and lack of specificity of a particular symptom, detection of PVS requires a high index of suspicion on the part of the clinician. The diagnosis may be missed, or the symptoms may be attributed to another illness such as bronchopneumonia or interstitial lung disease. Routine screening and surveillance for symptoms that may herald the onset of PVS are very important. CT is one of the most commonly used imaging tools for making the diagnosis of PVS because it provides accurate definition of PV anatomy. There are some caveats to the use of CT imaging. A detailed knowledge of PV anatomy is required by the radiologist reading the images. Secondly, occasionally there may be the appearance of stenosis of the LIPV when there is “pseudostenosis.” This was demonstrated in a study by Yamaji et al,14 in which they performed CT imaging of the PV in 116 patients undergoing PV isolation for AF preablation and postablation. They found that in 11 patients there was more than 50% stenosis in the LIPV when the CT was performed in the supine position. This was not seen when the patients were imaged on the same day in the prone position. Occasionally when CT imaging is used for diagnosis, the PV may be interpreted as being completely occluded, but on subsequent PV angiography a small orifice may be seen. This was identified by Prieto et al11 in their study of 44 patients with 80 stenosed PVs. Twenty-seven of the 80 stenosed PVs were identified on CT as being 100% occluded; subsequent PV angiography demonstrated a small lumen in 13 of the 27 PVs. At the Mayo Clinic, CT is the modality of choice for imaging the PVs. A study performed at the Mayo Clinic13 revealed that the mean PV orifice was 17.3 mm (with a range of 12 to 24 mm), the baseline diameter at the point of stenosis was 3 ± 2 mm, and the stenosis began 1 to 2 mm distal to the PV orifice and extended for variable lengths 7 to 35 mm (Figure 19–2). Figure 19–2 A, Computed tomography image showing tight stenosis involving the right superior pulmonary vein (arrow). B, Three-dimensional volume rendering of the right superior pulmonary vein stenosis (arrow). MRI is also an acceptable diagnostic modality (Figure 19–3). An important caveat with MRI of the PVs is that there may be substantial changes in the size and location of the PV orifice during the cardiac cycle. Lickfett and colleagues examined this issue in a study.15 They found that the largest orifice diameter was in late atrial diastole with a mean decrease of 32.5% during atrial systole. They also noted location changes of the PV orifice of up to 7 mm and that the orifice was larger in the coronal (lateral–medial) than the sagittal (anteroposterior) direction. MR perfusion imaging can also be reliably used to detect anatomic and functional impact of PVS. Kluge et al16 examined this in a study of 110 patients after AF ablation. MR perfusion imaging was compared with single-photon emission CT perfusion imaging, and 51 patients with PVS were subsequently studied. They found that MRI detected 20 of 21 perfusion defects with a sensitivity of 95.2% and a specificity of 100%. They also showed a cut-off of 6 mm diameter as being significant. A PV with a diameter of less than 6 mm had substantial decrease in perfusion compared with PVs greater than 6 mm in diameter. MRA has also been used to predict the occurrence of PVS after AF ablation. In a study of 104 patients undergoing AF ablation, MRA was performed preablation and postablation. It was shown that a relative reduction in PV diameter on the day after the procedure of 25% or more was predictive of the development of PVS using multivariate analysis, with a hazard ratio of 7.1 (p < 0.0001).17 TEE is another method that may be used to aid the diagnosis of PVS, although it is not as accurate when compared with CT or MRI and is operator dependent. TEE can give accurate assessment of PV ostial anatomy and PV blood flow and is able to detect more severe stenosis of the PV as seen by changes in Doppler flow velocity. The usefulness of TTE for diagnosis of PVS was examined in a study by Jander et al.18 They showed that TEE can be reliably used to diagnose or exclude PVS if the diagnosis is restricted to a combination of elevated peak velocity (>110 cm/sec) with turbulence and little flow variation. TEE is limited by its inability to image deeply into all four PVs and is less useful in establishing the extent and location of PVS. V/Q scan is a useful technique for assessing the hemodynamic significance of PVS. It is an ideal screening tool for patients suspected of having PVS because it is widely available and easy to interpret when compared with CT or MRI scans. VQ scans can be used to characterize the physiology of blood flow within the distribution of the PVS. Under normal conditions the apparent blood flow to one third of the lung ranges from 15% to 30%. A perfusion mismatch is seen with PVS in the range of 65% to 75%, and the level of perfusion to the affected lung is seen to have diminished to less than 25% of the expected perfusion; thus with severe stenosis the blood flow within the affected PV can be decreased to as low as 3% to 4%. In a study by Nanthakumar et al,19 comparison between functional imaging using V/Q scan, anatomic imaging using CT or pulmonary venography, and hemodynamic assessment of PVS was performed. PVS resulted in decreased perfusion of the affected lobe when the resting PV–LA pressure gradient was at least 5 mmHg or when there was 80% luminal stenosis by venography or CT. When there was less than 50% stenosis, no perfusion defects were seen. Figure 19–4 shows decreased perfusion of the entire left lung in a patient with stenosis involving the left upper and lower PVs. PV angiography provides direct visualization of the degree of stenosis but is limited by its invasiveness, streaming, anatomic complexity, and high cost. A good baseline PV angiogram is required in multiple views before PV intervention. Figure 19–5, A shows a PV angiogram with stenosis involving the LSPV, and Figure 19–5, B shows the result of PV intervention. Figure 19–5 A, Stenosis involving the left superior pulmonary vein (LSPV) preintervention. The single arrow shows the SL-1 sheath, the double arrows show the multipurpose catheter, and the arrowhead is pointing to the stenosis at the LSPV ostium. B, Good flow through the previously stenosed orifice postintervention. Patients with symptoms of PVS should be treated with PV dilation with or without stent placement. This is based on data showing feasibility and success of PV dilation and stenting in a majority of patients.11–13,20 The time frame between the PV isolation procedure and development of symptoms is quite variable. In a report by Packer et al,13 in which 23 patients with 34 PV stenoses were studied pre-AF and post–AF ablation, the mean time to the development of symptoms was 103 ± 100 days. In another study, the mean time to the development of symptoms after the diagnosis of PVS was 13.5 months.21 Treatment of asymptomatic patients with PVS is a little more controversial. It has been shown that patients with 100% occlusion of a single PV may be asymptomatic. In a study by Di Biase et al,22 data from 18 patients with at least one complete occlusion of a PV were analyzed. Four (22%) patients were completely asymptomatic; reasons for lack of symptoms were attributed to activation of compensatory mechanisms and absence of stenosis in the remaining ipsilateral PVs. In asymptomatic patients studied over time, PVS has been known to progress, leading to eventual thrombotic occlusion and decrease in pulmonary arterial flow to the affected lung segment. The decline in arteriovenous gradient after PVS and decline in arterial perfusion leads to ischemia and edema of the surrounding alveoli, eventually resulting in atelectasis, pulmonary infarction, or susceptibility to infections. Treatment options in asymptomatic patients with significant PVS include PV dilation (with or without stent placement) to prevent the consequences described or close follow-up care with immediate intervention upon development of symptoms (see Figure 19–6 for a treatment algorithm for PVS). Figure 19–6 Treatment algorithm for PVS. (CT, Computed tomography; MR, magnetic resonance; PI, percutaneous intervention; PV, pulmonary vein; PVS, pulmonary vein stenosis; Sx, symptoms.) (From Holmes D, et al: Pulmonary vein stenosis complicating ablation for atrial fibrillation: clinical spectrum and interventional considerations. JACC Cardiovasc Interv 2;267-276, 2009. Reprinted with permission from Elsevier.)
Percutaneous Treatment of Pulmonary Vein Stenosis
19.1 Incidence and Prevalence of Pulmonary Vein Stenosis
19.2 Pulmonary Venous Anatomy

Shaded portions indicate parts different from typical anatomy. A, Typical branching pattern. B, Short common left trunk. C, Long common left trunk. D, Right middle PV. E, Two right middle PVs. F, Right middle and right “upper” PVs. (From Kato R, et al: Pulmonary vein anatomy in patients undergoing catheter ablation of atrial fibrillation: lessons learned by the use of magnetic resonance imaging. Circulation 107;2004-2010, 2003. Reprinted with permission from Wolters Kluwer Health.)
19.3 Clinical Presentation
19.4 Imaging Modalities
Computed Tomography and Magnetic Resonance Imaging
Transesophageal Echocardiography
Ventilation/Perfusion Scan
Pulmonary Vein Angiography
19.5 Patient Selection
![]()
Stay updated, free articles. Join our Telegram channel

Full access? Get Clinical Tree


Thoracic Key
Fastest Thoracic Insight Engine

