FIGURE 25.1. Selective contrast venography demonstrating a dilated, refluxing left ovarian vein communicating with extensive pelvic varicosities.
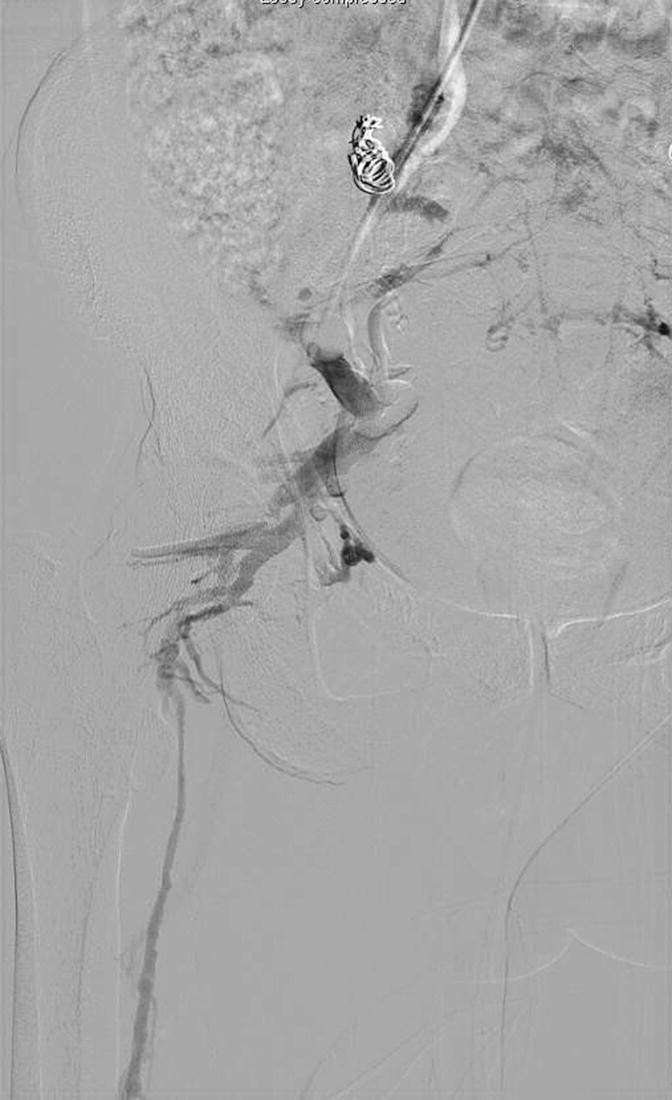
FIGURE 25.2. Balloon occlusion contrast venography demonstrating communication between internal iliac venous tributaries and the great saphenous vein.
The invasive nature of venography has led to the investigation of noninvasive imaging modalities for diagnosis of pelvic congestion syndrome. Both computed tomographic (CT) and magnetic resonance (MR) venography can be used to document compression of the left renal and iliac veins, to measure ovarian vein diameters, and to identify pelvic varices. CT- and MR-based criteria for pelvic congestion syndrome include an ovarian vein diameter greater than 8 mm and more than four tortuous parauterine veins measuring greater than 4 mm in diameter (Fig. 25.3).15 Unfortunately, standard cross-sectional imaging gives no physiologic information regarding the hemodynamic significance of reflux or obstruction, and the quality of studies varies widely between institutions.
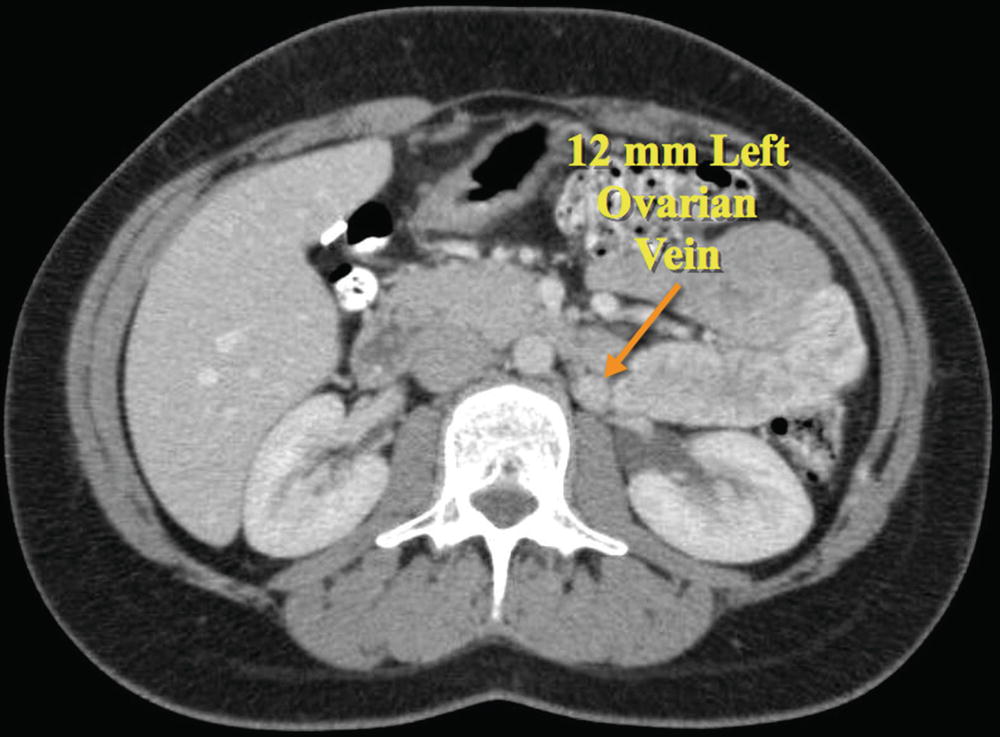
FIGURE 25.3. Computed tomographic (CT) venogram demonstrating dilation of the left ovarian vein to 12 mm in diameter (arrow). Note the position of the ovarian vein immediately above the psoas muscle.
Ultrasound provides a noninvasive means for identifying women who might benefit from diagnostic and therapeutic pelvic venography. Moreover, ultrasound can identify other conditions, such as leiomyoma or endometriosis, which are important in the diagnostic workup of the patient. Both transabdominal and transvaginal ultrasound have been widely used, sometimes in combination, for the evaluation of pelvic congestion syndrome.
ULTRASOUND TECHNIQUE
The ultrasound evaluation of pelvic congestion syndrome is performed in the fasting patient in both steep reverse Trendelenburg and standing positions. A low-frequency curved array abdominal transducer (2 to 4 MHz) is generally preferred. Setting the Doppler pulse repetition frequency high enough to prevent aliasing but low enough to detect slow venous velocities should optimize evaluation of venous flow.
The inferior vena cava and common iliac veins are initially assessed in a steep reverse Trendelenburg position. The left common iliac vein is specifically examined for evidence of compression by the right common iliac artery that may lead to reflux in the internal iliac veins (Fig. 25.4). The diameters of the internal iliac veins are measured and reflux is identified by asking the patient to perform a Valsalva maneuver, which also accentuates venous filling and improves visualization of pelvic varicosities. The normal pelvic plexus should appear as one or two straight venous structures less than 5 mm in diameter.16 Reflux in dilated parauterine veins is identified during the Valsalva maneuver and their diameters are measured. The external iliac and common femoral veins are also interrogated for evidence of reflux, obstruction, or prominent venous collaterals.
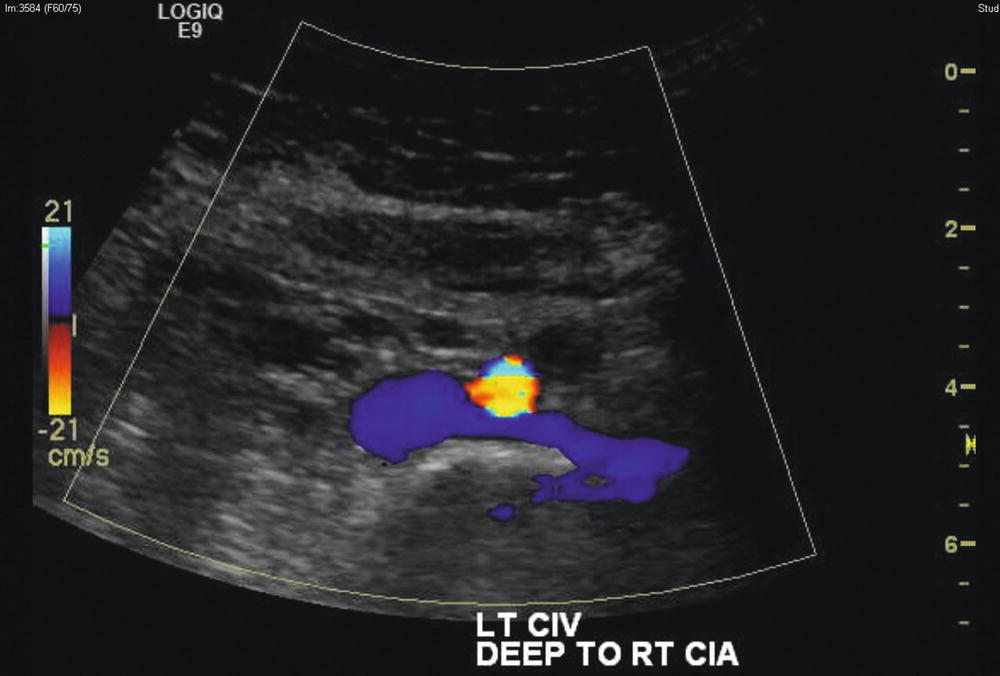
FIGURE 25.4. Cross-sectional color-flow duplex image demonstrating crossing of the left common iliac vein (blue) beneath the right common iliac artery (color aliased—yellow, orange, and blue).
The right and left ovarian veins are identified above the psoas muscle in the retroperitoneum at about the level of the fourth lumbar vertebra. The right ovarian vein is typically more difficult to identify than the left.10,16 These veins are then followed to their confluence with the inferior vena cava and left renal vein, respectively (Fig. 25.5). Alternatively, the left ovarian vein can be initially identified in the left upper abdomen in a transverse plane as it joins the left renal vein.16 Moving the transducer into a longitudinal plane demonstrates the tubular left ovarian vein as it joins the left renal vein at a right angle. The right ovarian vein can be similarly identified centrally in the abdomen at its confluence with the inferior vena cava. Vein diameters are measured along the course of both ovarian veins. Retrograde flow during a Valsalva maneuver is evaluated with both color-flow (Fig. 25.6) and spectral Doppler waveforms (Fig. 25.7).
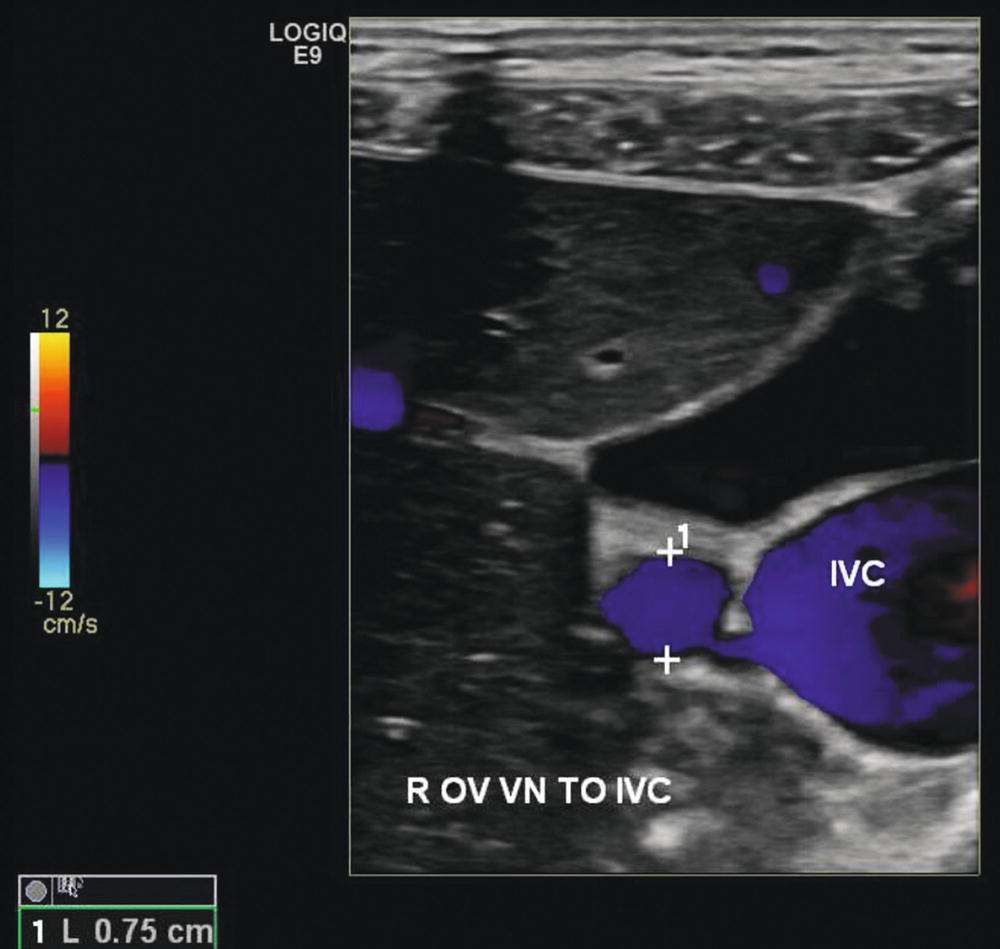
FIGURE 25.5. Color-flow duplex image demonstrating a dilated right ovarian vein at its confluence with the inferior vena cava (IVC). The right ovarian vein measures 0.75 cm in diameter. The ovarian vein is located immediately above the psoas muscle.
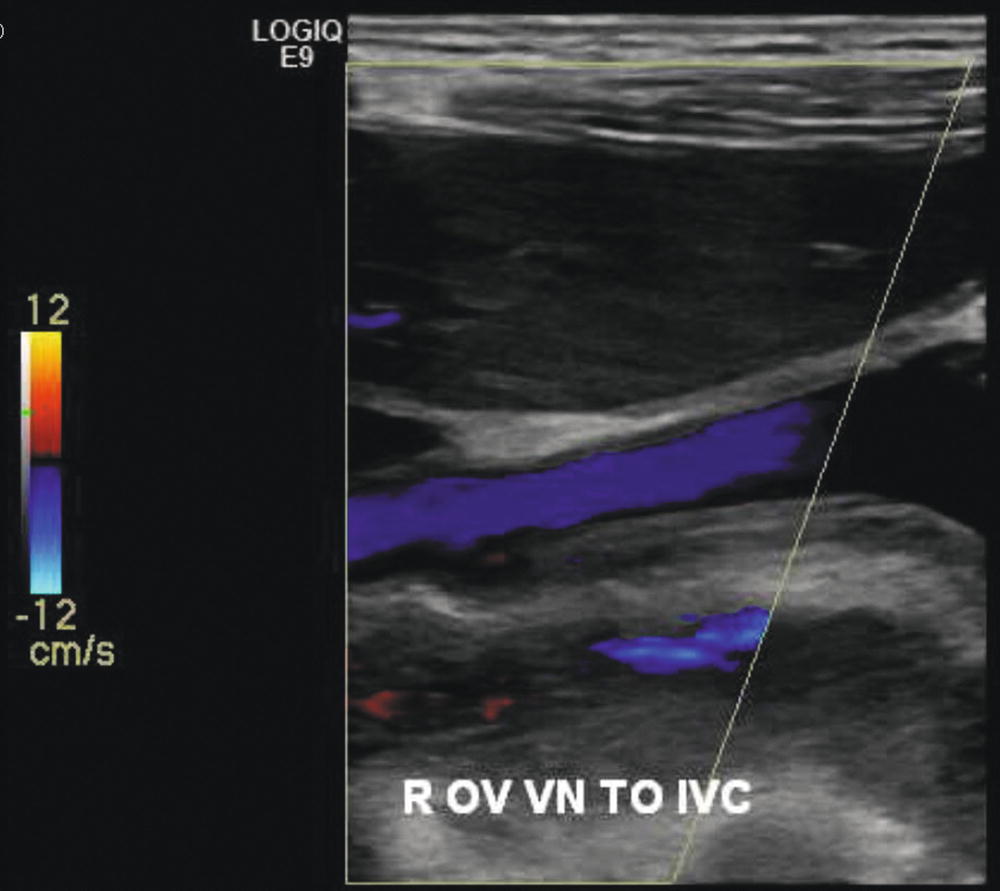
FIGURE 25.6. Color-flow duplex image demonstrating retrograde flow (reflux) in the right ovarian vein in response to a Valsalva maneuver.
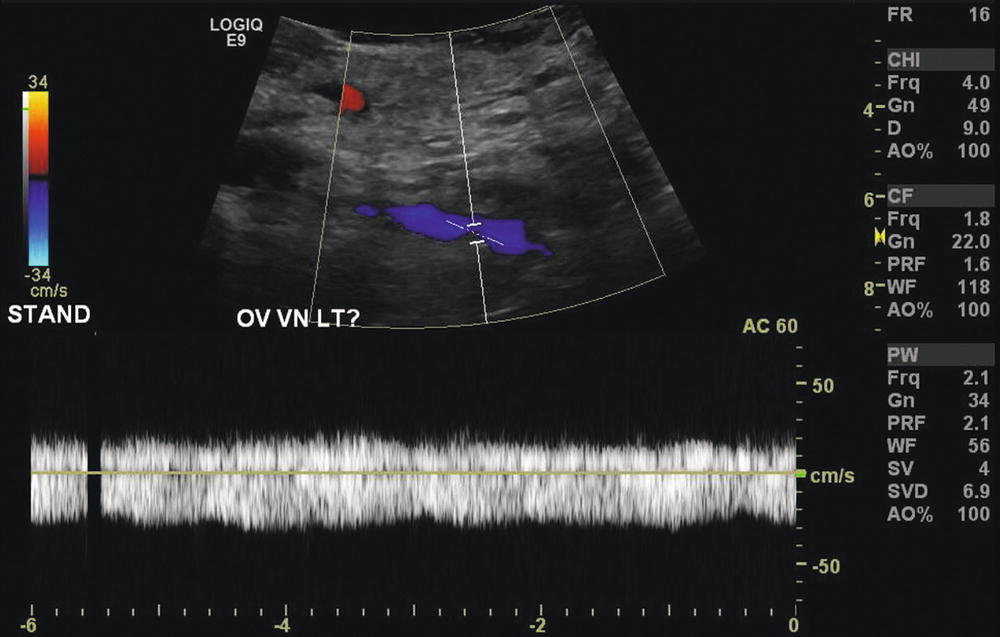
FIGURE 25.7. Doppler spectral waveform showing prolonged reflux in the left ovarian vein in response to a Valsalva maneuver.
The left renal vein should also be evaluated for evidence of aortomesenteric compression (nutcracker syndrome). The aorta and superior mesenteric artery are visualized, and the angle between the aorta and proximal superior mesenteric artery is determined in a longitudinal view (Fig. 25.8). Cross-sectional views of the aorta and superior mesenteric artery, with the left renal vein crossing between them, are then obtained in order to measure both diameters and velocities in the left renal vein on the caval side of the aorta, at the aortomesenteric angle, and on the renal side of the aorta (Fig. 25.9). Diagnostic accuracy is improved if the examination is then repeated with the patient standing, focusing on the evaluation of the internal iliac veins, ovarian veins, and left renal vein.
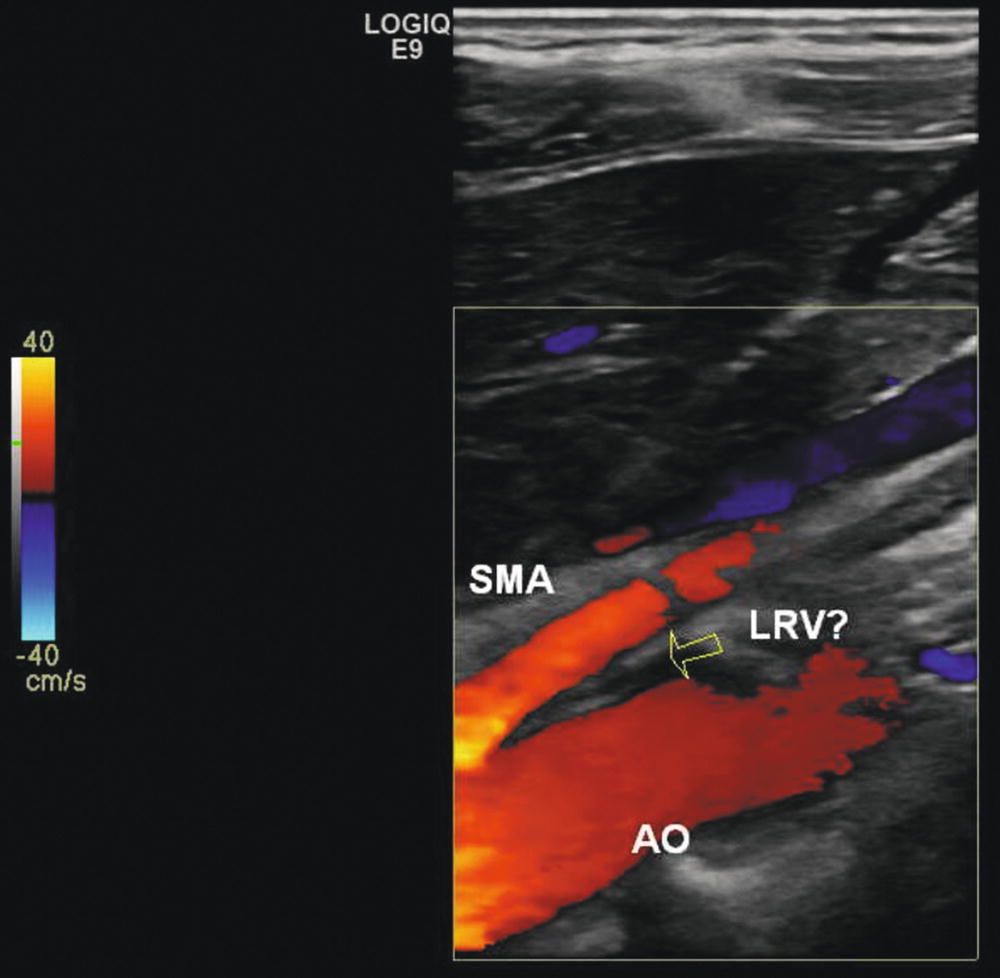
FIGURE 25.8. Longitudinal color-flow duplex image demonstrating compression of the left renal vein (LRV) within the angle formed by the superior mesenteric artery (SMA) anteriorly and the aorta (AO) posteriorly.
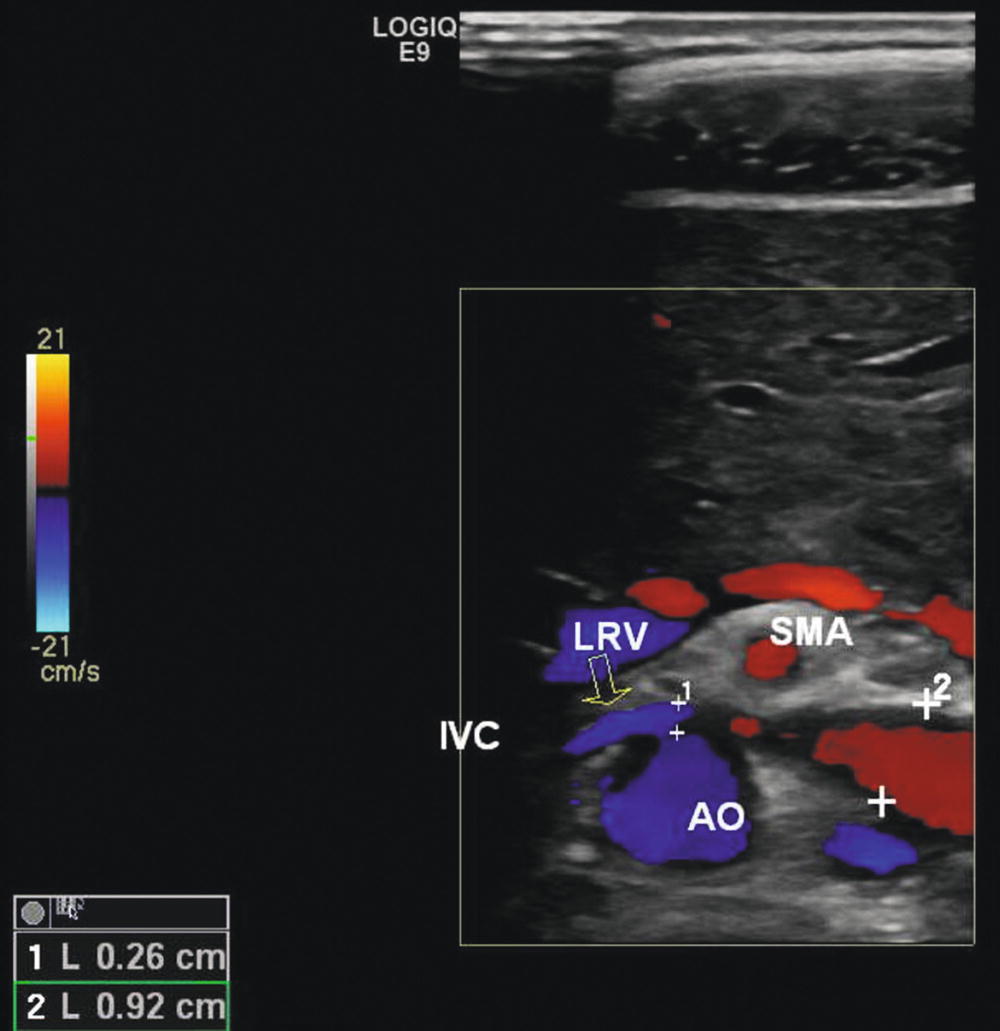
FIGURE 25.9. Cross-sectional image of the left renal vein (LRV) as it passes between the aorta (AO) and superior mesenteric artery (SMA). Velocities and diameters of the left renal vein are measured on the caval (0.26 cm diameter) and renal (0.92 cm diameter) sides of the aorta to determine the respective ratios.
Finally, if the patient presents with lower extremity varicosities, the specific pelvic escape points should be evaluated as a source.11 This should include imaging of the inguinal (I) point at the superficial origin of the inguinal canal and the perineal (P) point located at the perineal membrane. The obturator (O) point communicating with the common femoral vein and the superior and inferior gluteal (G) points at the midportion of the buttocks and infragluteal fold should similarly be assessed.
Although transvaginal ultrasound is outside the technical scope of most vascular laboratories, it does allow enhanced visualization of the pelvic venous plexus and associated anatomy.17 The transvaginal ultrasound examination for pelvic congestion syndrome is performed initially in the supine position and then repeated in a steep reverse Trendelenburg position to accentuate venous filling. A higher-frequency transducer is used than for transabdominal ultrasonography, such as a 5- to 9-MHz intracavitary probe. Performed in this manner, the transvaginal ultrasound examination is particularly helpful for evaluating the pelvic venous plexus and associated reflux, the volume of the uterus, and the presence of crossing veins in the uterine myometrium.16,18 It can also be helpful for identifying other pelvic pathologies as a cause of pelvic pain. Unfortunately, it provides little information outside of the pelvis and usually must be supplemented with transabdominal ultrasound to clearly define all sources of reflux and obstruction.10
DIAGNOSTIC CRITERIA
As discussed above, the diagnosis of pelvic congestion syndrome depends upon demonstrating complex patterns of reflux and obstruction in the ovarian and internal iliac veins as well as the femoral vein tributaries. Reflux is inferred both from an evaluation of venous diameters and demonstration of retrograde flow during the Valsalva maneuver. Park et al16 found the mean diameter of the left ovarian vein to be 0.79 cm in women with pelvic congestion syndrome as compared to 0.49 cm in women with other pelvic pathologies. Most vascular laboratories consider an ovarian vein diameter of ≥6 mm to be suggestive of ovarian vein incompetence.10,16 In comparison to CT or contrast venography, duplex ultrasound has a sensitivity of 100% and specificity of 57% for the detection left ovarian vein dilation. This is somewhat reduced for the right ovarian vein, where the corresponding sensitivity and specificity are 67% and 90%, repectively.10
The direction of flow in the left ovarian vein can be visualized in two-thirds of patients with pelvic congestion syndrome and in almost half of the patients with other pelvic pathologies.16 Retrograde flow in the left ovarian vein was found in 100% of the patients with pelvic congestion syndrome, but in only 25% of the patients who did not have pelvic congestion syndrome. Unlike the lower extremity veins, there are no validated criteria for the duration of retrograde flow that constitutes pathologic reflux in the ovarian or pelvic veins. However, when present, such retrograde flow is usually prolonged and often more than 2 seconds.10
Examination of the pelvis in patients with pelvic congestion syndrome should demonstrate dilated, tortuous veins greater than 5 mm in diameter around the ovary and uterus.16 Dilated myometrial arcuate veins may also be seen crossing the uterus. A Valsalva maneuver should produce a corresponding change in the color-flow image or spectral waveform. Among 32 patients with pelvic congestion syndrome reported by Park et al,16 pelvic varices were present in 100%, while changes in the Doppler waveform with Valsalva were variable with reversal of flow direction in only 27%.
Similar criteria have been developed for the diagnosis of pelvic congestion syndrome based upon transvaginal ultrasound.16 Dilated, tortuous parauterine veins greater than 5 mm in diameter can reliably distinguish pelvic congestion syndrome from other pelvic pathologies.16,19 Reflux is demonstrated by changes in the spectral waveform and color-flow direction with a Valsalva maneuver (Fig. 25.10). Other findings may include an increase in uterine volume and polycystic ovaries as indicators of other estrogen-dependent processes. Among those patients reported by Park et al,16 varices were identified in all patients with pelvic congestion syndrome in comparison to only 17% of women with chronic pelvic pain due to other pathologies. The mean diameter of the largest left pelvic vein was 0.68 cm in the pelvic congestion group and 0.42 cm in the control group, while the corresponding diameters of the largest right pelvic vein were 0.64 and 0.35 cm, respectively.
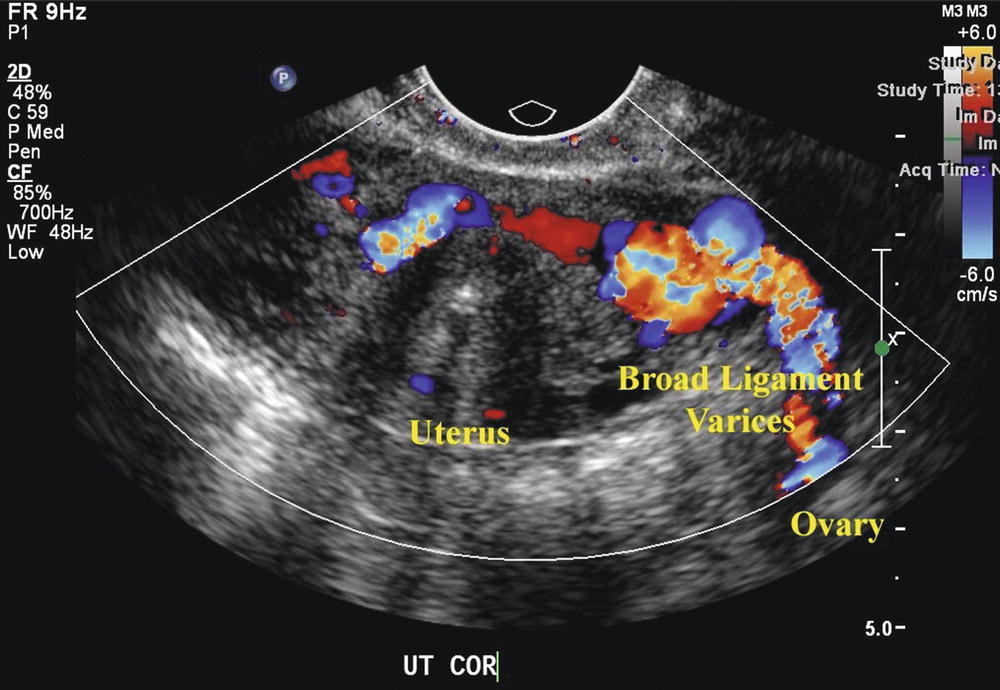
FIGURE 25.10. Transvaginal ultrasound image showing dilated parauterine varices. Reflux, as demonstrated by aliasing of the color-flow image, is seen with a Valsalva maneuver.
Stay updated, free articles. Join our Telegram channel

Full access? Get Clinical Tree


