Although left ventricular (LV) hypertrophy has been proposed as a factor predisposing to atrial fibrillation (AF), its relevance to prognosis and selection of therapeutic strategies is unclear. We identified 2,105 patients with echocardiographic data on LV mass enrolled in the Atrial Fibrillation Follow-up Investigation of Rhythm Management (AFFIRM) trial. LV hypertrophy was defined as increased LV mass, stratified by American Society of Echocardiography criteria. The primary end point was all-cause mortality, secondary end point was as per AFFIRM trial definition, and tertiary end point was cardiovascular hospitalizations. We compared “strict” versus “lenient” rate control in patients with increased LV mass, and studied association of heart failure (HF) with preserved and decreased systolic function in patients with increased LV mass. Over 6 years, 332 deaths (15.7%) were reported. Adjusted hazard ratio (HR) of severely increased LV mass for all-cause mortality was 1.34 (95% confidence interval [CI] 1.01 to 1.79, p = 0.045) for the overall population and 1.61 (95% CI 1.09 to 2.37, p = 0.016) for the rhythm-control arm. Increased LV mass was a predictor of cardiovascular hospitalizations in the lenient rate-control group (HR 1.72, 95% CI 1.05 to 2.82, p = 0.03) but not in the strict rate-control group. Severely increased LV mass was predictive of cardiovascular hospitalizations in patients with HF with preserved (HR 1.8, 95% CI 1.0 to 3.2, p = 0.03) and decreased LV systolic function (HR 2.4, 95% CI 1.1 to 5.2, p = 0.02). Thus, LV hypertrophy is a significant independent predictor of mortality in patients with AF, especially those managed with rhythm control. In patients with LV hypertrophy, strict rate control may be associated with better outcomes than lenient rate control. LV hypertrophy portends higher cardiovascular morbidity in patients with AF and HF.
From a clinical standpoint, a clear case for rhythm control or stricter rate control could be made for patients with atrial fibrillation (AF) and associated systolic or diastolic ventricular dysfunction associated with left ventricular (LV) hypertrophy, but no data are available to support either strategy. There is a need to compare various rate-control approaches in carefully defined subgroups of patients with AF. Large case registries may provide additional opportunities to evaluate therapeutic strategies in AF subgroups. Consequently, we sought to investigate whether the selection of rhythm control versus strict or lenient rate control had an impact on mortality and morbidity in patients with AF with LV hypertrophy and associated diastolic or systolic dysfunction from the Atrial Fibrillation Follow-up Investigation of Rhythm Management (AFFIRM) trial.
Methods
We performed post hoc analysis of data from patients enrolled in the AFFIRM trial. A public use, limited-access data set devoid of patient identifiers was obtained from the National Heart, Lung and Blood Institute. None of the investigators are affiliated with the National Heart, Lung and Blood Institute or participated in the AFFIRM trial. The details of the AFFIRM study have been described previously. In brief, this was a prospective trial (n = 4,060) comparing survival in patients with AF and at least 1 risk factor for stroke randomized to a strategy of rate control (n = 2,027) versus a strategy of rhythm control (n = 2,033). Eligible patients were either aged ≥65 years or had at least 1 of the following risk factors for stroke or death: hypertension, diabetes, heart failure (HF), previous stroke or transient ischemic attack, systemic embolism, left atrial diameter >50 mm by echocardiography, LV ejection fraction (EF) <0.40, or fractional shortening <25% determined by any technique.
We identified 2,105 patients with echocardiographic data on LV mass. Patients with incomplete echocardiographic data were excluded (n = 1,945). LV mass measurements were defined as per the American Society of Echocardiography’s guidelines on chamber quantification. Mass was calculated by subtraction of the LV cavity volume from the volume enclosed by the epicardium to obtain LV muscle or shell volume. The shell volume was then converted to muscle mass by multiplying by myocardial density according to the following formula :
LV mass = 0.8 × {1.04 [(LVIDd + PWTd + SWTd) 3 − (LVIDd) 3 ]} + 0.6, where LVIDd denotes left ventricular internal diastolic diameter; PWTd, posterior wall thickness at end-diastole; and SWTd, septal wall thickness at end-diastole. LV mass was categorized as normal, mildly abnormal, moderately abnormal, or severely abnormal according to the American Society of Echocardiography criteria, which varied by gender.
To assess the relation between degree of rate control and outcomes in relation to LV mass, we performed a subanalysis including patients with available LV mass data and without pacemaker insertion before randomization, originally enrolled in the rate-control arm with documented AF both at baseline and at 2-month visit, with available data of heart rate at rest at both visits. This cohort (n = 366) was stratified according to the degree of rate control, with adequately rate-controlled patients included in the strict rate-control group (n = 105) and the remainder (n = 261) in the lenient rate-control group. Adequate control at 2 months was defined as heart rate at rest ≤80 and postexercise heart rate ≤110 beats/min after 6 minutes of exercise. To maintain power in this relatively small subgroup, LV mass was classified into just 2 categories: normal or mildly increased LV mass was considered as referent and moderately or severely increased LV mass was considered as elevated LV mass.
HF was categorized as associated with either decreased (n = 258) or preserved systolic function (n = 233) based on LVEF using 50% as cutoff.
The primary end point of this analysis was all-cause mortality. The secondary end point was a composite of all-cause mortality and events including major arrhythmia, stroke, major bleeding, myocardial infarction, and pulmonary embolism. This secondary outcome was same as used in the AFFIRM trial and the definitions were consistent. The tertiary end point was hospitalization due to cardiovascular causes.
Multivariate Cox proportional hazards models were constructed that included LV mass as the major factor and were adjusted for age, gender, history of coronary artery disease or myocardial infarction, history of hypertension, HF, stroke, diabetes, smoking status, first episode of AF, sinus rhythm at the time of randomization, treatment with warfarin, angiotensin-converting enzyme inhibitor or angiotensin receptor blocker, β blocker, calcium channel blocker, amiodarone, sotalol, class I antiarrhythmic medication, left atrial size, mitral regurgitation, and LVEF. This analysis was performed for the complete cohort, and separately for those in the rate and rhythm-control arms.
Results
The baseline characteristics of the study population stratified by LV mass are summarized in Table 1 . There were 2,105 patients with echocardiographic data available with a median follow-up of 41.5 ± 15.3 months. Of these, 725 (34%) had severely increased LV mass. Patients with greater LV mass were younger, more obese, and had a greater prevalence of hypertension, coronary artery disease, systolic or diastolic HF, diabetes, and treatment with digoxin, angiotensin-converting enzyme inhibitor, or angiotensin receptor blocker. Other medications were used with equal frequencies at baseline by patients irrespective of LV mass.
| Variable | Overall Population (n = 2,105) | Normal LV Mass (n = 732) | Mildly Increased LV Mass (n = 349) | Moderately Increased LV Mass (n = 299) | Severely Increased LV Mass (n = 725) | p Value |
|---|---|---|---|---|---|---|
| Age | 69.4 ± 8.1 | 70.1 ± 8.1 | 69.6 ± 8.1 | 69.3 ± 7.9 | 68.6 ± 8.2 | 0.004 |
| Female gender | 902 (42.8) | 289 (39.4) | 163 (46.7) | 123 (41.1) | 327 (45.1) | 0.06 |
| Body mass index (kg/m 2 ) | 28.65 ± 5.91 | 26.80 ± 4.97 | 28.42 ± 5.34 | 29.33 ± 5.80 | 30.42 ± 6.52 | <0.001 |
| Medical history | ||||||
| History of coronary artery disease | 730 (34.6) | 201 (27.4) | 102 (29.2) | 119 (39.8) | 308 (42.4) | <0.001 |
| HF | 491 (23.3) | 94 (12.8) | 67 (19.2) | 80 (26.7) | 250 (34.4) | <0.001 |
| HF with preserved EF | 233 (11.0) | 62 (8.4) | 36 (10.3) | 39 (13.0) | 96 (13.2) | 0.02 |
| Hypertension | 1,494 (70.9) | 469 (64.0) | 234 (67.0) | 219 (73.2) | 572 (78.9) | <0.001 |
| Stroke | 275 (13.0) | 99 (13.5) | 45 (12.8) | 46 (15.3) | 85 (11.7) | 0.44 |
| Diabetes | 414 (19.6) | 104 (14.2) | 56 (16.0) | 69 (23.0) | 185 (25.5) | <0.001 |
| Smoker | 258 (12.2) | 87 (11.8) | 44 (12.6) | 33 (11.0) | 94 (12.9) | 0.89 |
| First episode of AF | 1,252 (59.4) | 434 (59.2) | 205 (58.7) | 189 (63.2) | 424 (58.4) | 0.55 |
| Sinus rhythm at time of randomization | 1,108 (52.6) | 424 (57.9) | 189 (54.1) | 156 (52.1) | 339 (46.7) | <0.001 |
| Duration of AF >1 month | 911 (43.28) | 317 (43.31) | 150 (42.98) | 126 (42.14) | 318 (43.86) | 0.965 |
| Medications before randomization | ||||||
| β Blockers | 897 (42.6) | 295 (40.3) | 138 (39.5) | 136 (45.4) | 328 (45.2) | 0.11 |
| Calcium channel blockers | 823 (39.1) | 280 (38.2) | 121 (34.6) | 129 (43.1) | 293 (40.4) | 0.13 |
| Digoxin | 1,130 (53.6) | 364 (49.7) | 172 (49.2) | 176 (58.8) | 418 (57.6) | 0.002 |
| Warfarin | 1,793 (85.2) | 618 (84.4) | 293 (84.0) | 259 (86.6) | 623 (85.9) | 0.67 |
| Angiotensin-converting enzyme inhibitor or angiotensin receptor blocker | 821 (39) | 226 (30.8) | 122 (34.9) | 111 (37.1) | 362 (49.9) | <0.001 |
| Amiodarone | 376 (17.8) | 139 (18.9) | 49 (14.0) | 50 (16.7) | 138 (19.0) | 0.168 |
| Sotalol | 331 (15.7) | 133 (18.1) | 52 (14.9) | 44 (14.7) | 102 (14.0) | 0.157 |
| Class I antiarrhythmics | 285 (13.5) | 111 (15.1) | 37 (10.6) | 46 (15.3) | 91 (12.5) | 0.127 |
| Echocardiographic parameters | ||||||
| Left atrial size | <0.001 | |||||
| <4 cm | 765 (36.3) | 357 (48.7) | 142 (40.6) | 87 (29.1) | 179 (24.6) | |
| 4.1–4.5 cm | 612 (29.0) | 215 (29.3) | 97 (27.7) | 88 (29.4) | 212 (29.2) | |
| ≥4.6 cm | 728 (34.5) | 160 (21.8) | 110 (31.5) | 124 (41.4) | 334 (46.0) | |
| LVEF (>50% = referent) | <0.001 | |||||
| >50% | 1,587 (75.3) | 627 (85.6) | 283 (81.0) | 219 (73.2) | 458 (63.1) | |
| 40%–49% | 262 (12.4) | 67 (9.1) | 34 (9.7) | 40 (13.3) | 121 (16.6) | |
| 30%–39% | 154 (7.3) | 27 (3.6) | 18 (5.1) | 20 (6.6) | 89 (12.2) | |
| <30% | 102 (4.8) | 11 (1.5) | 14 (4.0) | 20 (6.6) | 57 (7.8) | |
| Mitral regurgitation | 446 (21.1) | 131 (17.9) | 74 (21.2) | 66 (22.0) | 175 (24.1) | 0.03 |
| Rhythm-control arm | 1,061 (50.4) | 398 (54.3) | 150 (42.9) | 148 (49.5) | 365 (50.3) | 0.006 |
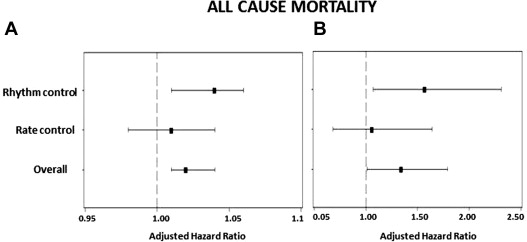
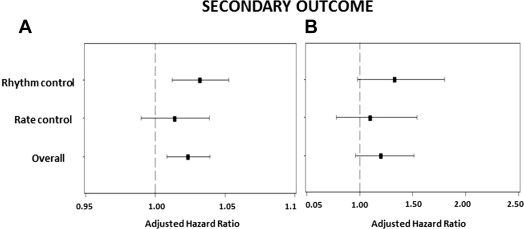
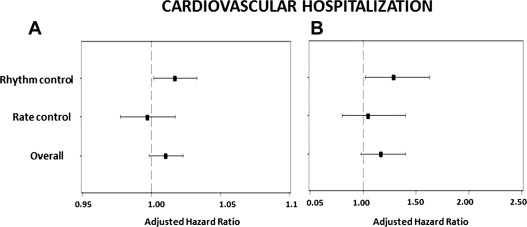
The primary outcome occurred in 332 of patients (15.7%) and the secondary outcome in 521 (24.8%). By multivariate analysis, severely increased LV mass was predictive of all-cause mortality in the complete cohort (hazard ratio [HR] 1.34, 95% confidence interval [CI] 1.01 to 1.79, p = 0.045; Table 2 , Figure 1 ). Severely increased LV mass was not predictive of the secondary outcome (HR 1.20, 95% CI 0.96 to 1.51, p = 0.1; Figure 2 ) or cardiovascular hospitalization (HR 1.17, 95% CI 0.98 to 1.40, p = 0.08; Figure 3 ) in the overall population.
| Variable | Adjusted HR | 95% CI | p Value |
|---|---|---|---|
| LV mass (normal = referent) | |||
| Mildly abnormal | 0.91 | 0.62–1.33 | 0.627 |
| Moderately abnormal | 0.98 | 0.68–1.43 | 0.935 |
| Severely abnormal | 1.34 | 1.01–1.79 | 0.045 |
| Age | 1.08 | 1.06–1.10 | <0.001 |
| History of CAD or MI | 1.44 | 1.13–1.83 | 0.003 |
| Congestive HF | 1.59 | 1.23–2.06 | <0.001 |
| Stroke | 1.68 | 1.27–2.22 | <0.001 |
| Diabetes mellitus | 1.48 | 1.15–1.91 | 0.002 |
| Smoker | 1.90 | 1.38–2.60 | <0.001 |
| Warfarin use before randomization | 0.72 | 0.53–0.97 | 0.033 |
| LVEF (>50% = referent) | |||
| 40%–49% | 1.16 | 0.83–1.60 | 0.386 |
| 30%–39% | 1.20 | 0.82–1.77 | 0.349 |
| <30% | 2.00 | 1.34–2.99 | 0.001 |
| Mitral regurgitation | 1.29 | 1.00–1.66 | 0.047 |
| Rhythm-control arm | 1.42 | 0.89–2.27 | 0.137 |


Severely increased LV mass was predictive of all-cause mortality (HR 1.57, 95% CI 1.07 to 2.31, p = 0.020) among patients in the rhythm-control arm ( Table 3 , Figure 1 ). Severely increased LV mass showed a trend of increased incidence of secondary outcome (HR 1.33, 95% CI 0.98 to 1.8, p = 0.07; Figure 2 ) and was significantly predictive of recurrent cardiovascular hospitalizations in the rhythm-control group (HR 1.29, 95% CI 1.02 to 1.63, p = 0.030; Figure 3 ). In the rate-control arm, severely increased LV mass was not predictive of all-cause mortality (HR 1.06, 95% CI 0.68 to 1.64, p = 0.80; Table 4 , Figure 1 ), secondary outcome (HR 1.10, 95% CI 0.78 to 1.54, p = 0.60; Figure 2 ) or cardiovascular hospitalizations (HR 1.05, 95% CI 0.80 to 1.40, p = 0.72; Figure 3 ).
| Variable | Adjusted HR | 95% CI | p Value |
|---|---|---|---|
| LV mass (normal = referent) | |||
| Mildly abnormal | 1.23 | 0.72–2.08 | 0.447 |
| Moderately abnormal | 1.04 | 0.61–1.78 | 0.883 |
| Severely abnormal | 1.57 | 1.07–2.31 | 0.022 |
| Age | 1.08 | 1.06–1.11 | <0.001 |
| History of CAD or MI | 1.47 | 1.05–2.06 | 0.023 |
| Stroke | 1.94 | 1.34–2.81 | <0.001 |
| Diabetes mellitus | 1.58 | 1.11–2.26 | 0.011 |
| Smoker | 1.84 | 1.17–2.90 | 0.008 |
| LVEF (>50% = referent) | |||
| 40%–49% | 1.07 | 0.67–1.72 | 0.774 |
| 30%–39% | 1.18 | 0.69–2.00 | 0.550 |
| <30% | 2.09 | 1.20–3.64 | 0.009 |
| Variable | Adjusted HR | 95% CI | p Value |
|---|---|---|---|
| LV mass (normal = referent) | |||
| Mildly abnormal | 0.66 | 0.38–1.15 | 0.141 |
| Moderately abnormal | 0.89 | 0.52–1.52 | 0.671 |
| Severely abnormal | 1.06 | 0.68–1.64 | 0.800 |
| Age | 1.07 | 1.05–1.10 | <0.001 |
| Congestive HF | 2.03 | 1.39–2.97 | <0.001 |
| Smoker | 2.10 | 1.33–3.31 | 0.001 |
| LVEF (>50% = referent) | |||
| 40%–49% | 1.21 | 0.76–1.91 | 0.426 |
| 30%–39% | 1.24 | 0.69–2.22 | 0.470 |
| <30% | 1.94 | 1.06–3.54 | 0.032 |
Stay updated, free articles. Join our Telegram channel

Full access? Get Clinical Tree


