Elevated cardiac troponin can be seen in patients with left ventricular (LV) hypertrophy and in asymptomatic subjects with a high a priori risk of cardiovascular disease (CVD). In hypertrophic cardiomyopathy (HC) troponin can be detected as well, but little is known about the contribution of LV mass, on the one hand, and the long-term risk of CVD, on the other. In an observational single-center study of 62 patients with HC, without a history of CVD, we assessed the Framingham Heart 10-year risk score (FH 10yrs ), LV mass index (LVMI) using magnetic resonance imaging, and highly sensitive cardiac troponin T (hs-cTnT). Hs-cTnT (>3 ng/L) was detectable in 74% of patients (46 of 62). Hs-cTnT was elevated in 26% (16 of 62) of patients (ninety-ninth percentile reference limit of 14 ng/L or more). From 3 to 14 ng/L, patients were older, more often had hypertension, and the FH 10yrs was higher. Hs-cTnT correlated positively with LVMI (p <0.001) and maximal wall thickness (p <0.001). In addition, LVMI and hypertension were independently associated with increasing hs-cTnT concentrations in linear regression. Using multivariate binary logistic regression, both LVMI and FH 10yrs were independently associated with detectable hs-cTnT levels. In contrast, only LVMI was associated with elevated hs-cTnT levels. In conclusion, hs-cTnT was detectable in 3 quarters and elevated in a quarter of our patients with HC. Although detectable hs-cTnT is associated with both LV mass and CVD risk, elevated hs-cTnT relates to LV mass only. This indicates that hypertrophy more than the risk of CVD seems the most important drive for hs-cTnT to occur in these patients.
Elevated cardiac troponin has been associated with left ventricular (LV) mass and the a priori risk of cardiovascular disease (CVD) in asymptomatic individuals. In patients with hypertrophic cardiomyopathy (HC), the few reports available demonstrate an association between cardiac troponin and increased LV wall thickness, LV dysfunction, and late gadolinium enhancement (LGE) with magnetic resonance imaging (MRI). However, the contribution of mass and the a priori long-term risk of CVD have never been studied. Moreover, previous studies did not address the range of detectable troponin concentrations below the upper reference limit of normal. In the present report, we describe the rate of detectable and elevated troponin (ninety-ninth percentile or more) in a well-defined population of patients with clinical HC, using a highly sensitive assay. Subsequently, we studied the association between troponin and the aforementioned variables, that is, LV cardiac mass measurements—as determined with MRI—and the Framingham Heart 10-year risk score (FH 10yrs ) as a measure of the predicted CVD risk.
Methods
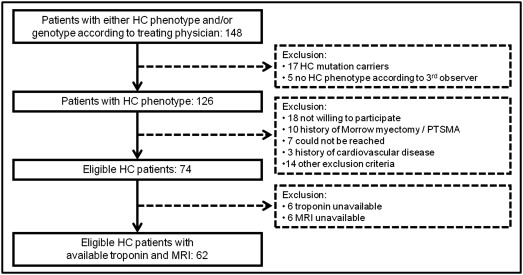
All participants were patients of a large outpatient clinic that is specialized in HC and performs mutation screening, repeated echocardiographic imaging, and clinical follow-up on a routine basis. Patients with 2-dimensional echocardiographic evidence of LV hypertrophy (maximal wall thickness ≥15 mm, or ≥13 mm in case of an identifying gene mutation and/or compelling factors associated with HC) without another cardiac or systemic cause at the time of HC diagnosis were potential candidates to participate in the present study. For each subject, the HC diagnosis was carefully reviewed. In case of a discrepancy between the treating physician and the investigators, a third opinion of an independent reviewer was decisive. Subjects with known coronary artery disease (previous myocardial infarction, >50% stenosis on coronary angiogram, previous percutaneous coronary intervention, and previous coronary artery bypass grafting), previous stroke, peripheral arterial disease, significant valvular heart disease, previous septal myectomy, or septal alcohol ablation were excluded ( Figure 1 ).
Eligible patients without contraindications for MRI (renal impairment defined as Modification of Diet in Renal Disease estimated glomerular filtration rate <30 ml/min, an implantable cardiac device, or claustrophobia) were invited to the hospital to undergo MRI according to a standard protocol. Medical history, New York Heart Association class, medication use, and echocardiographic data were recorded. Echocardiographic LV indexes were derived from an echocardiography performed within a year of the MRI study. At the day of the MRI study, a blood sample was drawn for later assessment of biomarker status and immediate determination of renal function. Whether other clinical investigations had to be performed was left to the discretion of the treating physician, who was blinded for MRI and biomarker results. For each patient, classic risk factors for CVD were collected from hospital records to calculate the FH 10yrs . The study protocol was approved by the local ethical committee. All participants provided written informed consent.
Cardiac MRI studies were performed on a 1.5-T cardiac MRI system (Achieva; Philips Healthcare, Best, The Netherlands). All images were acquired with electrocardiographic gating and during repeated breath-holds of 10 to 15 seconds, depending on the heart rate, to minimize the influence of cardiac and respiratory motion on data collection. Steady-state free precession cine imaging was used to quantify LV function (short-axis stack with slice thickness of 10 mm from base to apex) and determine myocardial mass by means of standard criteria. Segmented inversion-recovery fast gradient echo imaging was used to assess LGE 10 minutes after the administration of 0.2 mmol/kg contrast medium (Dotarem; Guerbet, Gorinchem, The Netherlands).
Images were analyzed offline using QMass software (version 7.2; Medis, Leiden, the Netherlands) by 2 observers unaware of the subjects’ clinical and biomarker information. The endocardial and epicardial borders of the myocardium were manually drawn in end-diastole and end-systole on the short-axis cine images. Volumes were derived by summation of discs, and ejection fraction was calculated accordingly. LV mass was calculated by subtracting endocardial from epicardial volume at end-diastole and multiplied by 1.05 g/cm 3 . All volumes and mass were normalized to body surface area. To evaluate maximal wall thickness, the short-axis LV stack was divided into 3 approximately equal levels (basal, mid, and apical). These levels were divided automatically by the software into the standardized 16-segment model—excluding the apex. LV wall thickness was then automatically measured per segment at end-diastole. The greatest thickness measured was recorded as the maximal wall thickness. LGE was visually assessed and determined per segment as either present or absent.
Blood samples were obtained in a standard fashion at the clinical laboratory by trained personnel, processed within 60 minutes after phlebotomy, and stored at −80°C until further analysis. For the determination of troponin T levels, the highly sensitive cardiac troponin T (hs-cTnT) assay was used and performed on the Elecsys 2010 system (Roche Diagnostics; Almere, The Netherlands). The lower measurement range of this test is 3 ng/L, the ninety-ninth percentile reference limit 14 ng/L, and the concentration with a coefficient of variation of <10% is 13 ng/L. All biochemical testing was performed by laboratory personnel who were unaware of clinical information and MRI data.
Baseline characteristics are presented according to 3 groups (troponin ≤3 ng/L, >3 and <14 ng/L, and ≥14 ng/L). For each group, means ± SD, medians (interquartile ranges), or percentages, as appropriate, were calculated. Differences among these 3 groups were analyzed using either Kruskal-Wallis 1-way analysis of variance or chi-square testing. In case of comparisons between 2 groups, either Student’s t test or the Mann-Whitney U test was used; proportions were compared using chi-square test. p Values of ≤0.05 were considered to indicate statistical significance. Spearman’s correlation was used to test for associations between continuous variables and linear regression to identify factors that are associated with hs-cTnT (transformed by natural logarithm to approximate a normal distribution). To compare the proportions of patients with detectable (>3 ng/L) and elevated troponin (≥14 ng/L) levels across tertiles of indexed LV mass and FH 10yrs , chi-square testing was performed. A similar approach was followed to compare the proportions of patients with a troponin concentration from 3 to 14 ng/L in the respective tertiles. Multivariate binary logistic regression analysis was performed to study the association between LV mass index (LVMI) and detectable and elevated troponin levels independent of the FH 10yrs .
Results
Of the cohort of 74 subjects that fulfilled the prespecified inclusion and exclusion criteria, 12 patients were excluded as either the troponin measurement or MRI failed ( Figure 1 ). The hs-cTnT concentration was ≤3 ng/L in 16 (26%), detectable but not elevated above the ninety-ninth percentile in 30 (48%), and elevated (≥14 ng/L) in 16 patients (26%). In total, troponin level above the lower range of measurement of 3 ng/L was seen in 46 patients (74%).
Baseline characteristics are presented in Table 1 . Patients with detectable but not elevated troponin concentrations (>3 and <14 ng/L) and those with elevated troponin concentrations (≥14 ng/L) were older (p = 0.02), more likely to have hypertension (p = 0.007), and have a higher FH 10yrs (p = 0.005). Patients with elevated troponin levels had a higher heart rate (p = 0.05), higher maximal wall thickness (p = 0.007), and higher LVMI (p <0.001) than patients with undetectable troponin and detectable but not elevated troponin concentrations. In the 24 patients with a history of hypertension, hs-cTnT was undetectable in only 1; without a history of hypertension, 40% (15 of 38) of patients had undetectable levels.
| Variable | Total (n = 62) | Undetectable (≤3 ng/L, n = 16) | Detectable Not Elevated (>3 and <14 ng/L, n = 30) | Elevated (≥14 ng/L, n = 16) | p Value ∗ |
|---|---|---|---|---|---|
| Age (yrs) | 54 ± 16 | 46 ± 13 | 59 ± 15 | 51 ± 19 | 0.02 |
| Men | 36 (58) | 8 (50) | 18 (60) | 10 (63) | 0.74 |
| Cardiovascular risk | |||||
| Hypertension | 24 (39) | 1 (6) | 16 (53) | 7 (44) | 0.007 |
| Current smoker | 14 (23) | 4 (25) | 7 (23) | 3 (19) | 1.0 |
| Systolic blood pressure (mm Hg) | 133 ± 24 | 129 ± 21 | 138 ± 26 | 128 ± 23 | 0.27 |
| Heart rate (beats/min) | 74 ± 13 | 72 ± 8 | 72 ± 11 | 81 ± 17 | 0.05 |
| Body mass index (kg/m 2 ) | 26 ± 3 | 26 ± 3 | 26 ± 3 | 27 ± 4 | 0.39 |
| History of atrial fibrillation | 9 (15) | 1 (6) | 4 (13) | 4 (25) | 0.31 |
| Creatinine (μmol/L) | 88 ± 16 | 83 ± 9 | 88 ± 14 | 91 ± 22 | 0.49 |
| Estimated glomerular filtration rate (ml/min) | 77 ± 19 | 81 ± 21 | 75 ± 18 | 79 ± 21 | 0.68 |
| FH 10yrs (%) | 14 (4–29) | 5 (3–11) | 21 (9–30) | 16 (1–30) | 0.005 |
| Symptoms | |||||
| Chest pain | 13 (21) | 4 (25) | 5 (17) | 4 (25) | 0.78 |
| Dyspnea (NYHA class ≥II) | 31 (50) | 6 (38) | 13 (43) | 12 (75) | 0.06 |
| Therapy | |||||
| β Blocker | 29 (47) | 5 (31) | 17 (57) | 7 (44) | 0.25 |
| Calcium antagonist | 13 (21) | 3 (19) | 8 (27) | 2 (13) | 0.61 |
| Echocardiography | |||||
| LV outflow tract gradient ≥30 mm Hg | 15 (24) | 2 (13) | 9 (30) | 4 (25) | 0.54 |
| Systolic anterior motion | 27 (44) | 6 (38) | 13 (45) | 8 (50) | 0.77 |
| Mitral valve regurgitation (mild or more) | 40 (65) | 11 (69) | 19 (63) | 10 (63) | 0.92 |
| MRI | |||||
| Maximal LV wall thickness (mm) | 18 (13–21) | 15 (13–19) | 17 (13–20) | 21 (18–24) | 0.007 |
| LV mass indexed to body surface area (g/m 2 ) | 65 (52–91) | 52 (43–70) | 64 (54–89) | 101 (67–130) | <0.001 |
| LV ejection fraction (%) | 58 (54–65) | 61 (55–66) | 58 (55–63) | 56 (50–65) | 0.46 |
| LGE present | 31 (50) | 7 (44) | 13 (43) | 11 (69) | 0.22 |
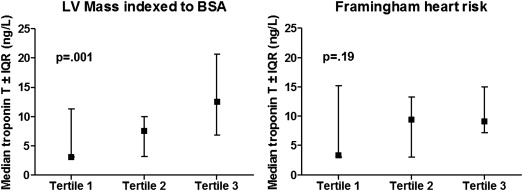
Hs-cTnT as a continuous variable correlated positively with maximal wall thickness and LVMI ( Table 2 ). With linear regression analysis, hs-cTnT, transformed by natural logarithm, was univariably associated with heart rate (p = 0.01), LV maximal wall thickness (p = 0.003), and LVMI (p = 0.001). There was a nearly significant association with hypertension (p = 0.057). In multivariable analysis, only hypertension (p = 0.048) and LVMI (p ≤0.001) were independently associated with increasing levels of hs-cTnT. The median troponin level significantly differed across tertiles of LVMI but not across tertiles of FH 10yrs ( Figure 2 ). The percentages of patients with a troponin level of>3 ng/L increased from 50% to 76% and 95% across tertiles of LVMI (p = 0.004) and from 55% to 71% and 95% with respect to FH 10yrs (p = 0.01; Figure 3 ). Across tertiles of LVMI, this increase is explained by the number of patients with elevated hs-cTnT levels (≥14 ng/L) reaching a total of 48% (10 of 21) in the highest tertile. For the FH 10yrs , a nearly significant increase in the percentage of patients with a troponin level from 3 to 14 ng/L from 30% in the lowest to 67% in the highest tertile (p = 0.063) was observed, whereas for elevated hs-cTnT, proportions were similar. In the absence of hypertension, among patients with a low LVMI (lowest tertile), only 8% (1 of 13) had elevated hs-cTnT levels in contrast to 55% (6 of 11) of patients within the highest tertile of LVMI. In univariate logistic regression analysis, LVMI and FH 10yrs were significantly associated with a hs-cTnT of >3 ng/L. Using a stepwise forward method, both FH 10yrs and LVMI had an independent association with detectable troponin levels. With respect to hs-cTnT levels ≥14 ng/L, there was a univariable association between troponin level and LVMI, maximal wall thickness, and dyspnea (New York Heart Association class ≥II) complaints. In multivariate analysis, LVMI was the single variable that was independently associated with elevated troponin levels ( Table 3 ).
| Variable | All Participants (n = 62) | |
|---|---|---|
| Spearman ρ | p Value | |
| Age (yrs) | 0.156 | 0.23 |
| Systolic blood pressure (mm Hg) | 0.022 | 0.86 |
| Heart rate (beats/min) | 0.188 | 0.14 |
| Body mass index (kg/m 2 ) | 0.173 | 0.18 |
| Creatinine level (μmol/L) | 0.148 | 0.28 |
| Estimated glomerular filtration rate (ml/min) | 0.017 | 0.90 |
| FH 10yrs (%) | 0.198 | 0.12 |
| Maximal wall thickness (mm) ∗ | 0.348 | <0.001 |
| LV mass indexed to body surface area (g/m 2 ) ∗ | 0.513 | <0.001 |
| Left ventricular ejection fraction (%) ∗ | −0.194 | 0.13 |