60 Optical Coherence Tomography
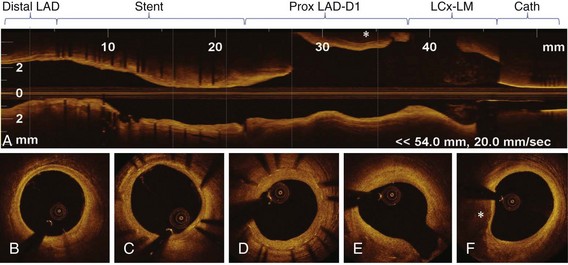
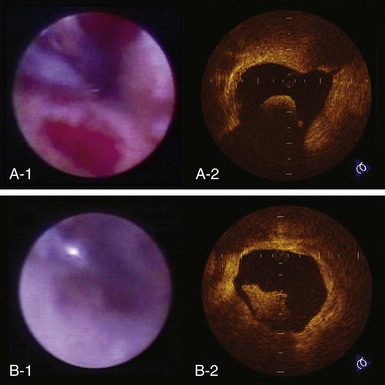
Optical coherence tomography (OCT) is an innovative real-time, tomographic imaging modality that can view microstructure in tissues. OCT delivers near-infrared light to the wall of the coronary artery through small-diameter optical fibers. The light that illuminates the vessel is absorbed and backscattered, or reflected, by the structures in tissue at different degrees, with an axial resolution of 1 to 10 microns (µm). Intravascular OCT imaging, based on advanced analysis of lesion morphology and accurate measurements, has the potential to overcome many of the limitations of conventional measures based on angiography and intravascular ultrasound (IVUS). The resolution of OCT is ideally suited for the measurement of tissue-level properties. Different tissue types have different optical properties. This makes OCT especially useful for studying the properties of tissues in ex vivo experimental models of various stages of atherosclerosis and for following plaque progression and regression and vascular response to coronary stent implantation in preclinical and clinical studies. Although its resolution is not sufficient to pick out individual cells (including regenerating endothelium), OCT is able to measure the density of cellular aggregates and to provide some information about cellular composition. For example, it has been reported that some texture characteristics in OCT images of excised coronary arteries are correlated with macrophage cell density.1 Also, fibrin deposition on stent struts, as detected by light and scanning electron microscopy (SEM), has specific attenuation characteristics in OCT.2 Recent data support the concept that OCT imaging can be used to monitor cell culture progress and cellular transformation.3 OCT provides excellent differentiation between the lumen and the arterial wall, with accurate measurements of the lumen areas and volumes as well as stent struts identification. Furthermore, quantitative measurements of the lumen, stent, and neointimal areas reveal highly reproducible results, driven by the unique resolution of this technology.4 For OCT to be accepted by the medical community, ease of use and interpretation will be required. The new generation of frequency-doman OCT (FD-OCT) has significantly improved the signal-to-noise ratio, has a superior image quality, and enables faster acquisition. FD-OCT, which can grab the entire coronary artery in a few seconds (<5 seconds), will mostly be useful in the nonocclusive, high-volume contrast flushing method, without risk of major arrhythmias. On the basis of these properties, FD-OCT will probably permit a full scan of all major coronary vessels before and after coronary interventions. This represents a significant advantage for its use in PCIs, allowing quick evaluation of the entire vessel pathology (Fig. 60-1), identification of lesions to be treated, and assessment of landing zones for guiding stent implantation. Finally, FD-OCT can be combined with adjuvant techniques, including Doppler and IVUS, and can derive enormous advantage with miniaturization.5
 Physical Principles of Optical Coherence Tomography Imaging
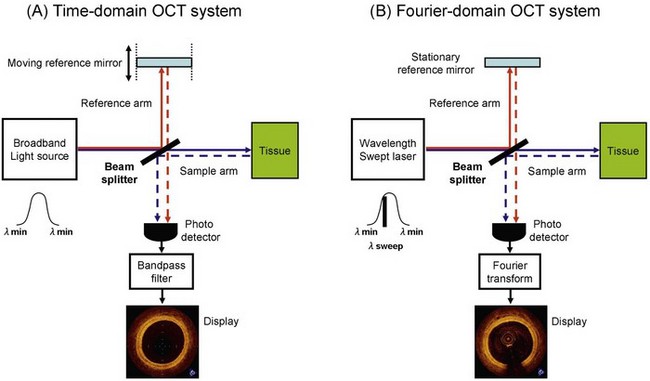
OCT’s ability to create cross-sectional images of the vessel tissue is based on optical interference of near-infrared light.6 Light is emitted and collected from the tip of a small-diameter optical fiber that rotates rapidly inside a transparent sheath. For longitudinal scanning of the vessel, a motor pulls back the fiber as it rotates within the sheath. The collected light carries information about the depth-resolved backscattering strength or reflectivity of the vascular tissue structures at the illuminated spot. Unlike ultrasound, where the depth information can be resolved by measuring the time-of-flight of acoustic reflections, light is too fast to resolve depth information by directly measuring photon time-of-flight. To overcome this, collected light is combined with a reference light beam, and lower-frequency optical interference signals are generated. These modulated interference signals can be measured with electronic components and digitally decoded to generate an optical backscattering profile (A-scan) of the tissue at the illuminated spot. Multiple backscattering profiles are collected as the catheter core rapidly rotates within the vessel. These profiles are then represented in a two-dimensional grayscale image, which is the OCT B-scan frame displayed to the user. OCT can be categorized into two approaches based on the scheme used for collecting and decoding the tissue backscattering profile from the collected light: time-domain OCT (TD-OCT) and FD-OCT (Fig. 60-2, Table 60-1). TD-OCT uses a broadband light source and a mechanically actuated sweep of the reference beam’s optical path length (approximately 3–5 mm) to generate a temporal interference signal modulation. The modulated signal intensity is directly proportional to the tissue backscattering profile and is thus straightforward to extract. Unfortunately, the requirements for mechanical actuation limit the achievable A-scan repetition rate to a few kilohertz (kHz) and the B-scan frame rate to a few tens of hertz (Hz). This, in turn, limits the total intravascular region that can be safely visualized during a transient period of blood displacement by occlusion balloon or infusion of optically transparent fluid (saline or contrast media). In FD-OCT, interference signals generated by an interferometer at different wavelengths are processed mathematically by Fourier transformation to determine the amplitudes of reflections returning from different depths. As in magnetic resonance imaging (MRI), the frequency of the recorded signal encodes the position in the image. Although this makes FD-OCT more computationally intensive, A-scan repetition rates are typically 10 to 100 times higher than those of TD-OCT and therefore allow dramatically faster B-scan frame rates (hundreds of Hz). With its careful system and catheter designs, FD-OCT provides a far more comprehensive visualization of the intravascular region during the transient blood displacement period.
TABLE 60-1 Performance of Frequency-Domain Optical Coherence Tomography System Compared with Time-Domain Optical Coherence Tomography System
| TD-OCT | FD-OCT | |
|---|---|---|
| Axial resolution (µm) | 15–20 | 15–20 |
| Lateral resolution (µm) | 25–30 | 25–30 |
| Scan diameter (mm) | 6.8 | 8.3 |
| Frame rate (frame/second) | 15–20 | 100 |
| Number of lines (/frame) | 200–240 | 450 |
| Maximum pullback speed (mm/second) | 2–3 | 20 |
| Coronary occlusion for imaging | Suggested | Not required |
FD-OCT can be further subcategorized into two approaches: swept-source OCT (SS-OCT; also known as optical frequency domain imaging [OFDI]) and spectral-domain OCT (SD-OCT). SS-OCT uses a narrowband light source whose wavelength is tuned or “swept” through a broad spectral range as a function of time. The mechanical actuation necessary to sweep the source wavelength and create interference fringe modulation is on the nanometer scale and therefore can be accomplished rapidly and in compact Micro Electro Mechanical Systems (MEMS)-based packaging. SD-OCT uses a broadband light source similar to TD-OCT but avoids the need for mechanical actuation by dispersing the broadband spectral components in a spectrometer and by capturing modulated fringes using a parallel array of detectors such as a CCD (charge coupled device) camera. Commercial and research intravascular OCT imaging systems are usually the SS-OCT type, primarily because of instrumentation cost and the complexity advantages of SS-OCT in the 1250- to 1360-nm wavelength region that is appropriate for intravascular imaging. The C7XR OCT system, manufactured by LightLab Imaging, Inc. (Westford, MA), was introduced as the first commercially available FD-OCT imaging system for coronary imaging in the European Union in 2009 and in the United States in 2010. Employing a 2.7 French (F) intravascular catheter with a rapid-exchange monorail tip, the C7XR system has a spatial resolution of 15 µm and acquires 500 axial lines per frame at a rate of 100 frames per second. At the tip of the catheter is a 125-µm–diameter optical fiber assembly that consists of an integral side-looking fiber probe. The optical assembly is encapsulated in a hollow torque wire that translates motion from a drive motor located outside the patient’s body. The C7XR system can volumetrically image a 5-cm vessel segment in approximately 3 seconds. High-speed data acquisition is a key feature of the C7XR system because it enables pull-back image acquisition during a low-volume injection of contrast medium or saline through the guiding catheter.7 The current instructions for use of the C7XR system recommend an injection of a 14-mL bolus of contrast at a rate of 4 mL/second.
Three more FD-OCT systems are in advanced phases of development and testing. The Massachusetts General Hospital (MGH) optical frequency domain imaging (OFDI) system, developed by Bouma and Tearney’s academic research group at the Wellman Center for Photomedicine, is the first of the second-generation intracoronary OCT systems to be used in vivo.8 The light source of the MGH OFDI system is a high-speed wavelength swept laser that uses a polygon-mirror or grating filter to tune over a broad bandwidth of 120 nm, centered at 1320 nm. The high speed of this laser enables cross-sectional imaging at 100 frames per second with 512 A-lines per image. The axial resolution of the MGH OFDI system is 7 µm and the ranging depth is 4.6 mm in tissue (refractive index n = 1.4). MGH also fabricates its own OFDI catheters that use an asymmetric ball lens at the tip that is custom designed to correct for aberrations in the catheter sheath. The MGH OFDI system and catheter produce very-high-resolution images; the demonstration of two-dimensional and three-dimensional images obtained from this system paved the way for the development of current commercial FD-OCT systems that are now being adopted in interventional cardiology. The Terumo OFDI system uses a 1.3-µm scanning laser as a light source. The imaging range is 5 mm with an axial resolution of less than 20 µm in the water. The OFDI catheter (2.4F crossing profile) is a short monorail design for a 0.014-inch guidewire and contains the imaging core rotating within a sheath. The imaging core rotates at a speed of 9600 revolutions per minute (rpm) allowing imaging at 160 frames per second. Up to 150 mm pull-back in length is supported at the maximum pull-back speed of 40 mm per second.
Image Acquisition
With TD-OCT, an occlusive technique is normally adopted to clear blood from the artery. An occlusion balloon (Helios Goodman, Advantec Vascular, Sunnyvale, CA) compatible with 6F guiding catheters (0.071-inch inner diameter) is advanced distal to the segment to be imaged over a conventional angioplasty guidewire. The guidewire is then replaced by the 0.019-inch OCT ImageWire (LightLab Imaging, Westford, MA). The occlusion balloon is repositioned proximal to the segment and inflated at low pressure (0.4–0.7 atmosphere [atm]), while flushing low volume (rate of 0.5–1.0 mL/second) of saline or Ringer’s lactate solution through the distal lumen of the balloon. Images are acquired with an automated pull-back at a rate of 1 to 3 mm per second, generating 15 frames per second. Yamaguchi et al evaluated the safety and feasibility of OCT in 76 patients.9 Procedural success rates were 97%, and no significant adverse events, including vessel dissection or fatal arrhythmia, were observed. Recently, a nonocclusive technique for OCT image acquisition has been developed as an alternative to the balloon-occlusion technique.10 This nonocclusive technique, based on manual or injector infusion of contrast media or Dextran 40 and Ringer’s lactate solution (Low Molecular Dextran L Injection®, Otsuka Pharmaceutical Factory, Tokushima, Japan) through the guiding catheter, simplifies the complex balloon-occlusion technique. Barlis et al reported data on 468 patients across six European medical centers, with occlusive and nonocclusive flushing techniques.11 Transient chest pain and QRS widening or ST segment depression or elevation were observed in 48% and 46%, respectively. Major complications during OCT imaging included ventricular fibrillation (1.1%) caused by balloon occlusion, deep guiding catheter insertion, air embolism (0.6%), and vessel dissection (0.2%), or all. There was no major adverse cardiac event (MACE) within the 24 hours after OCT examination.
The imaging catheters of FD-OCT, which are designed for rapid-exchange delivery, have a 2.4F to 2.8F crossing profile and can be delivered over a 0.014-inch guidewire through a 6F or larger guiding catheter. Injecting saline, angiographic contrast media, or a mixture of contrast and saline through the guiding catheter (4–6 mL/second, 2–3 seconds) can achieve effective clearing of blood for FD-OCT imaging.7 Because of its very high speed of pull-back, FD-OCT has the ability to scan longer segments of artery in a few seconds, without the need to occlude the vessel, showing minimal ischemic electrocardiogram (ECG) changes and no major arrhythmias during image acquisition.12
Artifacts
Some artifacts are common in both OCT and IVUS, and others are unique to OCT imaging systems.6 Residual blood attenuates the OCT signal. Nonuniform rotational distortion results in focal image loss or shape distortion. Sew-up artifact is the result of rapid artery or imaging wire movement in one frame’s image formation, leading to single point misalignment of the lumen border. Saturation artifact occurs when light reflected from a highly specular surface such as stent struts produces signals with amplitudes that exceed the dynamic range of the data acquisition system. Fold-over artifact is more specific to the new generation of FD-OCT. It is the consequence of the “phase wrapping” or “alias” along the Fourier transformation when structure signals are reflected from outside the system’s field of view. Bubble artifact occurs when small air bubbles are formed in the sheath of the ImageWireTM and it can attenuate the signal along a region of the vessel wall. Eccentricity of the ImageWire in the vessel lumen may result in the “sunflower effect” or the “merry-go-round artifact.” Eccentric wire position can distort the image at the far site from ImageWire, leading to longer distance between A-lines and consequently decreasing the lateral resolution.
Image Interpretation
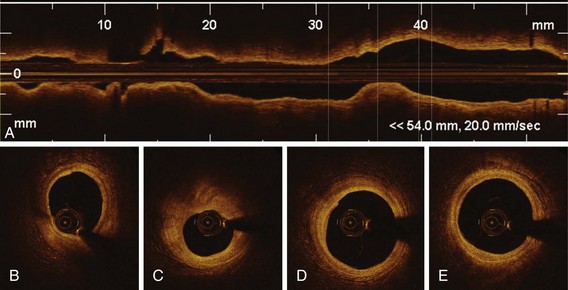
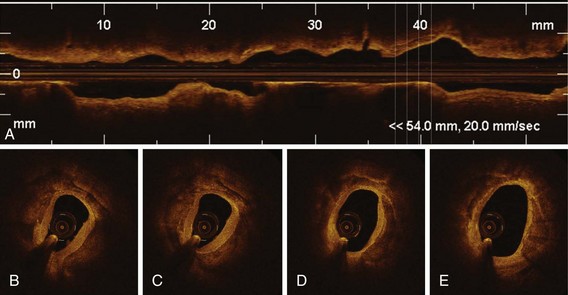
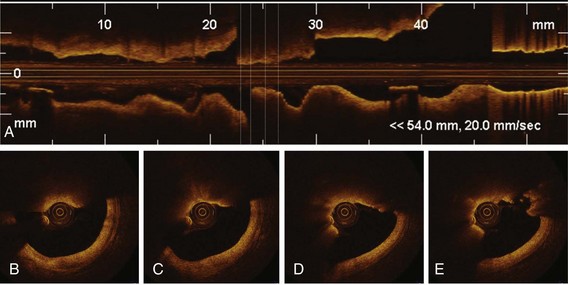
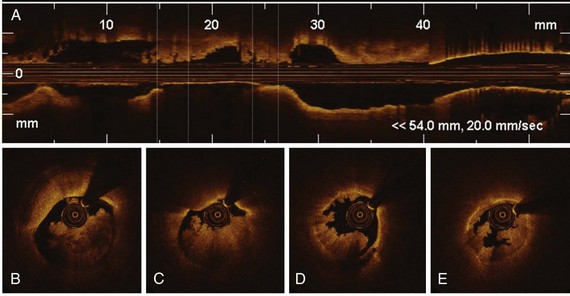
The high resolution of OCT allows us to identify the boundary of the intima and the media within the coronary arterial wall, which could not be distinguished by IVUS. In the OCT image, the intima is observed as a signal-rich layer nearest the lumen, and the media is visualized as a signal-poor middle layer (Table 60-2). The OCT measurement of intimal thickness is well correlated to histologic examination.13 OCT has an ability to evaluate subtle intimal thickening in vivo, which is the early phase of coronary atherosclerosis. Several histologic examinations demonstrated that OCT is highly sensitive and specific for plaque characterization (Fig. 60-3 to 60-5).14 Yabushita et al developed objective OCT image criteria for differentiating distinct components of atherosclerotic tissue.15 In their histology-controlled OCT study with 357 autopsy segments from 90 cadavers, fibrous plaques were characterized by homogeneous signal-rich regions, fibrocalcific plaques by signal-poor regions with sharp borders, and lipid-rich plaques by signal-poor regions with diffuse borders (see Table 60-2). Validation tests revealed significant intra- and interobserver reliability (κ = 0.83–0.84) as well as excellent sensitivity and specificity—71% to 79% and 97% to 98% for fibrous plaques, 95% to 96% and 97% for fibrocalcific plaques, and 90% to 94%, and 90% to 92% for lipid-rich plaques, respectively. These definitions have formed the basis of plaque composition interpretation. Using these definitions, Kawasaki et al reported that OCT has a best potential for tissue characterization of coronary plaques compared with integrated backscatter IVUS and conventional IVUS (fibrous tissue: sensitivity—98% vs. 94% vs. 93%, specificity—94% vs. 84% vs. 61%; calcification: sensitivity—100% vs. 100% vs. 100%, specificity—100% vs. 99% vs. 99%; lipid pool: sensitivity—95% vs. 84% vs. 67%, specificity—98% vs. 97% vs. 95%, respectively).16 OCT characteristics of coronary thrombi were studied by Kume et al in 108 coronary arterial segments at postmortem examination.17 White thrombi were identified as signal-rich, low-backscattering protrusions in the OCT image, and red thrombi were identified as high-backscattering protrusions inside the lumen of the artery, with signal-free shadow (see Table 60-2)(Fig. 60-6 to 60-8). Using a measurement of the OCT signal attenuation within the thrombus, the authors demonstrated that a cut-off value of 250 µm in the half width of signal attenuation can differentiate white thrombi from red thrombi with a high sensitivity (90%) and specificity (88%). A further unique aspect of OCT is its ability to visualize the macrophages. Tearney et al proposed the potential of OCT to assess macrophage distribution within fibrous caps.18 There was a high degree of positive correlation between OCT and histologic measurements of fibrous cap macrophage density (r <0.84, P <0.0001). A range of OCT signal standard deviation thresholds (6.15%–6.35%) yielded 100% sensitivity and specificity for identifying caps containing greater than 10% CD68 staining.
TABLE 60-2 Optical Coherence Tomography Image Characteristics
| Histology | OCT |
|---|---|
| Intima | Signal-rich layer near lumen |
| Media | Signal-poor layer in middle of artery wall |
| Adventitia | Signal-rich outer layer of artery wall |
| Fibrotic tissue | Homogenous, high reflectivity, low attenuation |
| Calcification | Sharp edges, low reflectivity, low attenuation |
| Lipid | Diffuse edges, high reflectivity, high attenuation |
| Red thrombus | Medium reflectivity, high attenuation |
| White thrombus | Medium reflectivity, low attenuation |
