Measure
Value (20 cc bolus)
Age < 65 years
Age ≥ 65 years
Oropharyngeal transit time (s)
0.23
0.42
Hypopharyngeal transit time (s)
0.64
0.77
Airway closure duration (s)
0.72
0.85
PES opening duration (s)
0.50
0.64
Laryngeal elevation (cm)
1.25 (male), 1.07 (female)
1.58 (male), 1.23 (female)
PES opening (lateral, cm)
0.90
0.80
PES opening (anterior–posterior, cm)
1.69 (male), 1.35 (female)
1.54 (male), 1.40 (female)
Pharyngeal area (hold, cm2)
7.2 (male), 6.5 (female)
11.4 (male), 8.1 (female)
Pharyngeal constriction ratio
0.06 (male), 0.03 (female)
0.28 (male), 0.14 (female)
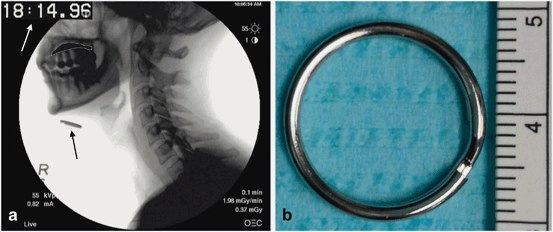
In order to accurately determine objective measures from fluoroscopic examinations, the studies must be acquired with uniform body positioning, barium density, distance to the imaging source, consistent resolution and capture rates, and the use of quality recording and reviewing equipment. Performing each study according to a standardized protocol is essential to ensure a high degree of precision and reproducibility (Chap. 2) . Most measures are made from the sequence when the largest bolus (usually 20 cc) is swallowed. Although normative data are available for smaller bolus sizes, these measurements have less clinical utility than assessment with larger volumes. Acquiring timing measures requires a counter that displays time to the hundredth second superimposed on the fluoroscopic recording; we use the Horita Video Stopwatch VS-50 (Horita, Mission Vijeo, CA) (Fig. 7.1). If this equipment is not available, timing measures may be calculated by hand when frame number and rates are known. Most measures are obtained in the lateral fluoroscopic view and require two frames for comparison. The first frame is the “hold” or “pseudo-rest” position, which is obtained while the subject holds a 1 cc bolus in the mouth (Fig. 7.1a). Holding the 1 cc bolus in the oral cavity provides a standardized anatomic position for reproducible assessment . The comparison image is the frame at maximum displacement of the structure of interest (hyoid, larynx, pharynx). Obtaining displacement measures requires the use of digital measuring software; at our center, we use Universal Desktop Ruler for distance determination (http://www.avp.soft) and ImageJ for area calculation (http://rsbweb.nih.gov/ij). Pixels that are digitally measured using these programs are converted to centimeters through calibration. In order to calibrate the onscreen tools, a ring of known diameter is placed on the chin (lateral view, Fig. 7.1a) or neck (anterior–posterior view) for reference. A keychain, washer, or coin may be used for this purpose (Fig. 7.1b) .

Fig. 7.1
Lateral fluoroscopic view representing the “hold” or reference position, obtained while the subject holds a 1-cc bolus in the mouth (white dotted line). Also shown is a counter measuring time to one-hundredth of a second (white arrow) and a ring 1.9 cm in diameter (black arrow). Same ring placed for calibration
The objective assessment of the VFSS is broadly classified into measurements of timing, displacement, and area (Table 7.2). Timing measures (in seconds) are further subclassified into bolus transit times and timing of anatomic structure movement .
Table 7.2
Measures of timing, displacement, and area
Measure | Definition |
|---|---|
Timing (s) | |
Oropharyngeal transit time | Time from when bolus head first passes posterior nasal spine to time bolus head enters base of vallecula (Fig. 7.2) |
Hypopharyngeal transit time | Time from when bolus head exits the vallecula to time when bolus tale exits PES (Fig. 7.3) |
Total pharyngeal transit time | The addition of oropharyngeal and hypopharyngeal transit times |
Airway closure duration | Time from when arytenoid cartilage approximates petiole of epiglottis to when epiglottis returns to its preswallow resting position (Fig. 7.4) |
PES opening duration | Time from when PES first opens for bolus entry to when it first closes behind the bolus (Fig. 7.5) |
Displacement (cm) | |
Maximum laryngeal elevation | Difference of the distance between the hyoid and larynx at rest and at maximum approximation (Fig. 7.6) |
PES opening (lateral) | Distance at the narrowest point of opening between C3 and C6 on lateral fluoroscopic view (Fig. 7.7) |
PES opening (anterior–posterior) | Distance at the narrowest point of opening between the pharynx and esophagus on anterior–posterior view (Fig. 7.8) |
Area (cm 2 ) | |
Maximum pharyngeal area | Pharyngeal area in hold position (Fig. 7.9a) |
Pharyngeal constriction ratio
Stay updated, free articles. Join our Telegram channel
Full access? Get Clinical Tree
 Get Clinical Tree app for offline access

| |