James E. Udelson, Vasken Dilsizian, Robert O. Bonow
Nuclear Cardiology
The era of noninvasive radionuclide cardiac imaging in humans began in the early 1970s with the first reports of noninvasive evaluation of myocardial blood flow at rest. Since that time, major advances have been achieved in the technical ability to image cardiac physiology and pathophysiology, including that of myocardial blood flow, myocardial metabolism, and ventricular function. Just as important has been a major growth in the understanding of how to apply the image information to care of patients and the effect of that information on clinical decision making. Ultimately, the role of information derived from any imaging procedure is to enhance the clinician’s decision-making process for amelioration of symptoms or improvement of clinical outcomes or both.
Technical Aspects of Image Acquisition, Display, and Interpretation
Single Photon Emission Computed Tomography Imaging of Perfusion and Function
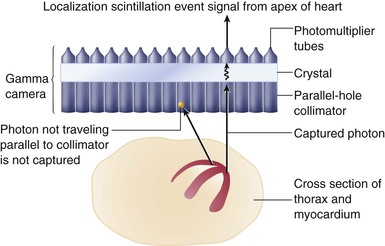
The most commonly performed imaging procedure in nuclear cardiology is single photon emission computed tomography (SPECT) myocardial perfusion imaging (MPI). After injection of the chosen radiotracer, the isotope is extracted from the blood by viable myocytes and retained within the myocyte for some time. Photons are emitted from the myocardium in proportion to the magnitude of tracer uptake, in turn related to perfusion. The standard camera used in nuclear cardiology studies, a gamma camera, captures the gamma ray photons and converts the information into digital data representing the magnitude of uptake and the location of the emission. The photoemissions collide along their flight path with a detector crystal. There, the gamma photons are absorbed and converted into visible light events (a scintillation event). Emitted gamma rays are selected for capture and quantitation by a collimator attached to the face of the camera detector system. Most often, parallel-hole collimators are used so that only photon emissions coursing perpendicular to the camera head and parallel to the collimation holes are accepted (Fig. 16-1). This arrangement allows appropriate localization of the source of the emitted gamma rays. Photomultiplier tubes, the final major component in the gamma camera, sense the light scintillation events and convert the events into an electrical signal to be further processed (see Fig. 16-1). The final result of SPECT imaging is the creation of multiple tomograms, or slices, of the organ of interest, composing a digital display representing radiotracer distribution throughout the organ.1 With SPECT MPI, the display represents the distribution of perfusion throughout the myocardium.
New Technology: High-Speed SPECT Imaging
High-speed SPECT technology introduces a new design of SPECT in terms of both photon acquisition and reconstruction algorithms. Standard SPECT imaging with collimators using a parallel-hole design is inherently inefficient, as only a relatively small proportion of the camera and collimator surface area is used to capture photons emitted from the heart. Advances in camera and collimator technology have substantially increased the efficiency of count capture, by design features that allow much of the available detector area to image the cardiac field of view, increasing count sensitivity many-fold. One approach uses a series of small, pixilated solid-state detector columns with cadmium zinc telluride or cessium iodide : thallium crystals, which provide considerably more information for each detected gamma ray. In addition, the design of the solid-state detector with wide-angle tungsten collimators combined with a novel image reconstruction algorithm provides true three-dimensional, patient-specific images localized to the heart.3 Compared with the conventional SPECT cameras, the high-speed SPECT systems can provide up to eightfold increase in count rates, thereby reducing imaging times significantly from 14 to 15 minutes with a conventional Anger camera to 5 to 6 minutes with the newer solid-state cameras while achieving a twofold increase in spatial resolution from 9 to 11 mm for Anger cameras to 4.3 to 4.9 mm for cadmium zinc telluride cameras.
In addition to advances in camera technology, software driving image reconstruction has also evolved. One technique, known as resolution recovery, improves spatial resolution while at the same time reducing noise in the images. Thus studies acquired over a much shorter period of time when reconstructed using these techniques can yield images with the same signal-to-noise ratio as those acquired and reconstructed with standard techniques and timing.4 Reduced imaging times should translate to improved patient comfort and satisfaction as well as less motion and fewer motion artifacts. An additional advantage of high-speed SPECT imaging is the potential for administration of lower doses of radiopharmaceuticals without sacrificing image resolution and quality, thereby reducing radiation dose to patients. The reduced imaging time in concert with reduced radiopharmaceutical doses may be cost-effective, with implications for future appropriateness of SPECT imaging.5
SPECT Perfusion Tracers and Protocols
Thallium-201
Thallium-201 (201Tl) was introduced in the 1970s and propelled the clinical application of MPI as an adjunct to exercise treadmill testing. 201Tl is a monovalent cation with biologic properties similar to those of potassium. Because potassium is the major intracellular cation in muscle and is virtually absent in scar tissue, 201Tl is a well-suited radionuclide for differentiation of normal and ischemic myocardium from scarred myocardium.6 201Tl emits 80 keV of photon energy and has a physical half-life of 73 hours. The initial myocardial uptake early after intravenous injection of thallium is proportional to regional blood flow. First-pass extraction fraction (the proportion of tracer extracted from the blood as it passes through the myocardium) is high, in the range of 85%. It is transported across the myocyte cell membrane by the Na+,K+–adenosine triphosphatase (ATPase) transport system and by facilitative diffusion. Peak myocardial concentration of thallium is achieved within 5 minutes of injection, with rapid clearance from the intravascular compartment. Although the initial uptake and distribution of thallium are primarily a function of blood flow, the subsequent redistribution of thallium, which begins within 10 to 15 minutes after injection, is unrelated to flow but is related to the rate of its clearance from myocardium, linked to the concentration gradient between myocyte levels and blood levels of thallium (Fig. 16-3A). Thallium clearance is more rapid from normal myocardium with high thallium activity than from myocardium with reduced thallium activity (ischemic myocardium), a process termed differential washout (Fig. 16-3B).
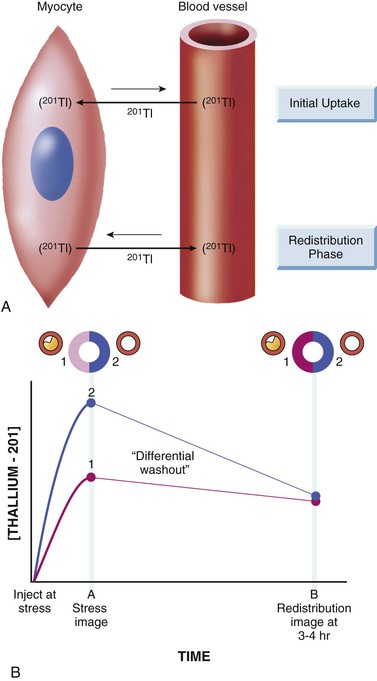
Thallium studies can be divided into protocols in which 201Tl is administered during stress and those in which it is given with the subject at rest.6 After stress, the reversal of a thallium defect from the initial peak stress to delayed 3- to 4-hour or 24-hour redistribution images is a marker of reversibly ischemic, viable myocardium. When thallium is injected in the resting state, the extent of thallium defect reversibility from the initial rest images to delayed redistribution images (at 3 to 4 hours) reflects viable myocardium with hypoperfusion at rest. When scarred myocardium is present, the initial rest or stress thallium defect persists over time; such deficits are termed irreversible or fixed defects. However, in some patients with coronary artery disease (CAD), the initial uptake of thallium during stress may be severely decreased, and tracer accumulation from the recirculating thallium in the blood during the redistribution phase may be slow or even absent because of rapid decline of thallium levels in the blood. The result is that some severely ischemic but viable regions may show no redistribution on either early (3- to 4-hour) or late (24-hour) imaging, even if viable myocardium is present. Viable myocardium in this situation can be revealed by raising blood levels of thallium by reinjection of a small dose (1 to 2 mCi) of thallium at rest. Thus, in some patients, thallium reinjection is necessary to identify viable myocardium when there are irreversible defects on stress-redistribution images.
Technetium 99m–Labeled Tracers
Technetium 99m (99mTc)–labeled myocardial perfusion tracers were introduced in the clinical arena in the 1990s.6 99mTc emits 140 keV of photon energy and has a physical half-life of 6 hours. Despite the excellent myocardial extraction and flow kinetic properties of 201Tl, its energy spectrum of 80 keV is suboptimal for conventional gamma cameras (ideal photopeak in the 140-keV range). In addition, the long physical half-life of 201Tl (73 hours) limits the amount of 201Tl that may be administered to stay within acceptable radiation exposure parameters. Thus 99mTc-labeled tracers improve on these two limitations of 201Tl. Although three 99mTc-labeled tracers—sestamibi, teboroxime, and tetrofosmin—have received U.S. Food and Drug Administration (FDA) approval for detection of CAD, only sestamibi and tetrofosmin are available for clinical use at present.
Sestamibi and tetrofosmin are lipid-soluble cationic compounds with first-pass extraction fraction in the range of 60%. Myocardial uptake and clearance kinetics of both tracers are similar. They cross sarcolemmal and mitochondrial membranes of myocytes by passive distribution, driven by the transmembrane electrochemical gradient, and they are retained within the mitochondria.6 Redistribution of these tracers is minimal compared with that for thallium. Consequently, myocardial perfusion studies with 99mTc-labeled tracers require two separate injections, one at peak stress and the second at rest.
Three basic protocols7 with 99mTc-labeled tracers have been used: (1) a single-day study, in which myocardial blood flow is interrogated at rest and at peak stress, or in the reverse order, as long as the first injected dose is low (8 to 12 mCi) and the second injected dose is high (24 to 36 mCi); (2) a 2-day study (commonly performed in patients with large body habitus), in which higher doses of the tracer are injected (24 to 36 mCi) both at rest and at peak stress to optimize myocardial count rate; and (3) a dual-isotope technique, in which injection of 201Tl at rest is followed by injection of a 99mTc tracer at peak stress. The last approach takes advantage of the favorable properties of each of the two tracers, including the high-quality gated SPECT images obtained with 99mTc and the potential to acquire redistribution images with 201Tl (either at 4 hours before the stress study or at 24 hours after the 99mTc activity has decayed). A comparison of the properties of the available isotopes for perfusion imaging is presented in Table 16-1.
SPECT Image Interpretation and Reporting.
SPECT myocardial perfusion images may be evaluated visually. The interpreter describes the perfusion pattern findings on stress and then visually interprets whether defects observed on the stress images are or are not reversible. Because the imaging data are digital, computer-aided quantitative analysis also may be used. Validated software programs for semiquantitative or fully automated quantitative analysis of SPECT myocardial perfusion images are now widely available.
General Principles of Interpretation and Reporting.
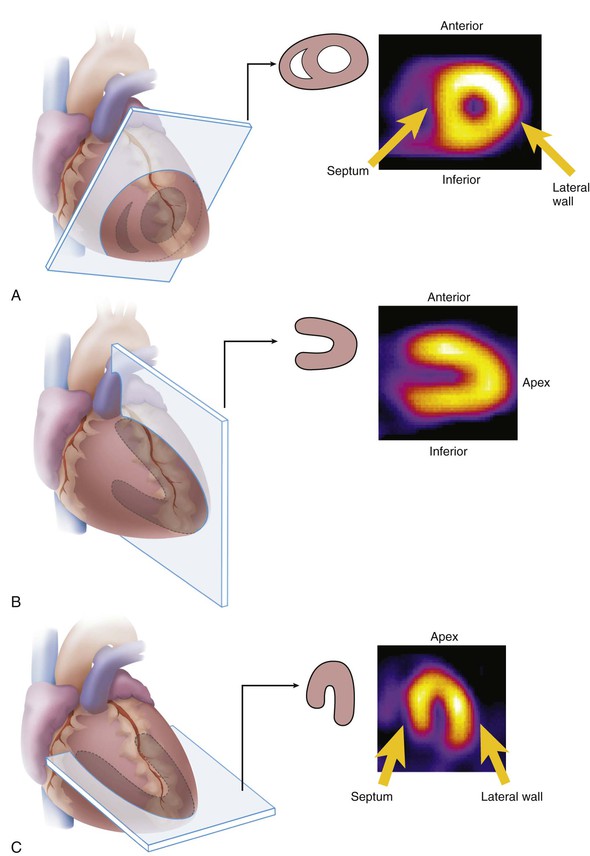
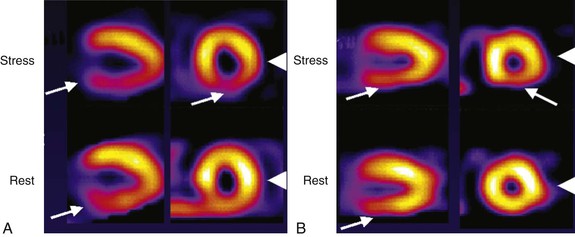
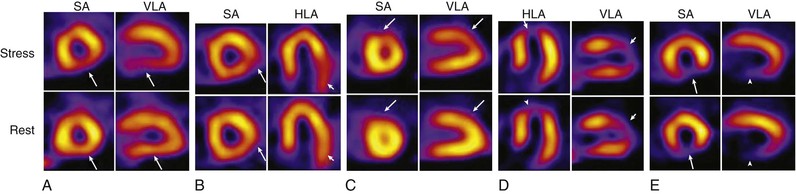
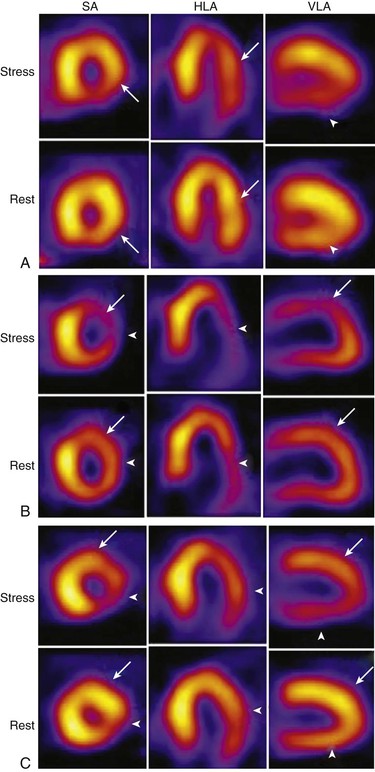
For any type of image interpretation, visual or quantitative, the key elements to be reported include the presence and location of perfusion defects and whether defects on stress images are reversible on the rest images (implying stress-induced ischemia) or whether stress perfusion defects are irreversible or fixed (often implying myocardial infarction [MI]). Moreover, substantial literature has documented that the extent and the severity of the perfusion abnormality are independently associated with clinical outcomes (risk of adverse events over time) and thus contribute importantly to the information on risk stratification to be conveyed to the ordering clinician.8 The extent of perfusion abnormality refers to the amount of myocardium or vascular territory that is abnormal, and the severity refers to the magnitude of reduction in tracer uptake in abnormal zone relative to normal. Examples of stress and rest SPECT myocardial perfusion abnormalities of varying extents and severities are shown in Figures 16-4 to 16-6. These concepts imply that it is not sufficient to describe a stress perfusion imaging test as simply “abnormal.” Rather, a clinically relevant interpretation will include a description of the magnitude of abnormality as well as the extent of ischemia, extent of infarct, and localization to specific myocardial regions or vascular territories. The final report will incorporate all of the clinical data, the stress testing result, and the imaging data to provide comprehensive information to the referring clinician, in a timely and clinically meaningful way.
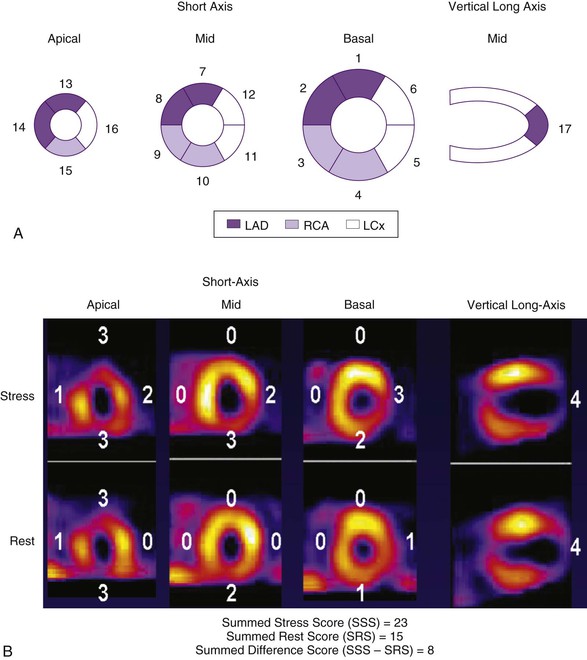
To minimize subjectivity in image interpretation, semiquantitative visual analysis or fully quantitative computer analysis may be applied to MPI data.7 With semiquantitative visual analysis, a score is assigned to represent perfusion for each of multiple segments of the myocardium. A segmentation model has been standardized for this approach by dividing the myocardium into 17 segments9 on the basis of three short-axis slices and a representative long-axis slice to depict the apex (Fig. 16-7). Perfusion is graded within each segment on a scale of 0 to 4, with 0 representing normal perfusion and 4 representing a very severe perfusion defect. Scores for all 17 segments are added to create a “summed” score. The sum of the segmental scores from the stress images—the summed stress score (SSS)—represents the extent and severity of stress perfusion abnormality, the magnitude of perfusion defects related to both ischemia and infarction. The sum of the 17 segmental scores from the rest images (the summed rest score, SRS) represents the extent of infarction. The summed difference score (SDS) is derived by subtracting the SRS from the SSS and represents the extent and severity of stress-induced ischemia. The segmental scores can be assigned subjectively by the image interpreter or automatically by widely available software programs. As discussed subsequently, a substantial literature has validated these summed scores, particularly the SSS, as predictors of natural history outcomes.
Because SPECT MPI data are a digital representation of radiotracer distribution, the data can also be analyzed quantitatively. The most common technique involves creation of a circumferential profile of relative tracer activity around the tomogram of interest, such as a short-axis tomogram. With this technique, each short-axis tomogram is sampled at every 3 to 6 degrees for 360 degrees, along a ray extending from the center of the image ( Fig. e16-1). The maximum counts at a picture element (pixel) along the ray, usually occurring in the mid-portion of the myocardium, are recorded for each angle. The data may be plotted to create a profile of the perfusion pattern of that tomogram relative to the most “normal” area of uptake, which is assigned a value of 100% uptake (see Fig. e16-1). Circumferential profiles for an individual patient can be compared directly with a composite profile representing normal perfusion. The normal perfusion data are created from studies performed in normal subjects with a very low clinical probability of CAD or in those with known normal coronary arteries. A quantitative extent of abnormality can be derived for each tomogram of the individual patient (the total amount of myocardium that falls below the lower limit of normal) as well as a derivation of the severity of the perfusion abnormality (the depth of the patient’s perfusion abnormality relative to the lower limit of normal).
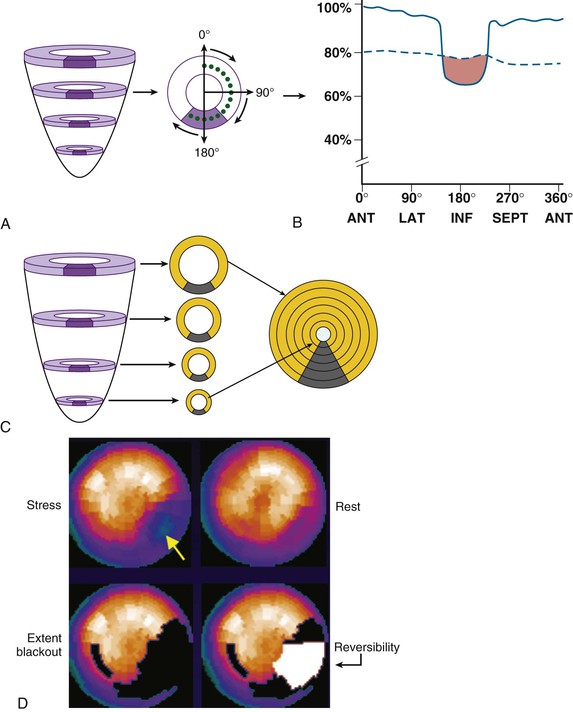
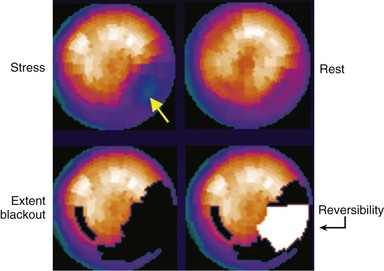
Most contemporary computer systems and analysis programs create bull’s-eye or polar maps representing perfusion of the entire three-dimensional myocardium in a two-dimensional plot (Fig. 16-8; see also Fig. e16-1). Quantitative data may be derived on the extent of global perfusion abnormality, the abnormality within vascular territories, and the extent of reversible and fixed defects. These are often displayed as blackout maps, in which any pixel values falling below a set number of standard deviations below the normal limits is assigned the color black, and the extent of that abnormality is expressed as a percentage of the presumed vascular territory and as a percentage of the left ventricle.
The American Society of Nuclear Cardiology (ASNC) has published guidelines outlining the elements of a comprehensive reporting structure.10
Advantages and Disadvantages of Visual and Quantitative Analysis.
The accuracy of visual analysis is based on many factors, which include the experience and training of the reader as well as the quality of the imaging study. Well-trained readers will incorporate information from the raw data (such as the presence of apparent breast attenuation or an elevated diaphragm potentially attenuating the inferior wall) and adjust their threshold for interpreting an abnormality to optimize accuracy. Visual analysis is inherently subjective, however, and thus subject to variability, both between readers and within an individual reader. The quantitative programs and comparisons to normal data bases can perform with little or no human interaction. Thus the results are highly reproducible. This approach attempts to account for potential artifacts such as breast or diaphragm attenuation by the comparison of patient image data to image data from normal, gender-matched subjects (in which, for example, the lower limit of normal for the anterolateral wall of a woman would be lower than that of a man because of the presence of breast tissue). Nonetheless, artifacts that are not accounted for by the normal data comparison, such as those introduced by motion or other suboptimal quality issues that the trained reader may recognize as probably artifactual, often may be called abnormal by quantitation. In practice, therefore, many readers will interpret MPI studies by visual analysis as well as by incorporating the quantitative data to arrive at a final conclusion. The more objective and reproducible nature of quantitative analysis is a strength with regard to its use in clinical trials that interrogate the effect of therapies on serial changes in myocardial perfusion.

Incorporating Bayesian Principles into Image Interpretation
Although it is possible to interpret MPI data in isolation and report only on what the images demonstrate, a more accepted interpretive methodologic principle is that the final interpretation should take into account the entirety of the data at hand. Hence the image data build on the already known clinical and stress test data, and the clinician should take all of this information into account when interpreting MPI data. An understanding of Bayesian probability principles is useful in this regard. Bayes theorem posits that the post-test probability of disease (or risk of an event after a test) is influenced not only by the sensitivity and specificity of the test but also importantly by the pretest probability of disease (see Chapter 13). This principle is illustrated in Figure 16-9. For a given positive test result, the post-test probability of disease may be distinctly lower in a patient with a very low pretest probability of disease compared with a different patient with a much higher pretest probability (Fig. 16-9A). In practice, MPI results are not simply positive or negative; rather, positive (i.e., abnormal) results can range from borderline-abnormal (uncertainty whether the abnormality may be an artifact or a mild perfusion defect) to strongly abnormal (i.e., extensive and severe defects, highly likely to be real and unlikely to represent artifact). Thus the “test positive” curve in Figure 16-9A can be thought of as a family of positivity curves, with distinct implications for post-test likelihood of disease (Fig. 16-9B).
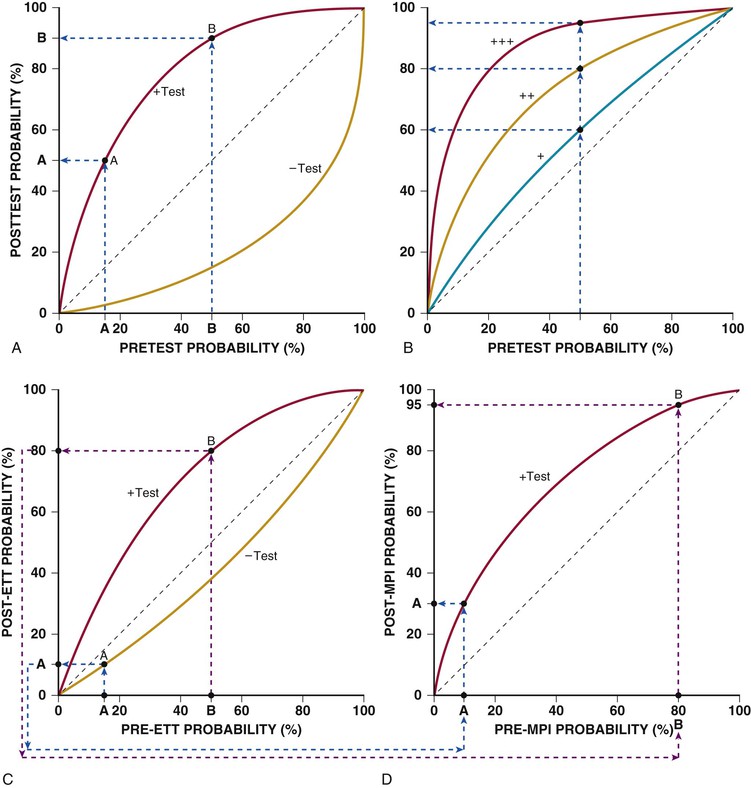
The implication of incorporating these concepts for image interpretation can be illustrated by considering a mildly positive MPI study demonstrating a small mild reversible inferobasal defect. Although it is possible that this defect represents a small area of inferior inducible ischemia, it is also possible that the image may reflect diaphragm attenuation of the inferobasal wall predominantly affecting the stress image. The influence of the pretest probability data (i.e., pre-MPI) is illustrated in Figure 16-9C. For a young patient with nonanginal chest pain, the pretest probability of CAD is low. If the patient undergoes an exercise treadmill test (ETT) (see Chapter 13) as the stress portion of the MPI test and exercises to a good workload with no symptoms and no changes on the electrocardiogram (ECG), the post-ETT probability is even lower. The post-ETT probability then becomes the pre-MPI probability, as seen in Figure 16-9D. A positive test result, especially a mildly positive result, is still associated with a relative low post-test probability of CAD. A result reported as positive is more likely to represent a false-positive than a true-positive finding. By contrast, for an older patient being evaluated for anginal chest pain in whom ETT reproduces those symptoms and who exhibits positive ECG changes, the pre-MPI probability is very high, so the same MPI results are far more likely to represent a true-positive finding than a false-positive finding, as illustrated in Figure 16-9C and D. These examples illustrate how the clinical data may be incorporated into the MPI interpretation and also how Bayesian probability principles may be incorporated sequentially so that the image reader conveys information to the referring clinician that reflects the post-test probability of disease (and risk), rather than simply reporting what the image data show in isolation.
Important Signs in SPECT Imaging Analysis Beyond Myocardial Perfusion
Other abnormal findings provide additional information beyond that indicated by the perfusion pattern alone, including lung uptake of tracer (particularly 201Tl) and transient ischemic dilation of the left ventricle.
Lung Uptake
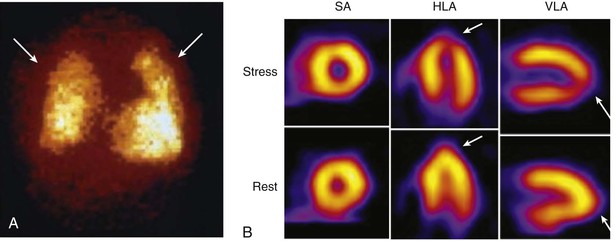
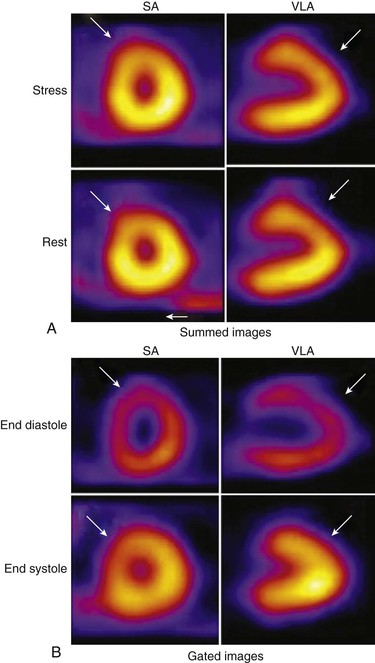
In some patients, substantial tracer uptake is apparent throughout the lung fields after stress that is not present at rest (Fig. 16-10A). Patients with lung uptake often have severe multivessel disease and exhibit elevation of pulmonary capillary wedge pressure and decreases in ejection fraction (EF) during exercise, all implying extensive myocardial ischemia.6 It is likely that ischemia-induced elevation in left atrial and pulmonary pressures slows pulmonary transit of the tracer, allowing more time for extraction or transudation into the interstitial spaces of the lung, accounting for this imaging sign.
Lung uptake of 201Tl has been more extensively validated than lung uptake of the 99mTc tracers sestamibi and tetrofosmin. Splanchnic or background activity is minimal after thallium stress injection, allowing image acquisition earlier after stress. In addition, the redistribution properties of thallium mandate that imaging begin relatively early after stress, so lung uptake may be more apparent.
With the 99mTc perfusion tracers, liver uptake is more prominent than that in the heart immediately after injection; accordingly, image acquisition should begin 15 to 30 minutes after exercise stress injection and 30 to 60 minutes after pharmacologic stress.6 Thus lung uptake, even if it had been present early after stress, may be missed with 99mTc tracers because of the more delayed onset of imaging than with thallium.
Transient Ischemic Dilation of the Left Ventricle
Transient ischemic dilation refers to an imaging pattern in which the left ventricle or left ventricular (LV) cavity appears larger on the stress images than on those obtained with the subject at rest11 (Fig. 16-10B). For patients in whom the entire left ventricle appears larger during stress, the pathophysiology probably is related to extensive ischemia and prolonged postischemic systolic dysfunction, resulting in a dilated, dysfunctional left ventricle during the stress acquisition relative to the rest acquisition. In other patients, the epicardial silhouette appears similar at stress and at rest, but with apparent dilation of the LV cavity. This pattern probably represents diffuse subendocardial ischemia (relatively less tracer uptake in the subendocardium, creating the appearance of an enlarged LV cavity) and also is associated with severe and extensive CAD. Contemporary processing systems can automatically quantify transient ischemic dilation.
Both lung uptake and transient ischemic dilation provide clues to more extensive CAD than may have been suspected from the perfusion pattern alone. Both signs have been associated with angiographically extensive and severe CAD and with unfavorable long-term outcomes; accordingly, such changes are considered high-risk findings.
Common Normal Variations in SPECT Imaging.
Normal variations in perfusion images can be falsely interpreted as a defect. These perturbations from a completely homogeneous tracer pattern throughout the myocardium are related to structural variations of the myocardium as well as to technical factors associated with image acquisition.
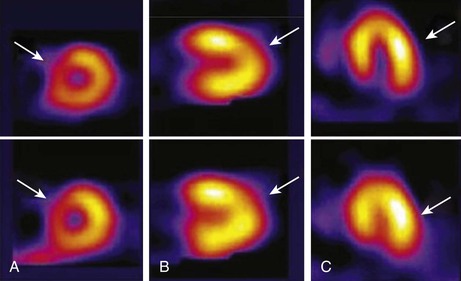
One example is the “dropout” of the upper septum secondary to merging of the muscular septum with the membranous septum (Fig. 16-11A). Apical thinning is another variation of normal that can be mistaken for a perfusion defect (Fig. 16-11B). The apex is anatomically thinner than other myocardial regions, creating this appearance. In normal SPECT images, the lateral wall often may appear brighter than the contralateral septum (Fig. 16-11C). This difference is not due to a disparity in lateral versus septal wall myocardial blood flow. Rather, during a SPECT acquisition, the camera is physically closer to the lateral myocardial wall (in proximity to the lateral chest wall) than to the septum, so that the image is subject to less soft tissue attenuation and the acquisition is associated with more efficient count capture. A careful review of the data for a series of normal volunteers or subjects with a low probability of CAD with one’s own equipment is an important step in minimizing the influence of these normal variations on the sensitivity and specificity for detection of CAD.
Technical Artifacts Affecting Image Interpretation.
Photon attenuation refers to undetected events in the heart due to interaction of photons with the intervening soft tissue, breast, or diaphragm. Attenuation of photons can produce artifactual defects in both positron emission tomography (PET) and SPECT cardiac imaging that mimic true myocardial perfusion defects, thereby reducing specificity (i.e., increasing false-positive findings).
Breast Attenuation.
In patients with large or dense breasts, significant attenuation may create artifacts varying considerably in their appearance and location (Fig. 16-12). A review of the cine display of the raw projection images may reveal the presence of potential breast attenuation.7 The availability of gender-matched quantitative databases has had a favorable although modest impact on this issue, because such databases generally consist of subjects who are of average body and breast size.
Several approaches to minimizing the impact of breast tissue have been taken to improve specificity (lowering the false-positive rate) in women. Most well validated is ECG-gated SPECT imaging with 99mTc-based agents (see further on). The presence of preserved wall motion in the setting of a mildly to moderately severe fixed defect of the anterior or anterolateral wall suggests the absence of infarction and supports the interpretation of attenuation artifact (see Fig. 16-12). Specificity for ruling out CAD in women has been improved significantly with this technique,6 as discussed subsequently.
Inferior Wall Attenuation.
Inferior wall attenuation artifacts are commonly encountered in SPECT imaging. This artifact may be caused by extracardiac structures, such as the diaphragm overlapping the inferior wall (Fig. 16-13). In addition, during a SPECT acquisition, the longer distance from the inferior wall to the camera means that photons must traverse a greater thickness of tissue before reaching the detectors, which may increase the degree of scatter and attenuation.
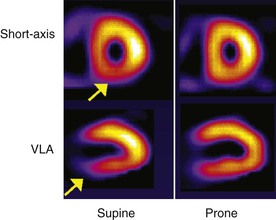
As with breast attenuation artifact detection, the demonstration of preserved wall thickening by gated SPECT imaging may be helpful in distinguishing attenuation artifact from infarct. The patient’s positioning also may minimize the degree of attenuation. By imaging the patient in the prone position,2,7 the inferior wall is shifted away from the diaphragm and is therefore less subject to attenuation (see Fig. 16-13).
Artifacts Related to Extracardiac Tracer Uptake.
Tracer uptake in extracardiac structures can cause artifacts in SPECT images. When such a structure is near the heart, increased counts may reach the detector, falsely elevating the number of counts the system assigns to the nearby cardiac wall, so that the cardiac region is displayed as falsely “hotter.” A second possibility occurs when a nearby hot extracardiac structure causes a “ramp filter” or “negative lobe” artifact.2 This artifact is due to a hot extracardiac structure “stealing” counts from the heart during the calculation of the summed SPECT images. The adjacent myocardium appears falsely “cool.” If substantial extracardiac uptake is noted, image acquisition can be repeated after waiting a longer time before imaging. Having the patient drink cold water may enhance clearance of tracer from visceral organs, particularly the bowel.
Attenuation Correction Methods
The 511-keV photons emitted by positron-emitting radiotracers in PET imaging are attenuated less per centimeter of soft tissue than are the lower-energy 80- to 140-keV photons typically emitted by SPECT radiotracers. In SPECT imaging, a single photon needs to travel from the heart to the camera; in PET imaging, two coincident photons (i.e., emitted simultaneously) need to travel across the entire body to reach their respective detectors (see later under Positron Emission Tomography). Although the total attenuation may actually be greater for PET than for SPECT, an important distinction in the case of PET is that the attenuation is the same along a projection line (the path the pair of photons traverse) independent of how deep in the body the annihilation took place. Thus, in PET, only the total attenuation through the whole body along a specific direction must be known. On the other hand, in SPECT, it is necessary to know the exact depth along a projection line where the radioactive decay took place in order to correct for attenuation. Therefore attenuation correction for SPECT is theoretically more challenging. In recent years, several approaches to correct for attenuation in both PET and SPECT imaging have emerged, with the goal of “correcting” attenuation artifacts to minimize false-positive defects and to improve specificity.
PET Attenuation Correction.
To measure the attenuation correction factor, a rod that rotates about the patient is filled with a relatively long-lived positron emitter, germanium-68, or a single photon emitter, cesium-137. The rod is first made to rotate at a fixed speed in the gantry, and total coincident counts are measured without the patient (the blank scan) and repeated with the patient (the transmission scan). The ratio of coincident counts of blank scan and those of transmission scan yields the array of attenuation correction factors needed to correct each projection line. Once each projection line has been corrected for attenuation (and scatter), the emission data may be reconstructed into an attenuation-corrected emission image for clinical interpretation. So long as the patient does not move during the scanning procedure, cardiac PET images will be free from attenuation artifacts.
Stay updated, free articles. Join our Telegram channel

Full access? Get Clinical Tree


