Noninvasive Vascular Testing
This chapter summarizes the basic principles of selecting, performing, and interpreting noninvasive hemodynamic studies for both arterial and venous problems. It should be emphasized that these noninvasive tests do not replace but supplement a thorough patient history and physical examination (Chapters 4 and 5). In some situations, the results of noninvasive studies help the clinician determine the need for an invasive study such as an arteriogram. In addition, noninvasive tests provide a physiologic baseline before therapy and an objective assessment of outcome after treatment. The use of noninvasive testing has grown exponentially, as the safety and ease of testing is increasingly attractive to clinicians. The temptation to order noninvasive tests without a justifying history and physical exam should be resisted, as unnecessary studies can lead to unnecessary procedures. Additionally, redundant noninvasive tests add to the cost of patient care.
I. The vascular laboratory.
The laboratory should be in a quiet area and located for convenient use by both inpatients and outpatients. A medical sonographer or registered vascular technologist (RVT) usually performs the tests, which are then reviewed by a physician. The setup in a vascular laboratory may be very basic or quite sophisticated, depending on the clinical demand. Consistency and quality assurance should be the goal of all vascular laboratories. Accreditation can be obtained by meeting the standards outlined by the Intersocietal Commission for the Accreditation of Vascular Laboratories.
II. Instrumentation.
The following list of equipment is sufficient for the evaluation of most arterial and venous problems in the noninvasive laboratory. Their basic functions are briefly described.
1. Continuous-wave Doppler system. The Doppler effect states that flow velocity is proportional to the frequency shift in sound waves that are transmitted toward moving blood cells and reflected back to the Doppler-receiving crystal (Fig. 6.1). A handheld Doppler probe is placed over the course of the blood vessel being examined and is coupled to the skin with an acoustic gel. Skin lubricants other than an acoustic gel do not have the proper electrolyte content and can damage the probe crystal. Transmitted sound waves strike moving blood cells and are reflected back to the Doppler probe. An amplifier filters the sound and gives a flow signal or tracing that is proportional to the blood velocity. Just as palpable pulses can be graded with regard to strength, the audible Doppler signal can also be qualified with regard to strength and phasicity.
The normal Doppler signal is triphasic in a high-resistance arterial bed, such as the lower extremity. A triphasic signal has three audible components, corresponding to the forward flow of systole, early reverse flow in diastole, and the later forward flow of diastole. In a low-resistance arterial bed, such as the internal carotid or lower extremity after exercise, flow normally remains forward or prograde. Without reversal of flow in diastole, there are only two components (biphasic) for these signals. With increasing degree of stenosis, wave morphology becomes weak, lower-pitched, and monophasic.
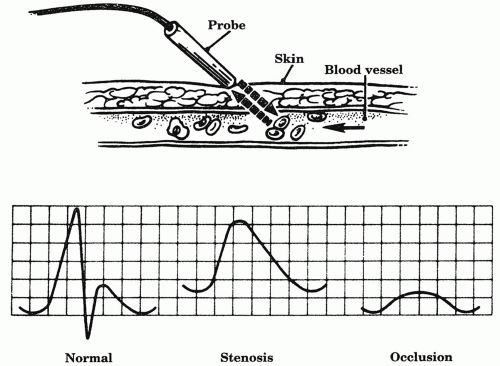 Figure 6.1. Doppler arterial examination. The Doppler probe is coupled to the skin with acoustic gel and angled toward the direction of arterial flow. The normal Doppler arterial signal is triphasic. Stenosis and occlusion cause diminished monophasic signals. |
In practice, a continuous-wave Doppler unit (range, 5-10 MHz) is most commonly used for performing basic noninvasive tests such as segmental pressures. A handheld version is a valuable asset to the bedside arterial and venous exam. Some Doppler units are bidirectional; that is, they can detect direction as well as velocity of flow. Pulsed Doppler, when combined with brightness mode (B-mode) ultrasound, comprises modern duplex. In this setting, pulsed Doppler differs from continuous wave in two ways: (a) bursts of sound waves are emitted, and (b) a distinct portion of flow within a vessel can be selected with the B-mode image of the vessel for Doppler sampling. This technique provides more accurate measurement of frequency (velocity) of flow through the vessel. The velocity pattern correlates with the degree of stenosis, in that a higher velocity suggests a greater stenosis. Although continuous-wave Doppler can also analyze velocity patterns, they collect all velocities from within the vessel and may also receive other signals from adjacent arteries or veins, making signal interpretation more difficult.
2. Plethysmography was one of the earliest means of measuring blood flow in an extremity, using the principle of volume change in an organ or body region. Various techniques of plethysmography have been used, but only a few
remain popular. Both air plethysmography (APG) and photoplethysmography (PPG) are commonly utilized techniques in the noninvasive laboratory. The basic tools for APG are a blood pressure cuff, inflated to optimize contact with the leg, a transducer, and recording instrument. PPG uses a probe that emits infrared light into the superficial skin layers and a photoelectric detector that measures the reflected light. The amount of light absorbed depends on the blood volume in the skin. A waveform is transduced and recorded corresponding to the blood flow.
remain popular. Both air plethysmography (APG) and photoplethysmography (PPG) are commonly utilized techniques in the noninvasive laboratory. The basic tools for APG are a blood pressure cuff, inflated to optimize contact with the leg, a transducer, and recording instrument. PPG uses a probe that emits infrared light into the superficial skin layers and a photoelectric detector that measures the reflected light. The amount of light absorbed depends on the blood volume in the skin. A waveform is transduced and recorded corresponding to the blood flow.
3. Duplex ultrasound combines two technologies for the evaluation of blood vessels. Real-time, B-mode ultrasound provides black and white (gray-scale) images of the vessel and pulsed wave Doppler is used to sample flow velocity in a selected area of the vessel. The angle of insonation should be kept close to 60°, which provides the best return signal for spectral analysis and velocity measurement.
Spectral analysis pertains to the spectrum of different velocities of blood cells and particles traveling in the vessel and provides insight into the degree of narrowing as well as the degree of perfect (laminar) versus imperfect (turbulent) flow. The parameters used for this are (a) spectral width during systole, (b) peak systolic velocity, and (c) end diastolic velocity. A normal spectrum (Fig. 6.2) consists of a relatively low systolic peak velocity (e.g., less than 125 cm/s in the internal carotid) and a narrow band of frequencies during systole, resulting in a clear region or window beneath the systolic peak. In this case, blood cells and particles are traveling the same velocity within the vessel with limited turbulent flow. With even a minimal stenosis, turbulent flow is detected, resulting in spectral broadening during the deceleration phase of systole. Further stenosis results in increased spectral broadening until the entire window beneath the systolic peak is filled, followed by increased peak systolic and then end diastolic velocities. Spectral broadening in these cases reflects the many different velocities of flowing cells and particles within the vessel resulting from the disorderly or turbulent flow.
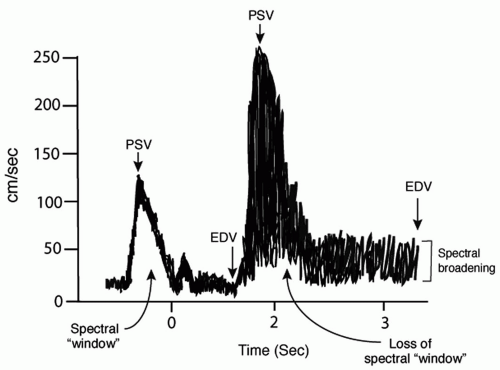 Figure 6.2. Arterial spectrum analysis. The Doppler spectrum analysis allows classification of the degree of stenosis. The most common parameters used for this classification are spectral broadening (with loss of the normal “spectral window”), elevation in peak systolic velocity (PSV; normal <120 cm/sec), and elevation in end diastolic velocity (EDV). |
A third mode, color flow imaging, is helpful in identifying the presence and direction of flow. Red indicates flow toward the transducer, and blue is away. Lighter shades are associated with higher flow and darker shades with lower flow. Laminar flow is uniform in color while a stenosis results in a bright “flow-jet” of color and a mosaic distal to the stenosis reflective of turbulent flow. Color flow is particularly useful for tracing tortuous vessels and identifying areas of ulceration.
4. A treadmill at speeds of 1.5 to 2.5 miles per hour at a 10% to 12.5% grade is used for exercise testing.
5. Transcutaneous oximetry requires a transcutaneous electrode probe and calibrated instrument for measuring oxygen tension on the skin, which is used as a surrogate marker for blood flow.
6. Blood pressure cuffs of various sizes, including miniature cuffs for digital pressures, should be available.
III. Lower-extremity arterial occlusive disease.
Noninvasive laboratory evaluation of the lower extremities is useful in the setting of chronic intermittent claudication (tiring or pain in the extremity with walking) as well as more severe critical leg ischemia (ischemic rest pain or tissue loss). Noninvasive vascular testing documents the severity of disease, provides a baseline for follow-up, and can help predict potential for healing ulcers. Testing can sometimes help the clinician clarify whether leg pain is related to peripheral vascular disease or nonvascular etiologies in patients with atypical symptoms. However, no amalgamation of vascular tests is a substitute for a thorough history and physical examination.
A.
Ankle-brachial index (ABI) provides useful information about lower-extremity perfusion as a supplement to the physical exam. This test can be performed at the bedside with a handheld Doppler and a manual blood pressure cuff. The Doppler probe is placed over an arterial signal at the foot, typically the dorsalis pedis or the posterior tibial artery (Fig. 6.3). A blood pressure cuff on the calf is inflated until the arterial signal occludes or disappears. As the cuff is deflated, the pressure at which the signal is again audible is recorded. The test should be performed in the supine position and the greater of the two pressures at the foot selected as the numerator in the ABI equation. Next, the pressure of each arm is recorded in a similar manner and used as the denominator in the equation. If there is more than a 10 mm Hg difference between arm pressures, the higher pressure should be selected, keeping in mind that a diminished arm pressure could indicate a subclavian artery stenosis. Normally, the pressure in the leg is slightly higher than that in the arm, due to a higher resistance in the lower extremities and the normal ABI ≥1.0.
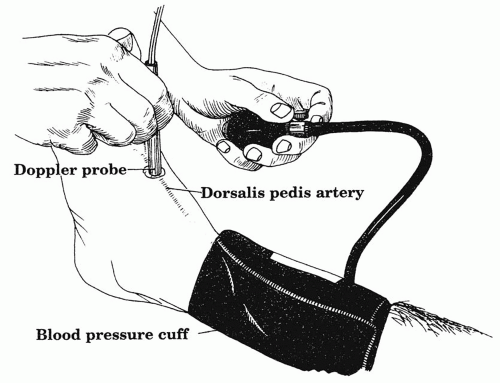 Figure 6.3. Measurement of ankle blood pressure with a standard blood pressure cuff and a handheld continuous-wave Doppler unit. This ankle pressure can be compared to the brachial (arm) blood pressure to calculate the ankle-brachial index (ABI). |
When performed in the noninvasive lab, ABIs may be combined with a plethysmograph for pulse volume recordings. In this setting ABI measurements provide more complete and standardized data that can be used as part of the clinical assessment over time of patients with lower-extremity occlusive disease. ABIs should also be performed following an open or catheter-based revascularization in order to confirm improvement and establish a new baseline. A change in an ABI value of more than 0.15 over time or following revascularization is generally termed a significant change in perfusion.
Lower-extremity circulation is often divided into three levels: aortoiliac, femoropopliteal, and tibial (Chapter 14). In limbs with one level of occlusive disease, the ABI is usually 0.5-0.85, while an index of less than 0.5 indicates multilevel disease. ABIs may be falsely elevated or even noncompressible in patients with longstanding diabetes or end-stage renal disease. Patients with these medical conditions may develop medial calcinosis of the tibial vessels, which render them difficult or impossible to compress with a manual blood pressure cuff. In some cases the Doppler signal in the foot will not occlude despite inflating the cuff to pressures that are well above the systolic blood pressure and are uncomfortable for the patient. In such instances, the ABI calculation should not be pursued but simply be termed noncompressible. In this situation, combining PVRs with ABIs can provide more complete information. Table 6.1 lists common clinical scenarios found in association with several categories of ABIs. However, it must be remembered that many patients with abnormal ABIs do not fall in these allotted categories. Over two-thirds of patients with abnormal ABIs are asymptomatic, as a result of well-developed collaterals or a sedentary lifestyle.
Table 6.1. Categories of clinical severity for the ankle-brachial index (ABI) | ||||||||||||
|---|---|---|---|---|---|---|---|---|---|---|---|---|
|
B.
Toe pressures are useful in patients with medial calcinosis of the tibial vessels, as digital vessels of the toes are often spared from the process. A 2 cm cuff is applied to the great toe and a PPG sensor is placed on the tip because the area is too small to assess with a standard Doppler. The greatest value of toe pressures may be in their ability to predict healing of ischemic foot ulcers or toe or foot amputation sites. A toe-brachial index <0.7 is abnormal in diabetics and nondiabetics and an absolute toe pressure of less than 30 mm Hg suggests insufficient perfusion to heal an open wound of any type.
C.
Pulse volume recording (PVR) is a form of APG, developed by Raines and Darling at Massachusetts General Hospital, in which lower-extremity pulsatility is used as an indirect measurement of arterial flow. In order to perform the test, an air-filled blood pressure cuff of appropriate size is placed on the lower extremity, usually on the calf, and inflated to a baseline pressure of about 65 mm Hg. The cuff is attached to the plethysmograph, and small fluctuations in limb volume as a result of pressure changes are then recorded as arterial contours. The contour provides qualitative information about the arterial blood flow, closely corresponding to the direct intra-arterial pressure waveform recording at that level.
Characterized by a sharp upstroke (anacrotic slope), distinct pulse peak, and rapid decline (catacrotic slope), the normal PVR tracing becomes progressively flattened and prolonged with increasing stenosis (Fig. 6.4). PVRs can be quantified by amount of chart deflection, but laboratories often use different scales. The greatest emphasis is placed simply on qualitative wave morphology. A severely attenuated or flat PVR tracing at the ankle correlates with poor healing. PVRs are particularly useful when combined with ABIs or segmental pressures in order to provide a more complete picture of the limb blood flow. For example, patients with medial calcinosis may have falsely elevated ABIs, such that the PVRs provide a better estimate about the severity of disease (Fig 6.5). The PVR can also be helpful in evaluating the young patient whose claudication may be due to popliteal artery entrapment by the medial head of the gastrocnemius muscle. Such patients usually have normal ankle PVR tracings at rest. With active plantar flexion or passive dorsiflexion of the foot, the gastrocnemius contracts and compresses the popliteal artery, so that the real-time PVR tracing flattens.
D.
Segmental pressures can be useful in patients with abnormal ABIs in order to better approximate the level and degree of arterial obstruction. Measurements are obtained by the same technique as ABIs, except that blood pressure cuffs are placed at several levels—thigh, upper calf, and ankle. The Doppler probe is always placed over the best arterial signal at the ankle level. Two standard 10-12 cm diameter cuffs can be used on the upper and lower thigh. Alternatively, a single large cuff (18-20 cm diameter) can be placed as proximal as possible on the thigh. In general, the larger thigh-to-cuff ratio will result in higher pressures in the thigh than the ankle, so that the normal thigh—brachial index is 1.3 to 1.5.
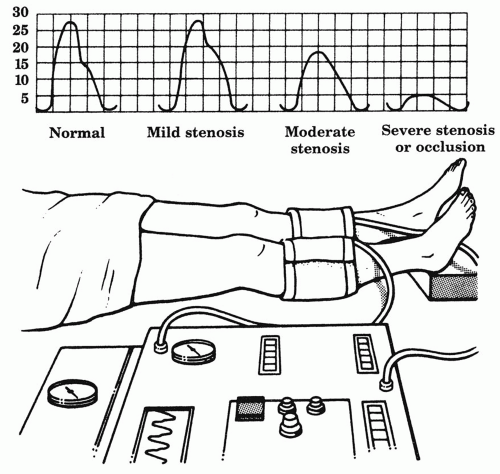 Figure 6.4. Pulse volume recordings. The normal pulse volume recording becomes progressively flattened and prolonged with increasing arterial stenosis. |
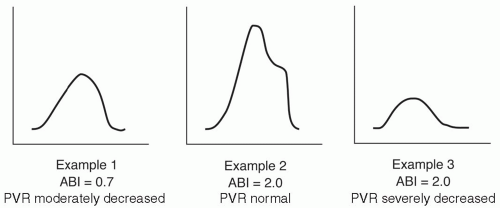 Figure 6.5. Ankle brachial index (ABI) and pulse volume recording (PVR) are complementary, as shown in these examples. In example 1, the ABI of 0.7 is decreased with a correspondingly dampened PVR waveform, suggesting more proximal peripheral arterial occlusive disease (PAOD). In example 2, the ABI of 2.0 is well above the normal range indicating incompressible tibial vessels due to medial calcinosis. However, the PVR in this example is normal suggesting no significant PAOD. In example 3, the ABI is 2.0 in conjunction with a severely dampened PVR, consistent with both medial calcinosis and severe PAOD. |
Some decrease in pressure from proximal thigh to ankle is normal, but a pressure decrease of 15-30 mm Hg between adjacent segments suggests an intervening stenosis. Segmental pressures should also be compared at the same level between legs, as a lack of symmetry implies arterial disease in the leg with lower pressures. Figure 6.6 provides examples of arterial occlusive disease at various anatomic levels.
PVRs are usually combined with segmental pressures at each level to improve accuracy, especially in patients with falsely elevated pressures from calcified vessels. Segmental PVR tracings normally show augmentation from the thigh to calf, caused by differences in cuff volume and a high ratio of well-vascularized calf muscle. Therefore, the calf PVR should have greater amplitude than that of the thigh. If it does not, a superficial femoral artery lesion should be suspected. Disease in the common or proximal superficial femoral artery can mimic aortoiliac disease by causing a decrease in the thigh pressure, particularly if a single large cuff is used on the thigh. Of course, simple palpation of the femoral pulse can also distinguish between aortoiliac and superficial femoral artery occlusion. Segmental pressures can also be misleading when collateral blood flow is so well developed that a significant gradient is not present across an occlusive segment. These limitations of segmental leg pressures emphasize that results must be combined with findings on physical exam for accurate detection of the occlusive lesions.
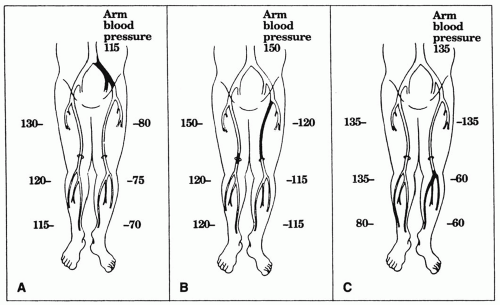 Figure 6.6. Segmental leg pressures. (A) Segmental leg pressures in a normal lower extremity (right) and one with isolated left iliac artery occlusion (left
Get Clinical Tree app for offline access
Stay updated, free articles. Join our Telegram channel
Full access? Get Clinical Tree


|