Myocardial Mechanics and Speckle Tracking
Dr Grant Heatlie
University Hospital of North Staffordshire, Stoke on Trent, UK
Much of the assessment of ventricular function is aimed at the qualitative or quantitative assessment of global ventricular function (Chapter 15). Qualitative assessment of regional function (Chapter 16) is well described and forms an integral part of every echo. However, echocardiography can also offer an insight into the detailed local function of the myocardium and provide quantification of regional function.
To assess the regional function of a segment of myocardium the ideal measure would be contractility – the ability of a segment of heart muscle to develop a force. The force developed has two effects – it causes the muscle both to deform (i.e. shorten or lengthen) and also to move. Consequently both deformation and movement (velocity) must be expressed when describing the effects of the force generated by the muscle.
However, the force itself cannot be directly measured. This is rather like watching a weightlifter – it is difficult to measure the force his biceps generate, but easier to assess the effects of this force – how quickly the dumbbells move upwards (velocity) and the change in the shape of his arms (deformation). It is also important to recognise that if the weightlifter had very light dumbbells they would be seen to move very differently from heavy dumbbells, despite there being no change in the strength of the weightlifter. The quantities that we measure as a surrogate for strength of the weightlifter (the velocity of lifting and the change in shape of his arms) therefore depend on the weight being lifted.
In the heart, if the measurements of velocity and deformation of a muscle segment are used as a surrogate for contractility, then these will also depend on load – specifically the preload (volume load) and the afterload (blood pressure, aortic stenosis, etc.). Therefore, in common with all other measurements from echo, the quantification of regional or global myocardial mechanics will be load dependent.
The meaning and measurement of velocity is intuitive and well understood. One method of measurement of velocity has already been described in the previous chapter – ‘Tissue Doppler imaging’ (TDI). In common with blood pool Doppler, TDI is heavily angle-dependent, which presents significant technical challenges. On the other hand, spectral tissue Doppler is a widely practised technique, and every practising sonographer is familiar with the need to align the probe carefully along the direction of flow of blood to ensure accurate measurements.
The concept of strain is less familiar. The principle of a force (stress) causing deformation (strain) is well established in engineering mathematics. Consider, for example, the change in height of the Empire State Building (strain) when King Kong is sitting on the top of it (stress). It is this well-described and well-understood concept of strain that is applied in myocardial mechanics. The deformation (strain) can be used as a surrogate for the force (stress) developed.
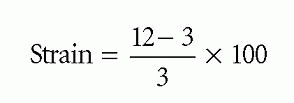
Understanding strain is straightforward – it is simply the percentage change in length. Consider a strip of myocardium that starts off at 3 cm long and then stretches to 12 cm. The change in length is:
12 − 3 = 9 cm
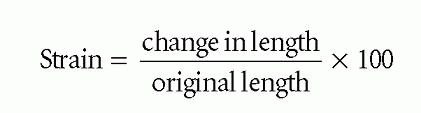
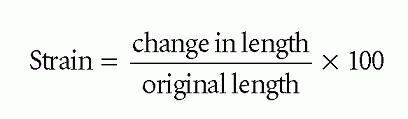
Strain is defined as the change in length divided by the original length, expressed as a percentage:
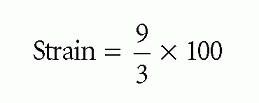
Strain = 3 × 100
Strain = 300%
Strain has no units and is expressed as a percentage, representing the change in length (Fig. 11.1).
If the myocardium then contracts to a length of 6 cm, the change in length (starting from a length of 12 cm) is -6 cm, and the strain is therefore:
Strain = −0.5 × 100
Strain = −50%
A positive strain therefore represents expansion (lengthening) and a negative strain represents contraction (shortening).
Strain rate is how quickly the strain occurs. Average strain rate is calculated by dividing strain by time taken. If, for example, the strain of -50% took 2 seconds then the (average) strain rate is:
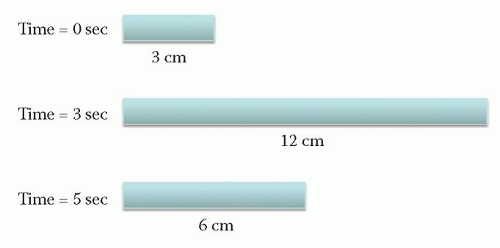 Figure 11.1 The bar changes length in two stages. In the first stage (0-3 s) the strain is 300 per cent. In the second stage (3-5 s) the strain is -50 per cent |
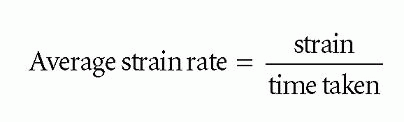
Average strain rate = -25% per second
In contrast with strain, strain rate is not dimensionless and its units are per second.
In principle, these concepts can be applied to any chosen segment of heart muscle and their strain and strain rates calculated. This then allows a detailed analysis of the regional myocardial mechanics within the heart. These descriptors can be derived from either TDI or speckle tracking techniques.
SPECKLE TRACKING
Speckle tracking does not require the acquisition of any extra images during a standard echo examination but relies on post-processing of good quality greyscale images. This is an important advantage over TDI where the angle dependence of the technique can make image acquisition technically challenging.
The observation that there is a fixed pattern of speckles within the myocardium is well recognised. This can be accentuated by turning up the tissue gain. These speckles are more pronounced in infiltrative myocardial disease such as amyloid. The bright and dark areas of the myocardium arise from the interaction of ultrasound with the ultrastructure of the tissue. The ultrasound beam is scattered in all directions from the many small scatterers within the myocardial matrix. The scattered beams then interfere with each other, producing areas of constructive interference (i.e. a peak meeting a peak of another wave and adding up to a bigger peak, or a trough meeting another trough producing a bigger trough). This produces the bright speckles. Areas of destructive interference (peak meets trough producing areas of zero amplitude) produce the dark areas between speckles.
As the speckle pattern is determined by the scatterers in the underlying tissue matrix, the pattern of speckles is fixed for a particular segment of tissue. It is easy to demonstrate this by comparing how the speckles move with the movement of the annulus on M-mode taken along the long axis of a wall (Fig. 11.2). The speckles can
therefore be considered to be acoustic markers bound to the myocardium. Tracking these effectively tracks the myocardial movement.
therefore be considered to be acoustic markers bound to the myocardium. Tracking these effectively tracks the myocardial movement.
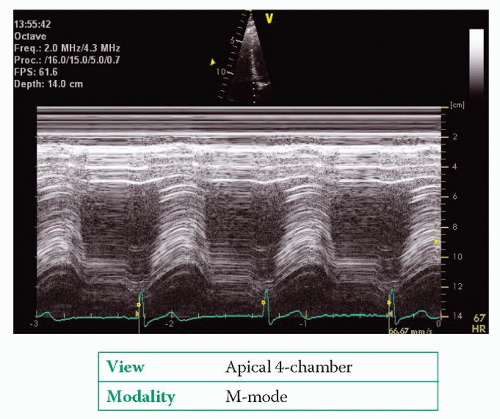 Figure 11.2 M-mode along the length of the septum. Note that the speckles act as myocardial markers and follow the movement of the annulus |
However, it is not possible to track a single speckle throughout the cardiac cycle. As the myocardium contracts and relaxes there are minor changes in the structure of the underlying matrix. This leads to minor changes in the intensity and position of the speckles. To overcome this, the echo machine starts with the first frame of the cine loop and a small area is defined in the position of interest containing a number of speckles. This area is called the kernel. The computer records the position of all the speckles within the kernel above a defined intensity.
Stay updated, free articles. Join our Telegram channel

Full access? Get Clinical Tree


