Prehypertension is a common condition, but the extent to which it increases the risk for coronary heart disease (CHD) is unclear. The aim of this study was to determine the association between baseline prehypertension and risk for CHD by performing a meta-analysis of prospective cohort studies. A systematic search of published research was conducted through January 2013, using electronic databases and bibliographies of retrieved reports. Studies were included if they reported multivariate-adjusted relative risks (RRs) and corresponding 95% confidence intervals (CIs) of CHD with respect to prehypertension. A random-effects model was used to combine the study-specific risk estimates. Eighteen studies, consisting of 934,106 participants and 14,952 cases, with a median follow-up period of 8.8 years, were included. Prehypertension was associated with a significantly elevated risk for CHD (RR 1.36, 95% CI 1.22 to 1.53). Eight studies consisting of 12 cohorts further provided risk estimates for low-range prehypertension (120/80 to 129/84 mm Hg) and high-range prehypertension (130/85 to 139/89 mm Hg) separately. The risk for CHD increased significantly in high-range prehypertensive populations (RR 1.53, 95% CI 1.19 to 1.97) but not in low-range prehypertensive populations (RR 1.16, 95% CI 0.96 to 1.42). In conclusion, prehypertension is associated with a significantly increased risk for developing CHD, particularly high-range prehypertension. Further well-designed randomized controlled trials are needed to clarify the efficacy of blood pressure reduction in subjects with prehypertension.
Epidemiologic data from 1 million adults have shown that blood pressure (BP) is strongly related to coronary heart disease (CHD), with no evidence of a threshold down to 115/75 mm Hg. In 2003, the Seventh Report of the Joint National Committee on Prevention, Detection, Evaluation, and Treatment of High Blood Pressure designated a new category termed prehypertension, for patients with systolic BP of 120 to 139 mm Hg or diastolic BP of 80 to 89 mm Hg. Since that proposal, it has been estimated that 29.7% of the general adult population in the United States falls into the prehypertension category, as does 34.5% of the general Chinese population. Meanwhile, an increasing number of cohort studies have examined the relation between prehypertension and risk for CHD, but the results remain conflicting. Moreover, no systematic attempt has yet been made to summarize the results on this topic. Given the high prevalence of prehypertension and its potential in relation to an increased risk for CHD, we conducted a meta-analysis of prospective cohort studies to quantitatively assess the association between prehypertension and future risk for CHD.
Methods
We undertook a systematic search of the published research using the PubMed, MEDLINE, Embase, and Cochrane Library databases through August 2012, using the following combined text and Medical Subject Headings search strategy: “prehypertension” OR “high normal blood pressure” OR “prehypertensive” AND “coronary heart disease” OR “ischemic heart disease” OR “myocardial ischemia” OR “myocardial infarction” OR “cardiovascular disease” OR “cardiovascular events” OR “cardiovascular mortality” OR “angina” OR “CVD” OR “CHD” AND “cohort study” OR “follow-up study” OR “longitudinal study” OR “prospective study.” No language restrictions were applied. We reviewed the references lists of the retrieved reports to identify additional studies. Also, we conducted a second-round search using the same search strategy in January 2013 to ensure comprehensiveness.
Studies were considered for inclusion if they fulfilled the following criteria: a prospective cohort design; BP measured at baseline; the exposure of interest was prehypertension (120/80 to 139/89 mm Hg); the outcome of interest was CHD, defined as acute myocardial infarction, angina pectoris, and other ischemic heart disease; BP <120/80 mm Hg was defined as the reference; and the relative risk (RR) and its corresponding 95% confidence interval (CI) for CHD relating to prehypertension versus reference were reported. Studies that reported prehypertension subtypes, defined as low-range prehypertension (120/80 to 129/84 mm Hg) and high-range prehypertension (130/85 to 139/89 mm Hg), were also included. If multiple publications from the same study population were available, the most recent and detailed study was eligible for inclusion.
Data extraction and quality assessment were performed independently by 2 investigators, with disagreements adjudicated by a third reviewer. Study characteristics recorded were as follows: first author’s name, publication year, country of origin, cohort name and size, participants’ age and gender, prevalence of prehypertension, duration of follow-up, number of events, exposure and outcome assessments, most fully adjusted risk estimates of CHD with prehypertension and their corresponding 95% CIs, and covariates adjusted in the multivariate analysis. Quality assessment was performed using the Newcastle-Ottawa Scale, which consists of 3 parameters of quality: selection, comparability, and outcome. The Newcastle-Ottawa Scale assigns a maximum of 4 points for selection, 2 points for comparability, and 3 points for outcome. We assigned scores of 1 to 3, 4 to 6, and 7 to 9 for poor-, fair-, and good-quality studies, respectively.
The primary analysis was the RR of incident CHD in relation to prehypertension. Study-specific RRs or hazard ratios were used as the common measure of association across studies. The summary risk estimates were obtained by pooling the study-specific slopes using the inverse of the corresponding variances as weights on the basis of a DerSimonian and Laird random-effects model, which considers within- and between-study variability. For studies that only reported RRs for prehypertension subtypes separately, the study-specific effect sizes were recalculated by pooling the risk estimates of such subtypes using the inverse-variance method. If the result on CHD was not provided, we used data from myocardial infarction as a surrogate. In a secondary analysis, we calculated RRs of incident CHD with prehypertension subtypes respectively.
Subgroup analyses were performed to evaluate the influences of participant and study characteristics on the overall results, according to gender (male vs female), study population (Asians vs non-Asians), participant number (≥10,000 vs <10,000), duration of follow-up (≥10 vs <10 years), end point (fatal CHD vs fatal plus nonfatal CHD), study quality (good vs fair), and whether controlling major risk factors (namely age, gender, smoking, diabetes, cholesterol, and body mass index or other measures of overweight and obesity) were included in models (yes or no). To investigate the influence of individual studies on the summary risk estimate, we undertook a sensitivity analysis by omitting 1 study in each turn and recalculating the pooled estimates on remaining studies.
Statistical heterogeneity across studies was assessed using the Q and I 2 statistics. Publication bias was evaluated with Egger’s test (linear regression method) and Begg’s test (rank correlation method). Statistical analyses were done with Stata version 11.0 (StataCorp LP, College Station, Texas). Two-tailed p values <0.05 were considered statistically significant.
Results
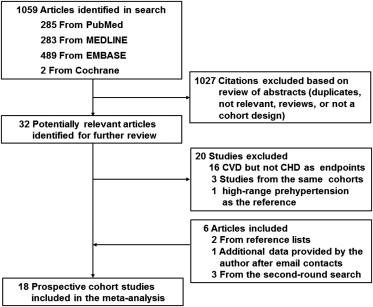
The initial search identified 1,059 citations. On the basis of information from abstracts, 32 reports warranted for further evaluation. After reviewing those reports in more detail, 20 were excluded for reasons shown in Figure 1 . An additional 2 studies were retrieved from the reference lists, 1 report was included after the author provided additional data for risk estimates after e-mail contacts, and 3 additional publications were identified in the second-round search. Ultimately, 18 reports were included in the meta-analysis.
Characteristics of the selected studies are listed in Table 1 . The studies combined included a total of 934,106 participants with 14,952 cases of CHD. The median duration of follow-up was 8.8 years. Participants were free of CHD at baseline in 13 of the 18 included studies, except 2 studies including subjects with histories of CHD, and the remaining 3 studies were not clearly defined. The prevalence of prehypertension ranged from 26.2% to 57.3%. In all studies, CHD events were assessed by medical records, death certificates, or record linkages. Of these, 6 reported results on total CHD (fatal plus nonfatal), 6 on fatal CHD, 2 on total and fatal CHD, and 4 on myocardial infarction. Most of the results were adjusted for age (18 studies), gender (18 studies), smoking (16 studies), body mass index or other measures of overweight and obesity (15 studies), diabetes (10 studies), and cholesterol level (10 studies). On a scale of 9, the overall quality of studies was good (median score 8, range 5 to 9). In addition, 8 studies consisting of 12 cohorts further provided risk estimates for prehypertension subtypes.
| Study | Cohort (Country) | Subjects (Percentage of Men) | Mean Age (yrs) | Prehypertension Prevalence (%) | Follow-Up (yrs) | Outcome (No. of Events) | NOS Score |
|---|---|---|---|---|---|---|---|
| Stojanov et al (2013) | Serbia | 265 ∗ (51%) | 30–60 | 40.8 | 36 | Fatal MI (59) | 7 |
| Hadaegh et al (2013) | TLGS (Iran) | 6,273 (43%) | 47 (≥30) | 34.5 | 9.3 | CHD incidence (ICD-10 codes I20–I25) (444) | 9 |
| Takashima et al (2012) | NIPPON DATA 80 (Japan) | 8,592 (44%) | 49 (30–92) | 41.2 | 21.3 | CHD mortality (ICD-9 codes 410–414 or ICD-10 codes I20–I25) (135) | 8 |
| Aghababaei et al (2012) | Isfahan cohort study (Iran) | 3,255 ∗ (0%) | ≥35 | 36 | 6.7 | CHD incidence (MI, UAP, and sudden cardiac death) (150) | 9 |
| Wu et al (2012) | China | 45,641 (75%) | 30–70 | 34.6 | 4 | Fatal and nonfatal MI (95) | 6 |
| Arima et al (2012) | APCSC | 346,570 ∗ (59%) | 48 (30–90) | 38 | 7 | CHD incidence (ICD-9 codes 410–414) (3,270) | 7 |
| Erbel et al (2012) | HNRS (Germany) | 4,181 (47%) | 59 (45–75) | 26.2 | 7.18 | Fatal and nonfatal MI (115) | 8 |
| Gray et al (2011) | HAHS (United States) | 18,881 (100%) | 18 (15–29) | 50.7 | 56.3 | CHD mortality (ICD-7 code 420) (1,917) | 6 |
| Pednekar et al (2009) | Mumbai Cohort (India) | 148,173 ∗ (60%) | 50 (≥35) | 38.8 | 5.5 | CHD mortality (ICD-10 codes I20–I25) (2,215) | 6 |
| Gu et al (2009) | China National (China) | 158,666 (49%) | 56 (≥40) | 34.5 | 8.3 | CHD incidence (ICD-9 codes 410.0–414.9) (2,132) | 8 |
| Dorjgochoo et al (2009) | Shanghai Women Health (China) | 68,438 (0%) | 55 (40–70) | 39 | 5 | CHD mortality (ICD-9-CM codes 410–414) (91) | 8 |
| Ikeda et al (2009) | JPHC (Japan) | 33,372 † (35%) | 54 (40–69) | 43 | 11 | CHD incidence (ICD-10 codes I20–I25) (182) | 9 |
| Kokubo et al (2008) | Suita Study (Japan) | 5,494 (47%) | 55 (30–79) | 35 | 11.7 | Fatal and nonfatal MI (133) | 9 |
| Onat et al (2008) | TARFS (Turkey) | 3,034 (49%) | 48 ± 12 | 32.8 | 6.6 | CHD incidence (AP, MI, myocardial revascularization) (319) | 8 |
| Hsia et al (2007) | WHI (United States) | 60,785 (0%) | 63 ± 7 | 39 | 7.7 | Nonfatal MI (1,389) | 9 |
| Kshirsagar et al (2006) | ARIC (United States) | 8,960 (45%) | 53 (45–64) | 37 | 11.6 | CHD incidence (ICD-9-CM codes 410–414 or 429.2) (671) | 9 |
| Qureshi et al (2005) | Framingham Heart Study (United States) | 5,181 (45%) | 44 ± 9 | 41 | 31 | CHD incidence (CHD death, AP, MI, or coronary insufficiency) (1,401) | 9 |
| McCarron et al (2002) | Glasgow University (United Kingdom) | 8,345 ∗ (100%) | 21 | 57.3 | 41.3 | CHD mortality (234) | 5 |
∗ The classification of participants taking antihypertensive medications was not clearly defined.
† Antihypertensive drug users were classified according to BP levels at baseline.
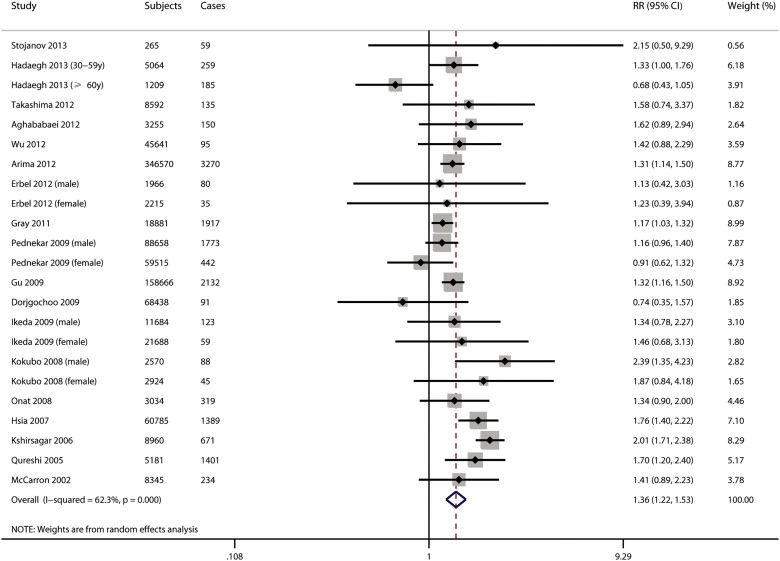
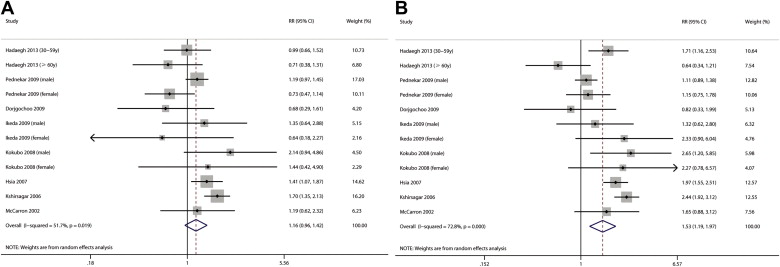
The multivariate-adjusted RRs for incident CHD with prehypertension versus reference for each study and all studies combined are presented in Figure 2 . Overall, patients with prehypertension compared with the reference group experienced significantly increased risk for developing CHD (RR 1.36, 95% CI 1.22 to 1.53). Substantial heterogeneity across studies was observed (I 2 = 62%, p <0.001). Meanwhile, the RR for CHD in patients with hypertension, summarized from the included studies, was 2.07 (95% CI 1.83 to 2.33, I 2 = 71%, p <0.001; data not shown). In a secondary analysis stratified by prehypertension subtypes, the risk for CHD incidence significantly increased among high-range prehypertensive populations but not low-range prehypertensive populations. The summary risk estimates of CHD incidence were 1.53 (95% CI 1.19 to 1.97, I 2 = 73%, p <0.001) for high-range prehypertension and 1.16 (95% CI 0.96 to 1.42, I 2 = 52%, p = 0.019) in low-range prehypertension ( Figure 3 ).
Prehypertension associated with an increased risk for CHD was not substantially modified in all of the subgroups ( Table 2 ). Notably, the observed positive association was more pronounced in several strata of study characteristics: male participants, non-Asian populations, studies with good quality, and studies that controlled major risk factors in models. Nevertheless, substantial heterogeneities were observed in most subgroups. In sensitivity analyses, the RRs were similar without great fluctuation, ranging from a low of 1.30 (95% CI 1.19 to 1.44) to a high of 1.40 (95% CI 1.26 to 1.56) via omission of the study by Kshirsagar et al and the study by Hadaegh et al, respectively (data not shown).


